SIGN UP FREE

Infographics for Surveys


What are InfoGraphics?
QuestionPro InfoGraphics or information graphics are graphical visual representations of your survey data. These graphics present complex information quickly and clearly. InfoGraphic survey report can be used when there are close-ended/select type questions in your online survey. The InfoGraphics survey report is a data visualization tool which represents the data within dashboard that can be used by managers or customers.

How to use InfoGraphics
InfoGraphics survey report is automatically created when data is collected in your survey. This report has been designed to give an overview of your survey data during meetings and presentations. The InfoGraphics report gives you a quick overview of your participant statistics as well.

Features of InfoGraphics Survey
The InfoGraphics Survey report brings with it some impactful and amazing features:
  • Classification of overall participant statistics.
  • Segmentation of respondents by countries.
  • Trend chart of responses - daily, weekly or monthly.
  • Customization of reports by selecting specific questions and adding logos.

The QuestionPro Advantage
  • Free account never expires, unlimited surveys!
  • Pro accounts for as low as $12.
  • No contracts. No commitments.
  • UNLIMITED surveys.
  • UNLIMITED responses.

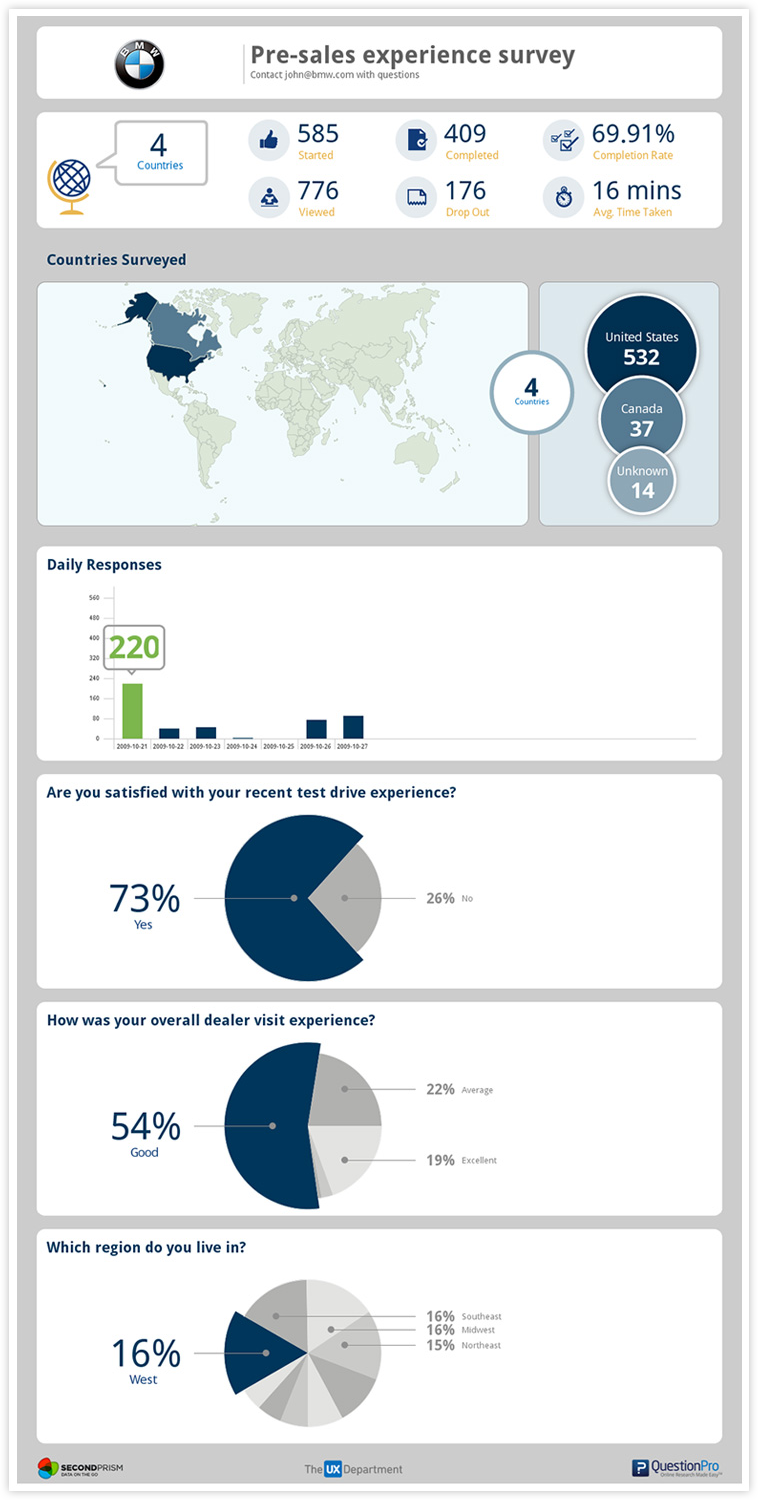
More reasons to get started? Take the tour and find out why QuestionPro is the leader in online surveys.

INC500

We're one of America's fastest growing private companies!

We are placed 172nd with 1390% growth.

We help thousands of happy customers

Brands
Join QuestionPro Now! It's completely Free!