How we created our Analytical System for Billions of Rows
QuestionPro is one of the world’s leading enterprise survey platforms, which means we collect a significant amount of data every single day. As a data-centric company, we live and breathe numbers. To give you some perspective, we handle around 5 million requests daily, which translates to approximately 1.8 billion responses a year.
But raw requests don’t tell the whole story of our data footprint. When we look at what’s actually stored in our databases to understand user behavior and survey results, the scale is staggering: we’re talking about ~500 billion rows of data.
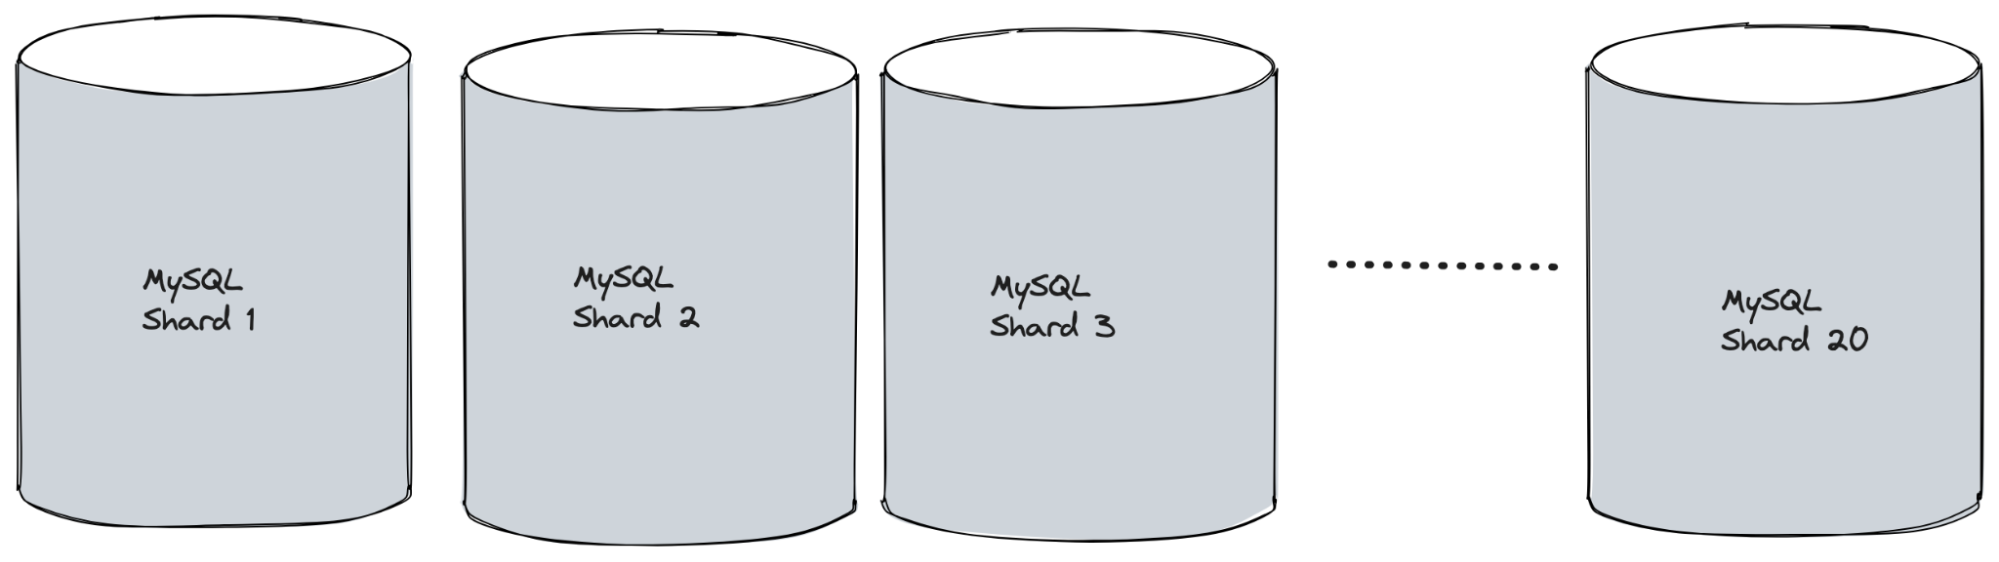
Storing this volume in a single MySQL database instance is simply not feasible—it would grind to a halt. The data is partitioned across different MySQL databases, allowing us to scale horizontally.
The Bottleneck
When we fire our analytical queries like which aggregates data using count/sum even with a fully sharded architecture, we were hitting performance walls. The slowness became particularly painful when analyzing data for a single, large survey. For surveys with over 10 million responses, it could take up to 30 seconds to get a correct answer, which was unacceptable for our users.
We tried everything in the traditional playbook: optimizing indexes, tweaking configurations, and rewriting queries. Despite our best efforts, the benefit was minimal. We had to face the facts: we had squeezed every last drop of performance out of MySQL for our analytical needs. It was time to look for a new solution—a different kind of database.
The Search Begins
Our quest for a new analytical database began. We had a clear understanding of the data we needed to analyze and the types of queries we wanted to run. We shortlisted several promising candidates:
- MongoDB
- Elasticsearch
- Google BigQuery
- Apache Druid
- ClickHouse
- Apache Pinot
Each database came with its own set of pros and cons. Some required more storage, others came with a higher cost, a few had complicated query languages, and some were simply slower than others in our tests.
After a thorough evaluation, one database emerged as the clear winner, solving our most critical problems: ClickHouse. The query performance was astounding. Aggregations on over 100 million records completed in milliseconds. We were thrilled.
Productionizing ClickHouse
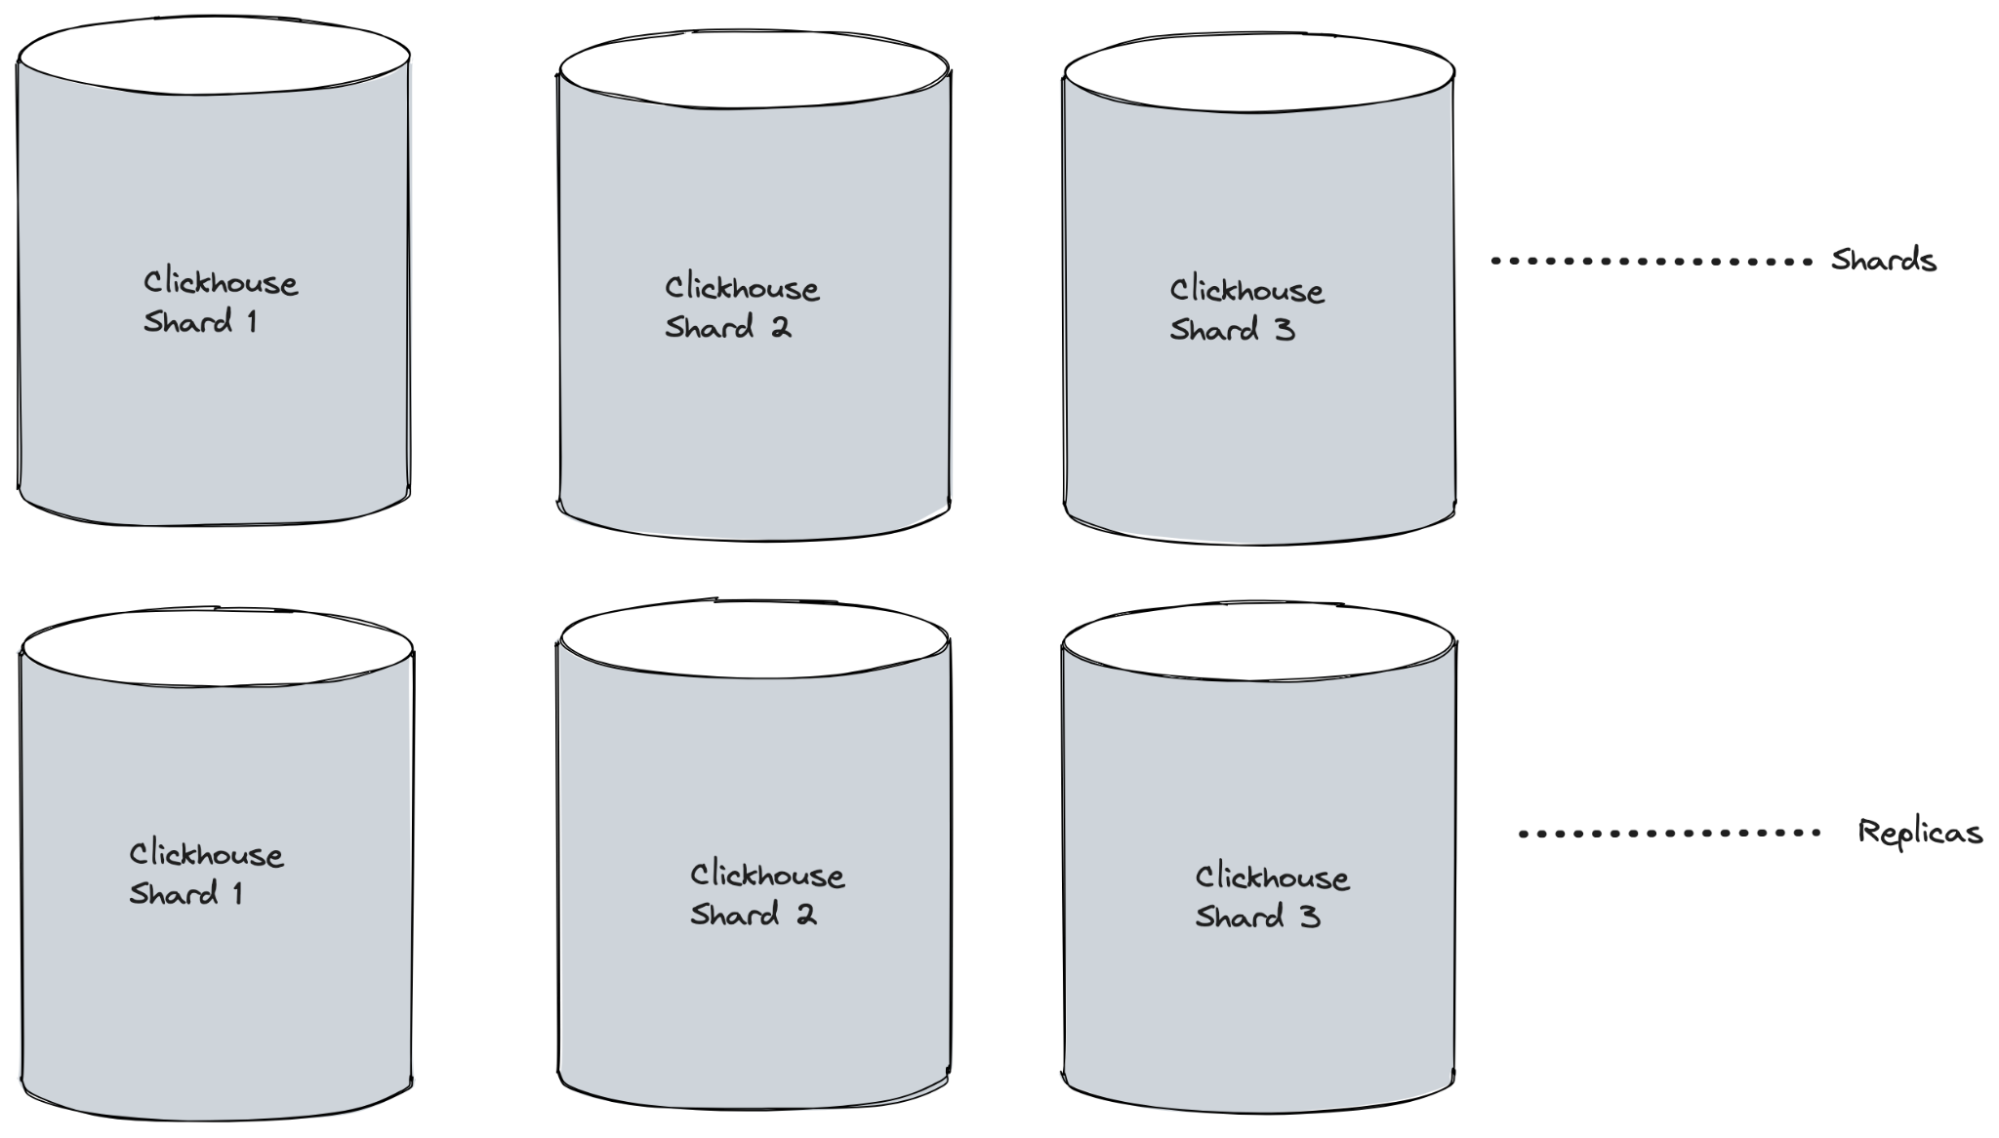
We designed our new ClickHouse system for resilience and scale from day one. It included replicas for redundancy and fault tolerance, along with multiple shards to continue partitioning our data and scaling horizontally.
What’s Next? Making Analytics Real-Time
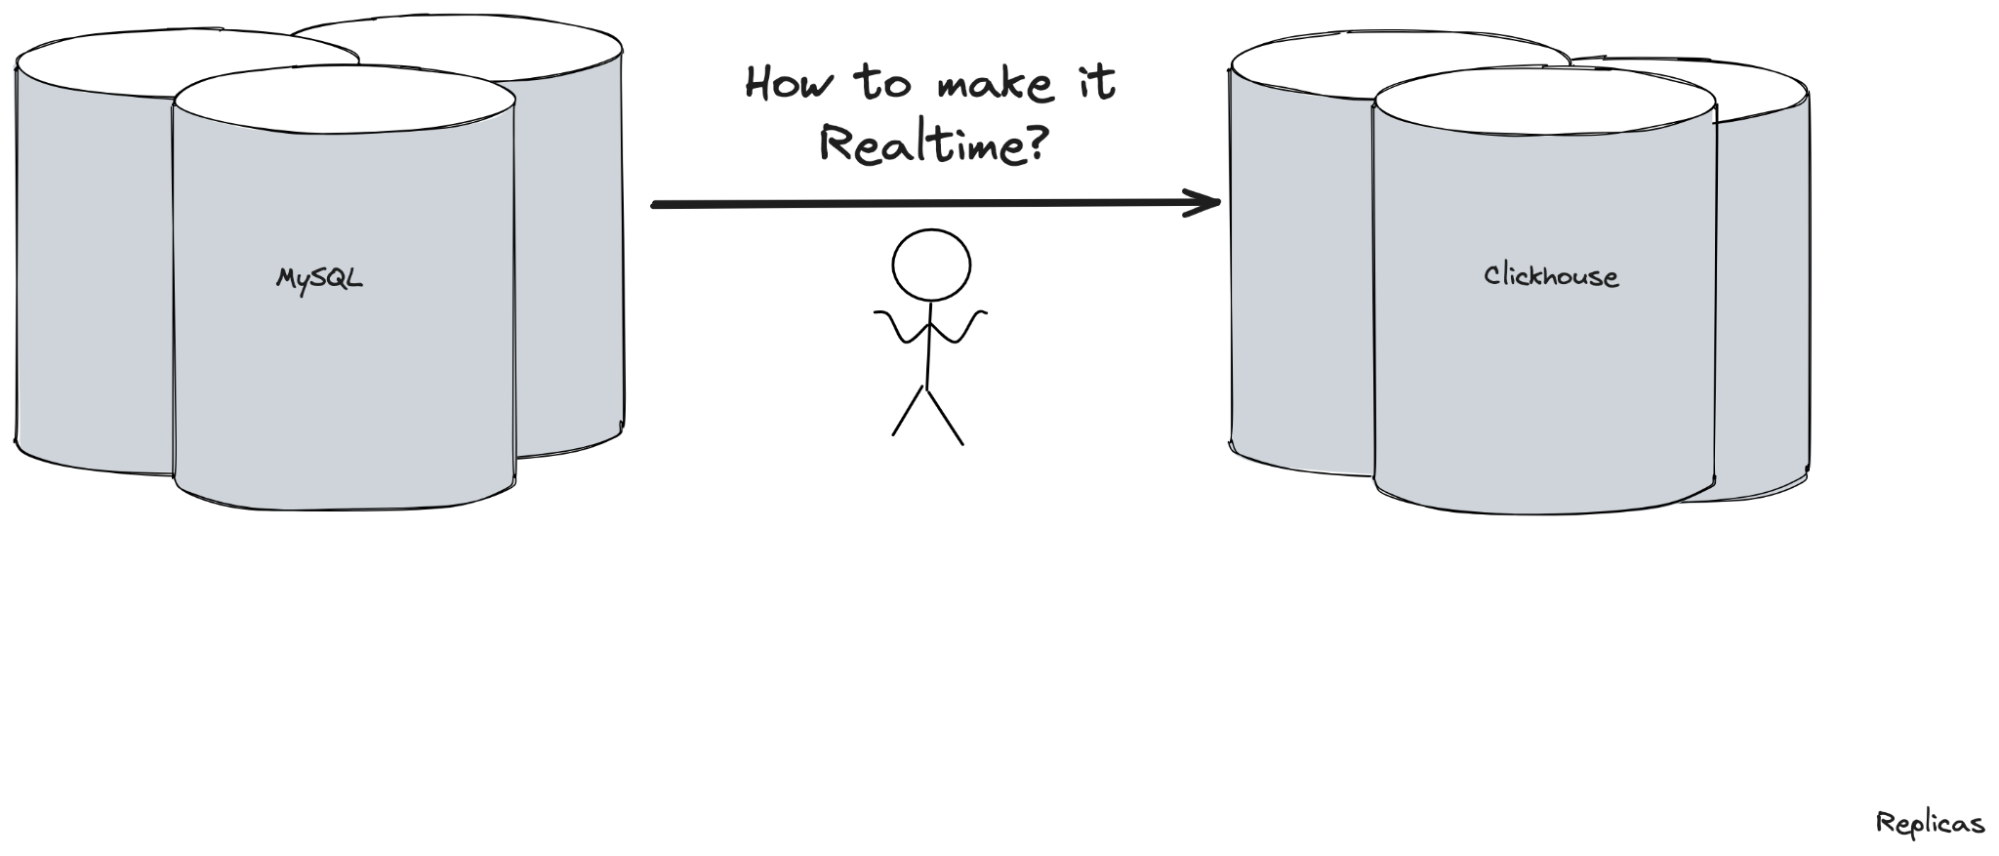
With the performance problem solved, a new challenge emerged: real-time data availability. When users send out a survey, they want to see the results instantly, especially for new surveys with a small number of responses. This meant our analytical database needed to have near real-time data.
We started looking for solutions to transfer data from our production MySQL databases to ClickHouse. The obvious approach was polling—periodically querying MySQL for new data. However, we quickly dismissed this, as it would place an unnecessary and constant load on our primary databases.
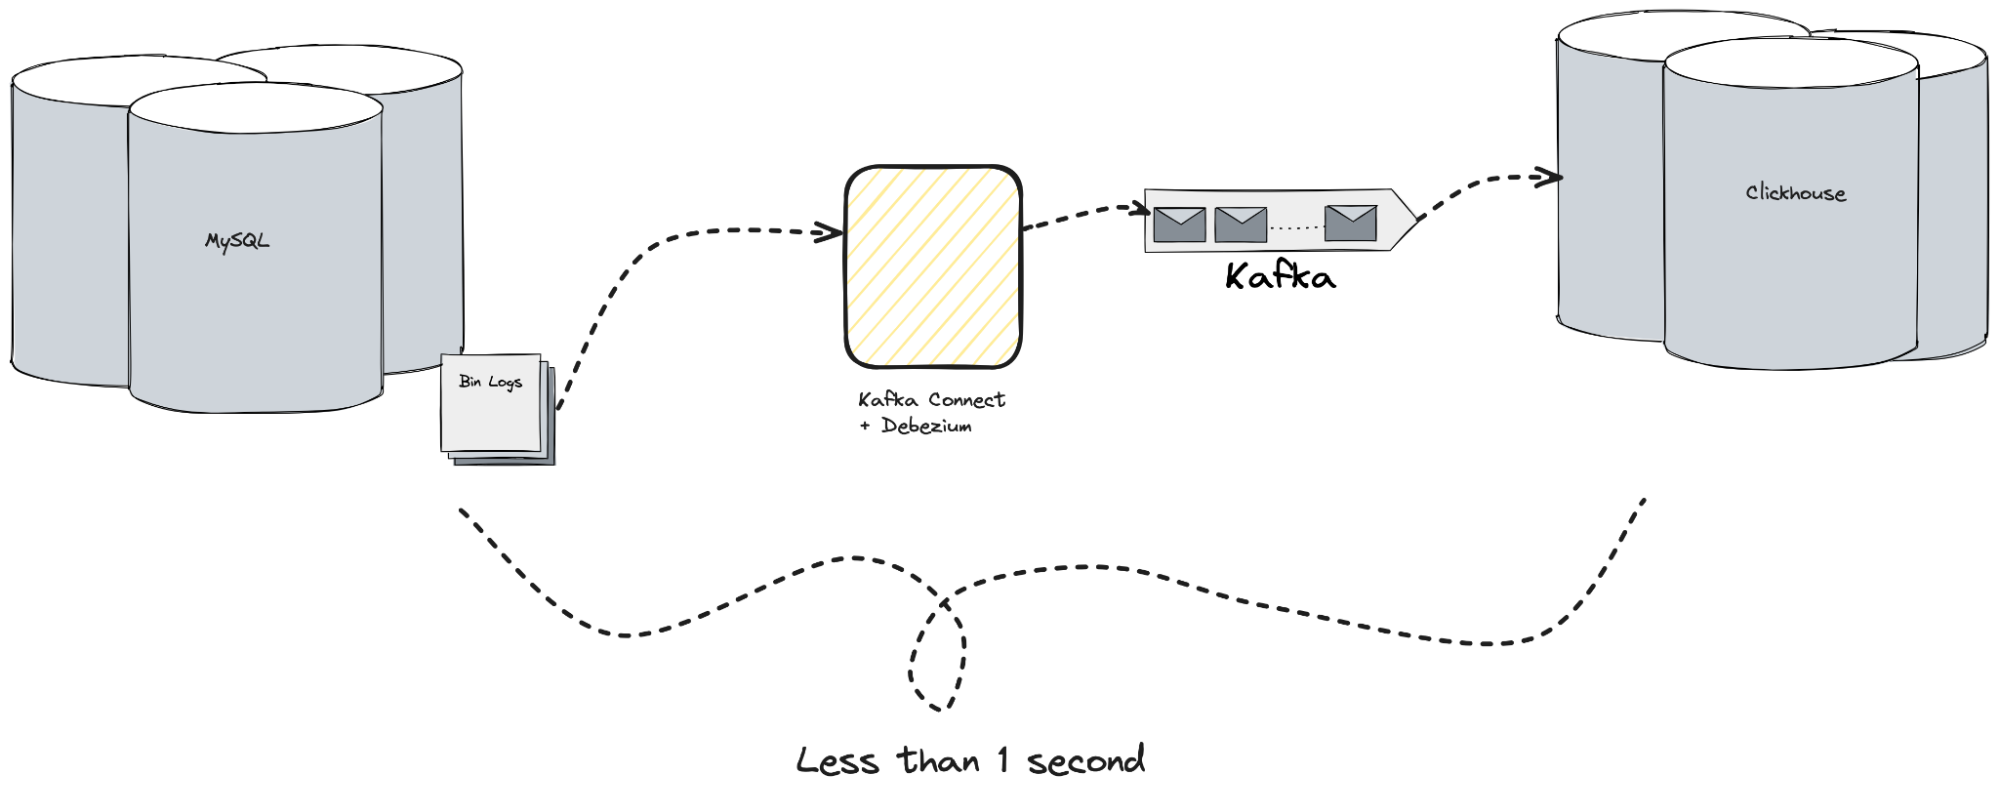
Instead, we found a much more elegant solution: MySQL binlogs. Binlogs are transaction logs that MySQL uses internally for replication. Essentially, any DML operation (CREATE, UPDATE, DELETE) creates an entry in these logs. We realized we could tap into this existing mechanism. Instead of replicating from MySQL to another MySQL server, we would replicate from MySQL to ClickHouse via Kafka.
To achieve this, we built a pipeline using two powerful systems:
- Debezium + Kafka Connect: This stack reads data directly from the MySQL binlogs and streams it into Kafka topics in real-time.
- Kafka: Acting as a highly scalable, high-throughput pub-sub message bus.
ClickHouse has the native ability to connect to Kafka and ingest data streams, and we could even perform transformations within ClickHouse itself. This gave us a complete, end-to-end ELT (Extract-Load-Transform) system. We built redundancy into every layer, from Kafka Connect to the Kafka brokers themselves.
The result? We could transfer data from MySQL to ClickHouse in under one second.
Was it this smooth? - Hell No
Our first task was to change MySQL’s binlog format from Mixed to Row. This change was critical, as the Row format was necessary to read data from the binary logs. While this might seem straightforward, we successfully executed this migration with zero downtime.
However, this solution introduced a new problem: the Row format dramatically increased storage consumption, as it records the entire row’s data for every single transaction. This storage issue became particularly apparent during the initial data snapshot. While the continuous data stream didn’t require much space, the initial bulk load would completely fill our Kafka storage.
Throughout this project, we faced and fixed numerous other issues. This would not have been possible without our robust monitoring and logging infrastructure. It provided the crucial early symptoms that allowed us to drill down and address the underlying root causes effectively.
Monitoring and Observability
A system this critical requires robust monitoring. We went beyond the basics of liveliness, readiness, CPU, and memory usage. We implemented key performance indicators specific to our pipeline, including:
- End-to-end latency: The time taken for data to travel from MySQL to Kafka, and from Kafka to ClickHouse.
- Throughput: The volume of data moving through the system, measured in bytes and messages per second.
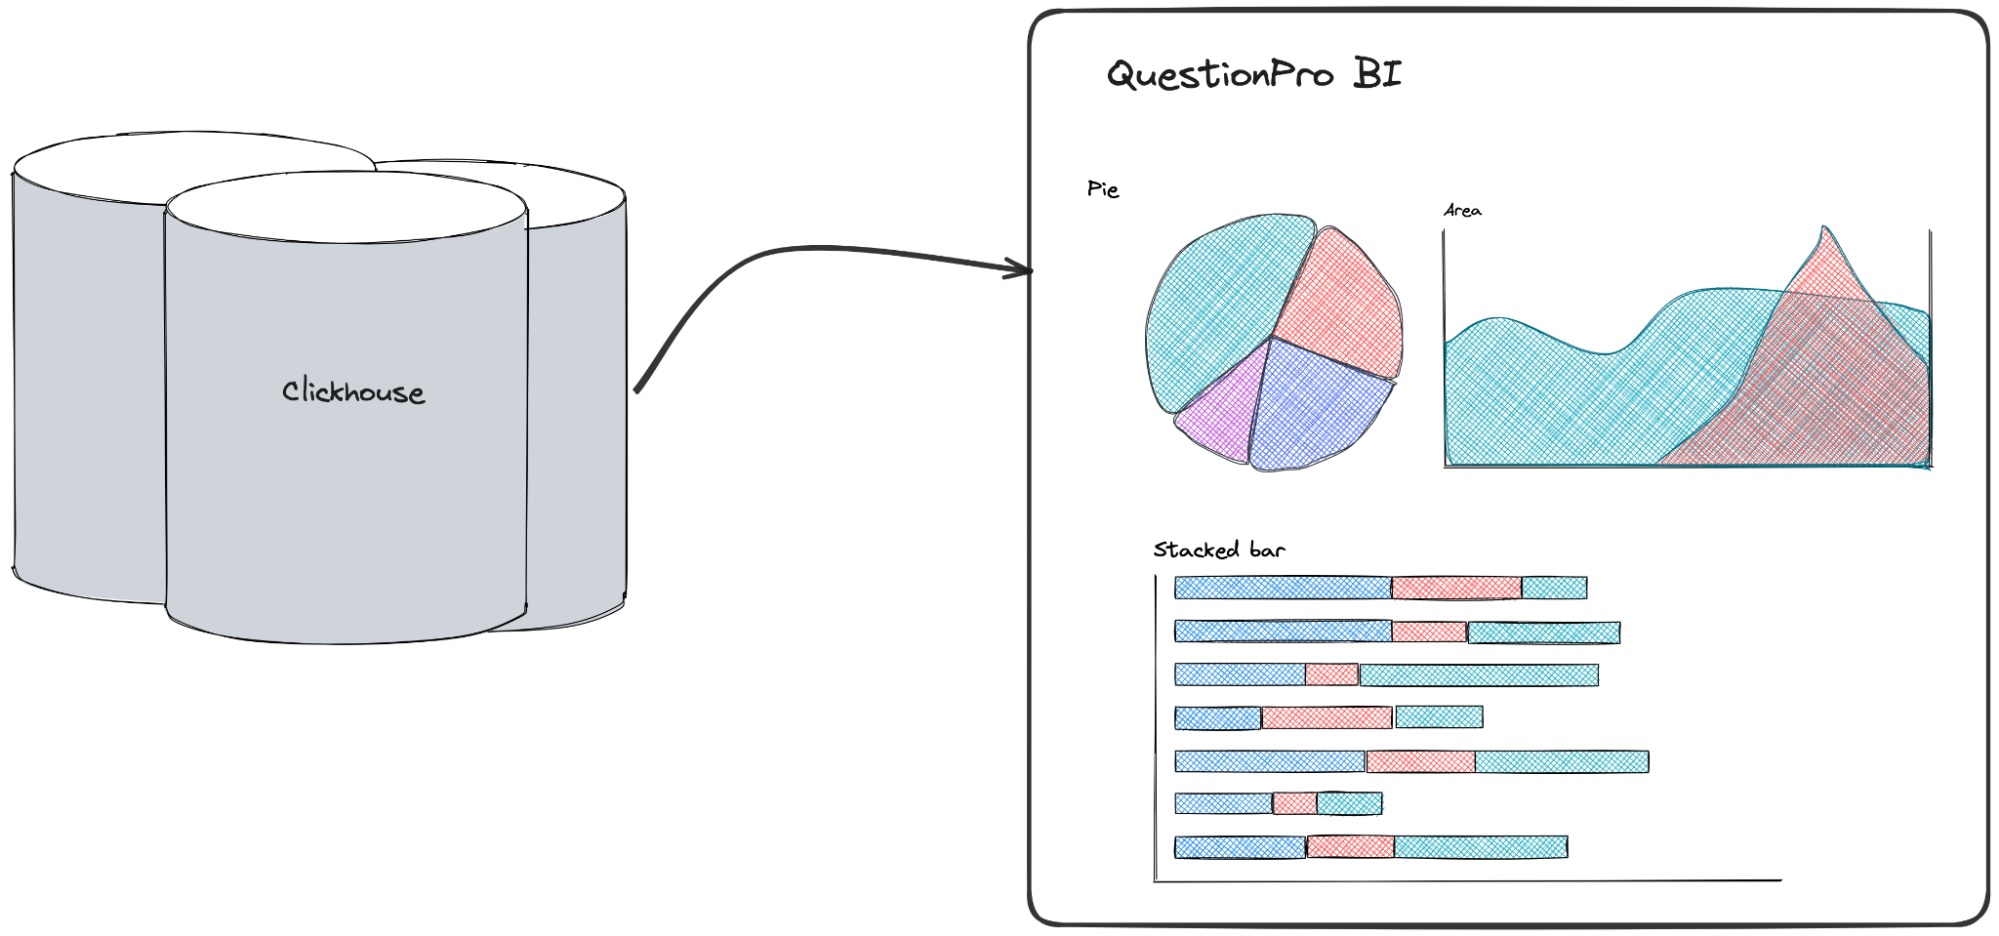
Thanks to this powerful and resilient architecture, we successfully built a blazing-fast BI and analytics system called “QuestionPro BI” capable of delighting our users with instant insights from billions of records.