The analysis helps you make informed decisions regarding your diet and calorie consumption.
Cross-tabulation is a mainframe statistical model that follows similar lines. It helps you make informed decisions regarding your research by identifying patterns, trends, and the correlation between your study parameters. When conducting a study, the raw data can usually be daunting. They will always point to several chaotic possible outcomes. In such a situation, cross-tab helps you zero in on a single theory beyond doubt by drawing trends, comparisons, and correlations between mutually inclusive factors within your study.
For example, consider your college application. You probably did not realize it then, but you were mentally cross-tabulating the factors involved to arrive at a conscious decision concerning the colleges you wanted to attend and had the best shot at while applying. Let us go through your decision-making process one factor at a time.
First, you needed to look at the academic factor: your grades throughout high school, SAT scores, the field you wanted to major in, and the application essay you would need to write. Second, comes the financial factor, which will look at the tuition fees and possibilities of a scholarship. Lastly, it would be the emotional factor which will consider your distance from home and how far are the universities your friends are considering, so reunions would not be an issue. In other words, cross-tabulating Academics + Finance + Emotions led you to a refined list of universities, one of which is or soon will be your Alma Mater.
Cross-tabulation, also known as cross-tab or contingency table, is a statistical tool used for categorical data. Categorical data involves values that are mutually exclusive to each other. Data is always collected in numbers, but numbers have no value unless they mean something. 4,7,9 are merely numerical unless specified—for example, 4 apples, 7 bananas, and 9 kiwis.
Researchers use cross-tabulation to examine the relationship within the data that is not readily evident. It is quite useful in market research studies and surveys. A cross-tab report shows the connection between two or more questions asked in the study.
Understanding cross-tabulation with example
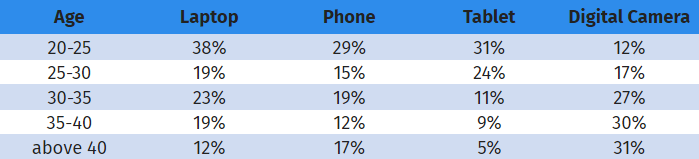
Cross-tab is a popular choice for statistical data analysis. Since it is a reporting/ analyzing tool, it can be used with any data level: ordinal or nominal. It treats all data as nominal data (nominal data is not measured. It is categorized). For example, you can analyze the relation between two categorical variables like age and purchase of electronic gadgets.
There are two questions asked here:

You can see the distinctive connection between age and the purchase of electronic gadgets in this example. It is not surprising but exciting to see the correlation between the two variables through the data collected.
In survey research, crosstab allows us to deep dive and analyze the prospective data, making it simpler to spot trends and opportunities without getting overwhelmed with all the data gathered from the responses.
Cross-tabulation and chi-square
Chi-square or Pearson's chi-square test is any statistical hypothesis which researchers use to determine whether there is a significant difference between expected frequencies and the observed frequencies in one or more categories.
An important consideration when cross-tabulating your study's findings are verifying whether the cross-tab representation is true or false. This is similar to the doubt we have after joining a university, questioning if this was indeed a good fit or not. To resolve the dilemma, crosstab is computed along with the Chi-square analysis, which helps identify if the variables of the study are independent or related to each other. If the two elements are independent, the tabulation is termed insignificant, and the study would be termed as a null hypothesis. Since the factors are not related to each other, the outcome of the study is unreliable. On the contrary, if there is a relation between the two elements, that would confirm that the tabulation results are significant and can be relied on to make strategic decisions.
An important consideration when cross-tabulating your study's findings are verifying whether the cross-tab representation is true or false. This is similar to the doubt we have after joining a university, questioning if this was indeed a good fit or not. To resolve the dilemma, crosstab is computed along with the Chi-square analysis, which helps identify if the variables of the study are independent or related to each other. If the two elements are independent, the tabulation is termed insignificant, and the study would be termed as a null hypothesis. Since the factors are not related to each other, the outcome of the study is unreliable. On the contrary, if there is a relation between the two elements, that would confirm that the tabulation results are significant and can be relied on to make strategic decisions.
Another important term that we will introduce here is the Null hypothesis. The null hypothesis assumes any difference or importance one can see in a data set is by chance. The opposite of the null hypothesis is called the alternative hypothesis.
Applying the chi-square to surveys is usually done with these question types:
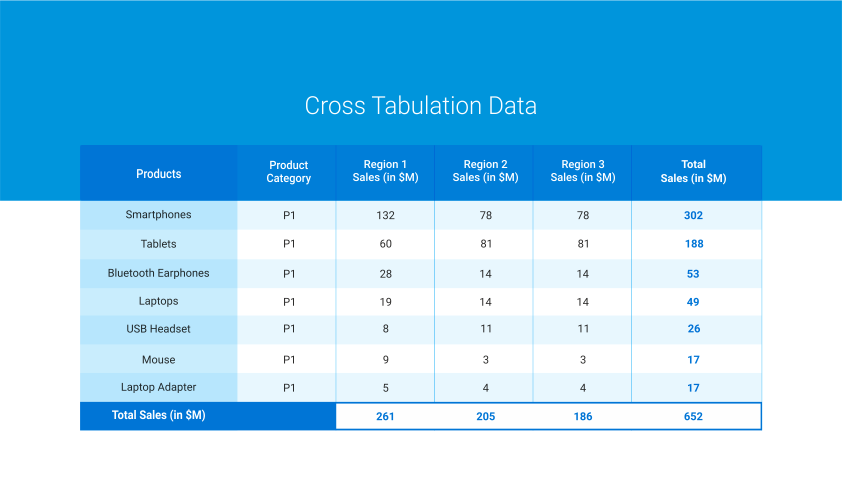
For example, we need to find out if there is an association between the buyer behavior of purchasing electronic devices and the region where it is sold. The data will be entered like the one in the table below:
As mentioned earlier, the chi-square test helps you determine if two discrete variables are associated. If there is an association, one variable's distribution will differ depending on the second variable's value. But if the two variables are independent, the first variable's distribution will be similar for all values of the second variable.
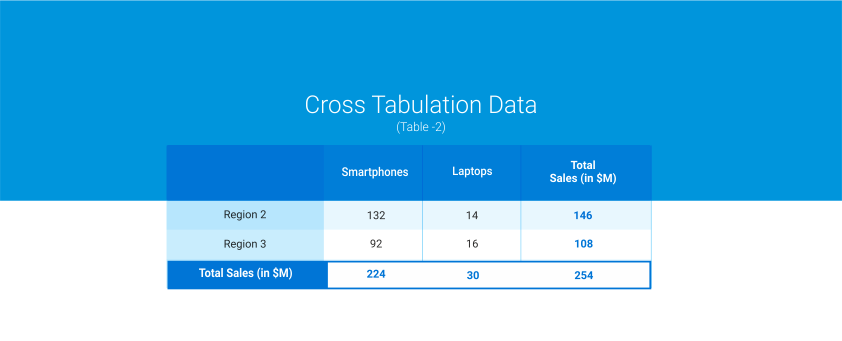
Using cross-tabulation and chi-square, we derive the following inference:
Applying the chi-square calculation to the above values - Pearson's chi square= 0.803, P- Value= 0.05. So what does this mean? We need to pay attention to the p-value. Compare the p-value to your alpha-level which is commonly 0.05.
If the p-value is less than or equal to the alpha-value, then the two variables are associated.
If the p-value is greater than the alpha value, you conclude the variables are independent.
In this example, Pearson chi-square statistics is 0.803 (with a p-value 0.05). So with an alpha value of 0.05, we conclude that there is no correlation and is insignificant.
Cross-tabulation and chi-square
One significant advantage of using cross-tabulation in a survey is, its simple to compute and extremely easy to understand. Even if the researcher does not have an in-depth knowledge of the concept, it is effortless to interpret the results.
It eliminates confusion as raw data can sometimes be challenging to understand and interpret. Even if there are small data sets, you might get confused if the data is not arranged in an orderly manner. Cross-tabulation offers a simple way of correlating the variables that help minimize confusion related to data representation.
One can derive numerous insights from cross-tabulation. As mentioned in the cross-tabulation examples in the section above, it is not easy to interpret raw data. Cross-tab maps out the correlation between variables, insights that otherwise may have been overlooked are clearly understood. It is straightforward to understand the insights from even a complicated form of statistics.
It provides qualified or relative data on two or more variables across multiple features with ease.
The most important advantage of using cross-tabulation for survey analysis is the ease of using any data, whether it is nominal, ordinal, interval, or ratio.
Cross-tabulation using QuestionPro
1. Login to your QuestionPro account and choose the survey you want to analyze.
2. Under Analytics, you will find the option for “Analysis”. Click on Cross- Tabulation under Analysis.
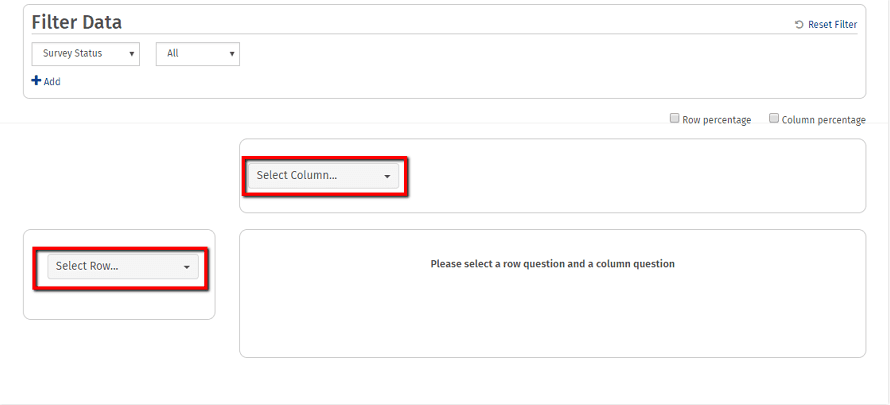
3. Select you row question and the column question from the dropdown respectively.
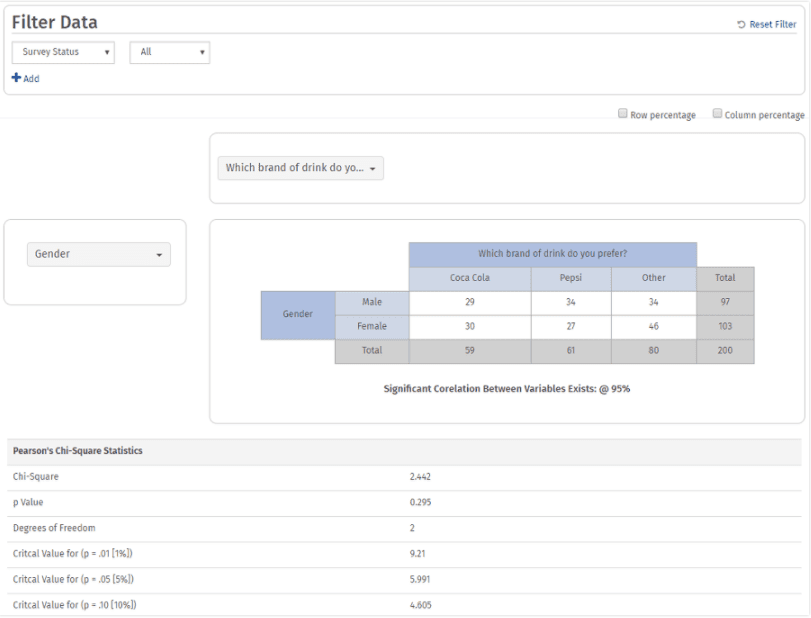
4. A cross-tab table will be generated along with Pearson’s Chi-square analysis.
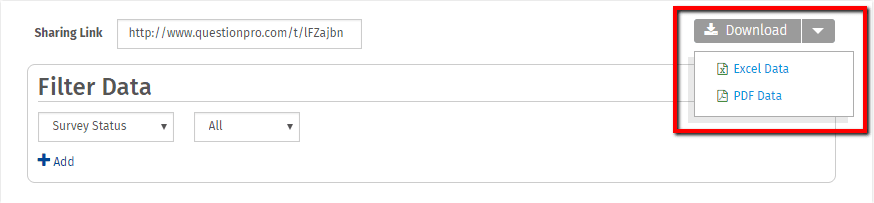
5. Once you have generated the report, you can also download the report.
 Survey Software
Easy to use and accessible for everyone. Design, send and analyze online surveys.
Survey Software
Easy to use and accessible for everyone. Design, send and analyze online surveys.
 Research Suite
A suite of enterprise-grade research tools for market research professionals.
Research Suite
A suite of enterprise-grade research tools for market research professionals.
 CX
Experiences change the world. Deliver the best with our CX management software.
CX
Experiences change the world. Deliver the best with our CX management software.
 Workforce
Create the best employee experience and act on real-time data from end to end.
Workforce
Create the best employee experience and act on real-time data from end to end.