Pivot tables or tabs are useful in analyzing quantitative data, especially for analyzing responses between different groups. A pivot table helps you perform multivariate analysis by creating secondary pivots or nested pivots. It helps you understand and compare how different respondents reacted to the survey.
Example of a pivot table
For example, one of your questions may be, “Where are you from?” Possible answers might include:
North-West
West Coast
Mountain States
Mid-West
South
East Coast
North-East
Research pivot tables allow researchers to visualize how respondents from each answer option responded to all the questions without creating groups and segments for each option. The question that you use to segment the rest of the survey is referred to as the pivot question.

Researchers use pivot tables for the following:
To study relationships between survey data that may otherwise not be visible.
To break down research data (mostly by demographics) to get a better understanding of people’s choices based on a single question.
It helps explore trends in various settings.
When there’s a need to slice the data to have a deeper understanding of the subject.
Advantages of pivot tables
Pivot tables are advantageous as they expand a researcher’s research capabilities by helping them gain more precise insights from their research data. Here are some more advantages of using pivot tables:
Lesser errors: A large amount of quantitative data can be broken down into bits and pieces to reduce errors in making inferences.
Uncomplicate information: Generally, research data is vast. Pivot tables help you consolidate data to uncomplicate information.
Reveal insights that matter: You can focus on specific demographics to gather insights that matter te most to your research.
Actionable business data: Businesses need quality research data to make decisions. Pivot tables help businesses analyze actionable data to make these decisions.
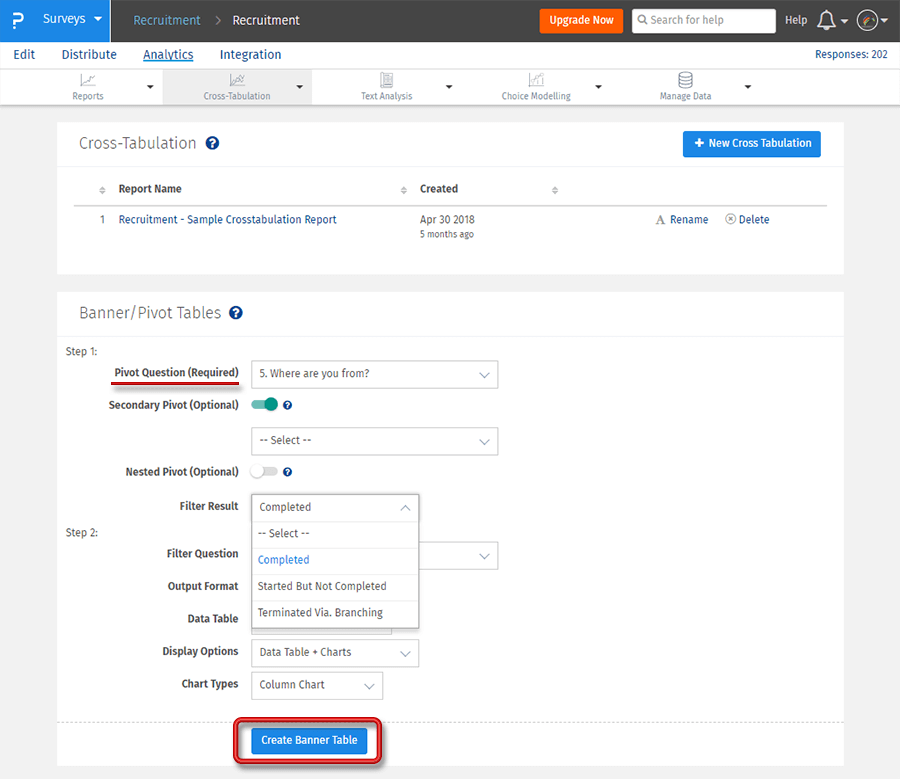
How to use pivot tables?
Learn how to set up and use this feature with our help file on Pivot tables.
 Survey Software
Easy to use and accessible for everyone. Design, send and analyze online surveys.
Survey Software
Easy to use and accessible for everyone. Design, send and analyze online surveys.
 Research Suite
A suite of enterprise-grade research tools for market research professionals.
Research Suite
A suite of enterprise-grade research tools for market research professionals.
 CX
Experiences change the world. Deliver the best with our CX management software.
CX
Experiences change the world. Deliver the best with our CX management software.
 Workforce
Create the best employee experience and act on real-time data from end to end.
Workforce
Create the best employee experience and act on real-time data from end to end.