Customizing reports and charts
When you create a Customized Report/Chart after adding all the questions to your survey, a slide for each of the questions in your survey will be created. You can edit each of these slides and customize the slides to fit your presentation needs.
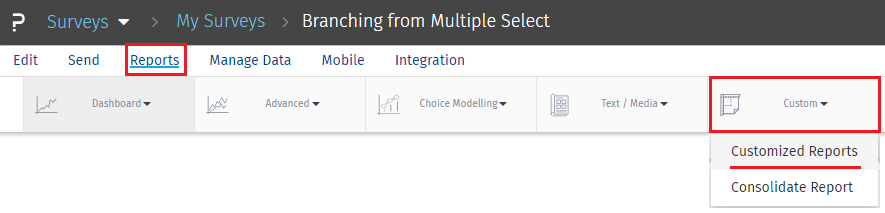
The Customized Reports/Charts tool can be accessed by clicking on
- Login » Surveys (Select Survey) » Reports » Custom » Customized Reports
- Select Search Data from the left navigation.
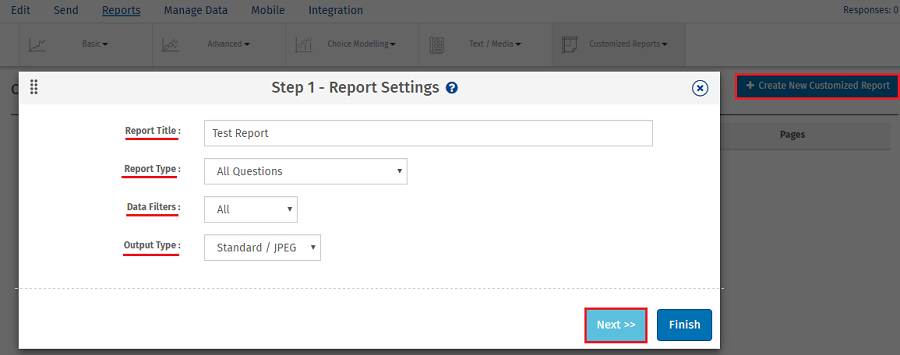
- Click Create New Customized Report found at the top of the screen.
- Enter the Report Title. Select the Report Type from the drop-down available.
- Select the Output Type.
- Click Next.
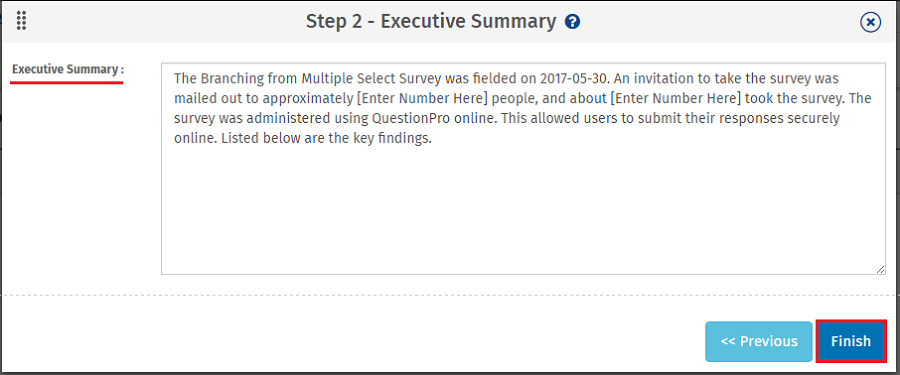
- Enter the Executive Summary to be included with the report.
- Click Finish.
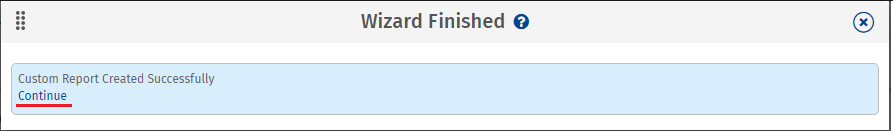
- A report will be generated, and you will be asked to Continue when the report is ready.
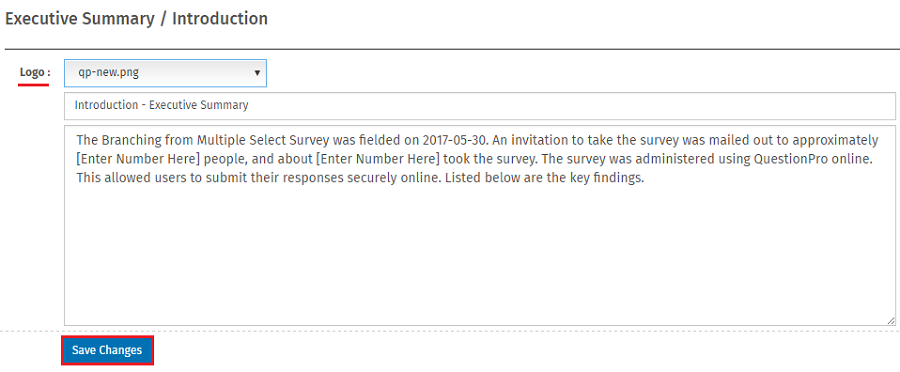
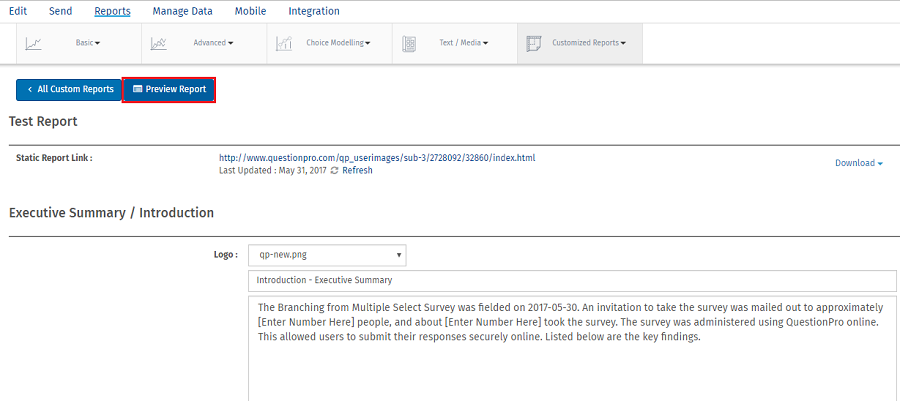
- After clicking Continue, you will be taken to a page with the Static Report Link which can be shared with anyone. You can also click Download to download a copy of the report to your hard drive. You can also select a Logo from the drop-down, modify the Executive Summary/Introduction title and text. If changes are made, click Save Changes to refresh the report.
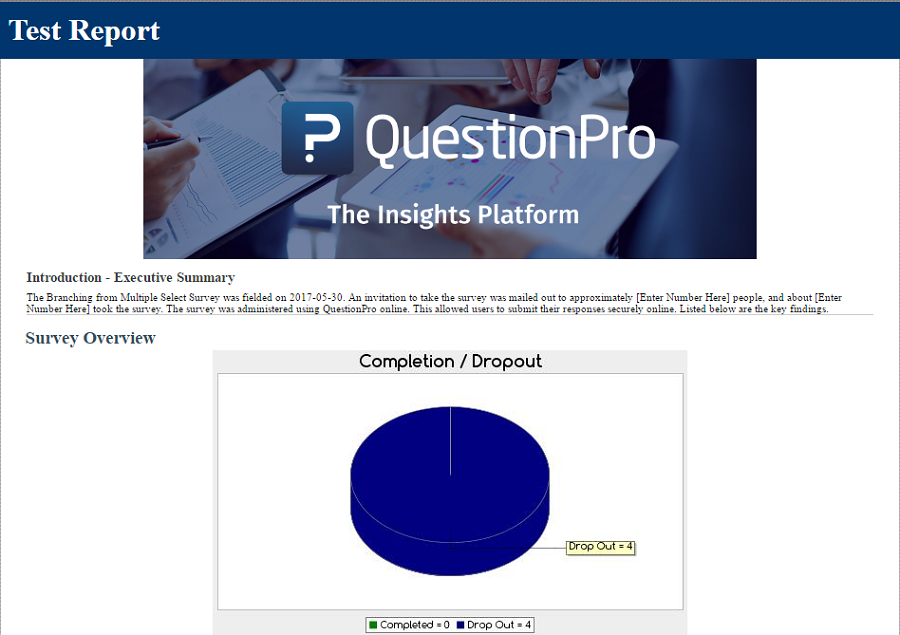
- You can preview report by clicking on
Preview Report.
 Survey Software
Easy to use and accessible for everyone. Design, send and analyze online surveys.
Survey Software
Easy to use and accessible for everyone. Design, send and analyze online surveys.
 Research Suite
A suite of enterprise-grade research tools for market research professionals.
Research Suite
A suite of enterprise-grade research tools for market research professionals.
 CX
Experiences change the world. Deliver the best with our CX management software.
CX
Experiences change the world. Deliver the best with our CX management software.
 Workforce
Create the best employee experience and act on real-time data from end to end.
Workforce
Create the best employee experience and act on real-time data from end to end.