Sample Survey Reports
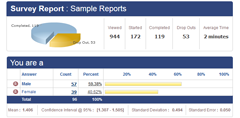
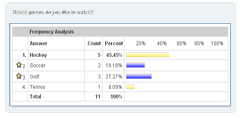
The Real-Time Summary Report is the most basic report of up to the second survey results. The report consists of simple frequency statistics and basic graphs of the data collected thus far.
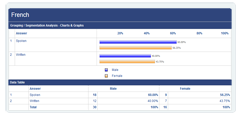
After viewing the entire dataset in the online summary report, the most common requirement is to compare the results of the survey for different groups of survey respondents. For instance, how did males answer vs. females on a given question?. First you create filters that allow you to define these groups then you click, 'Run Comparison Report'. The report will show overall results as well as results for each group that you've defined.
Every research project typically involves the collection of survey response data in multiple choice formats as well as verbatim responses. The open ended text report allows you to view the open ended responses as well as comments.
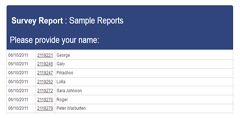
Individual Response Viewer
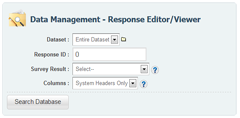
In many cases, the analysis of data requires you to drill down all the way to one particular survey response. From any point in the online analysis, you have the option to query the responses and bring up a list of survey responses that you may view 1 by 1. The data includes the IP Address, Date/Time, and any custom variables you may have collected for the respondent.
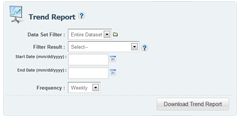
Studies that last over a period of time are often analyzed to determine how survey results vary over that time period. The Trend Analysis report give you the ability to chart survey response data over time. The result can be charted weekly, monthly, or quarterly.
The MS Excel Export produces a multi-tab .xls file that includes the raw data dump as it exists in our database. The report also includes all of the frequency data from the online summary report, as well as the frequency data for any groups that have been defined in the comparison report.
For those who may be interested in creating an MS Powerpoint presentation, we've automated the export of the graphical images.
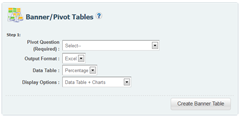
Banner tables allow you to visualize and view your data relative to a single question (pivot question). Banner tables allow you to visualize how respondents from each of these criteria's responded to all the questions without having to create filters and groups for each option.
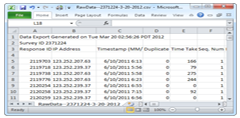
CSV Raw Data Export(.csv)
Data collected can be easily downloaded in .csv Raw Data Format. The .csv export can be used for integration with various offline analysis programs.
Data collected can be Exported to SPSS .SAV format. Download the data in SPSS .sav format for intensive offline analysis.
The Spotlight Report allows your respondents to visually see how their responses compared to the overall survey responses.
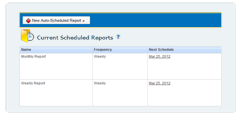
The report scheduler allows you to automatically send any of the reports to other users within your organization. Typically the report scheduler is used to trigger reports for long running transactional surveys where survey results are monitored over time.
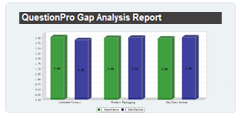
Gap Analysis is typically used to analyze the interaction of two scale type questions. The classic example is to present a respondent with a series of measurement items and two scales that rate the Satisfaction and the Importance of each item. Each rating scale starts at 1 for Not Satisfied/Not Important and goes to 5 for Very Satisfied/Very Important. Although the answers to each scale is important, the interaction between two scales is the critical information. This interaction answers "Which attributes are the most important AND how satisfied are my respondents with that attribute?". The answer to this question allows the prioritization of attributes by determining the Gap in two scales. QuestionPro automatically performs this analysis on a side by side matrix type question.
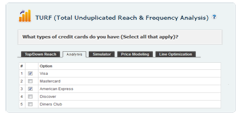
TURF (Total Unduplicated Reach and Frequency) Analysis, is a type of statistical analysis used for providing estimates of media or market potential and devising optimal ways how to use it given the limited resources. For example, say you want to market 10 new flavors of yogurt. There may be ten possible flavors for a new yogurt, but in actuality the market will only purchase three. The TURF algorithm identifies the optimal product line to maximize the total number of consumers who will purchase at least one SKU (Stock Keeping Unit) and, at the same time, minimize consumer overlap across all the flavors. This in turn can help companies determine which products / services to offer, and just as importantly, what products not to make.
 Survey Software
Easy to use and accessible for everyone. Design, send and analyze online surveys.
Survey Software
Easy to use and accessible for everyone. Design, send and analyze online surveys.
 Research Suite
A suite of enterprise-grade research tools for market research professionals.
Research Suite
A suite of enterprise-grade research tools for market research professionals.
 Customer Experience
Experiences change the world. Deliver the best with our CX management software.
Customer Experience
Experiences change the world. Deliver the best with our CX management software.
 Employee Experience
Create the best employee experience and act on real-time data from end to end.
Employee Experience
Create the best employee experience and act on real-time data from end to end.