Conjoint analysis is an advanced market research analysis method that attempts to understand how people make complex choices. Everyday, people make choices that require trade-offs—so often that we may not even realize it. Simple decisions such as, "what type of laundry detergent should I buy?" or "which flight should I book for my upcoming trip?," all contain multiple elements that ultimately formulate a decision. Subconsciously, some of us may be more price-sensitive while others are more feature-focused. This is the core of conjoint—understanding which elements consumers consider to be important or trivial.
Ever bought a house? As one of the more complex purchase decisions, homebuyers must consider their preference of location, price, interest rates, proximity to work, modern conveniences, entertainment, quality of schools, and among others. Conjoint analysis is one of the most effective models in extracting consumer preferences during the purchasing process into a quantitative measurement. It evaluates products or services in a way no other method can.
Traditional rating surveys and analysis do not have the ability to place a value on the different attributes that make up a product. Conjoint analysis extrapolates the respondent’s preference to a quantitative measurement. Many shy away from conjoint analysis because of its seemingly complex design and methodology. But the truth is, you can start revealing valuable information about your business now! Here is conjoint analysis in a nutshell to get you started.
Check out our CEO's opinion on Conjoint Analysis
Let's assume a scenario, where a product marketer needs to measure the impact of individual features on the
estimated market share or sales revenue.
Consider an organization producing tablets, perhaps a competitor to the Apple iPad and
Samsung Galaxy. The organization needs to understand how different customers value
Attributes such as Size, Brand, Price, and Battery Length. Armed with this information they
can create their product range and offering.
Conjoint Analysis seeks to assign values to these product Attributes and Levels by creating
realistic choices and asking people to evaluate them. Math is then used to calculate what
the underlying values are.
Conjoint Analysis enables businesses to mathematically analyse consumer or client behavior and make decisions
based on real insights from data! This allows them to better cater to consumer needs and develop business
strategies that provide a competitive edge. This is because fulfilment of customer wishes in a profitable
way requires companies to fully understand which aspects of their product and service are most valued by the
customer.
Conjoint analysis is considered to be the best survey method for achieving this purpose. It consists of
creating, distributing and analyzing surveys among customers with the purpose of modelling their purchasing
decision based on response analysis.
QuestionPro can automatically compute and analyze mathematical values to explain consumer behavior - how
much value is placed on price, features, geographic location etc, and then correlate this data to consumer
profiles. A software-driven regression analysis of data obtained from real customers makes for an accurate
analysis, instead of hypothesis.
In the case of Choice-Based Conjoint Analysis (currently the most popular form
of Conjoint
Analysis) participants are shown a series of options and asked to select
the one they would be most likely to buy.
Choice-Based Conjoint asks people to pick the option they would be most likely to buy, other
forms of Conjoint Analysis ask people to rank or rate options. Choices are widely considered to
be more realistic than asking people to rank options or to rate them.
Check out
our Conjoint Analysis Survey Template
Each participant is shown several of these choices and the answers they give allow us to work out
the underlying values. For example, we can work out what their preferred size is, and how much
they would pay for their preferred brand. Once we have the values for each of the Attributes
(e.g. brand, size, battery length etc) and for each of the Levels of each Attribute (e.g. Apple
iPad, Google Galaxy, Sony Xperia & Nexus) there is a range of analytic options. The key tools
for analysis include: What-if modelling, forecasting, segmentation, and applying cost-benefit
analyses.
Over the past 50 years, Conjoint analysis has evolved into a method that market researchers and statisticians implement to predict the kinds of decisions consumers will make about products by using questions in a survey.
The central idea is that for any purchase decision, consumers evaluate or “trade off” the different characteristics of a product and decide which are more important to them. The primary aim of any online survey based on conjoint analysis is to set distinct values to the scope of alternatives that the buyers may consider when making a purchase decision. Well-equipped with this knowledge, marketers can target on the features of products or services that are highly important and design messages most likely to strike a chord with target buyers.
Discrete choice conjoint analysis presents a set of possible concepts to consumers via a survey and asks them to make a decision on which one they would pick. Each concept is composed of a set of attributes (e.g. color, size, price) which are detailed by a set of levels.
In a nutshell, Conjoint models predict respondent preference. For instance, we could have a conjoint study on laptops. The laptop can come in 3 colors (white, silver, and gold), 3 screen sizes (11”, 13”, and 15”), and 3 prices ($200, $400, and $600). This would give 3 x 3 x 3 possible product combinations. In this example, there are 3 attributes (color, size, and price) which 3 levels per attribute listed in the parenthesis.
A set of concepts, or tasks, based on the defined attributes are presented to respondents who make choices as to which product they would purchase in real life. It is important to note that there are a lot of variations of conjoint techniques. QuestionPro uses choice-based conjoint analysis, which best simulates the purchase process of consumers.
Attributes (Features) : The constituent features of the concept. Example of attributes for Laptops: Brand, Size, Color, Battery Life.
Levels : The specifications of each attribute. Example of levels for Laptops Brands: Samsung, Dell, Apple, Asus.
Task : The number of times the respondent must make a choice. The example shows the first of the 5 tasks as indicated by “Step 1 of 5.”
Concept or Profile: The hypothetical product or offering. This is a set of attributes with different levels that are displayed at each task count. There are usually at least two to choose from.
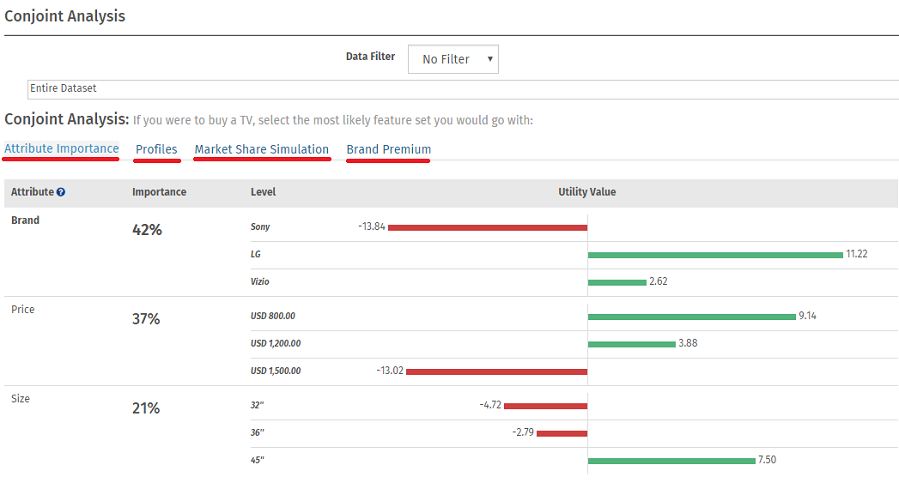
Relative Importance: Also understood by the term “attribute importance”, this depicts what are the various attributes of a product/service are more or less important when making a purchasing decision. Example of Laptop Relative Importance: Brand 35%, Price 30% , Size 15%, Battery Life 15%, Color 5%.
Parts Worths/Utility Values: Part-Worths means level utilities for conjoint attributes. When multiple attributes come together to describe the total worth of the product concept, the utility values for the separate parts of the product (assigned to the multiple attributes) are part-worths. Example parts worth for Laptops Brands: Samsung - 0.11, Dell 0.10 , Apple 0.17, Asus -0.16
Profiles: Discover the ultimate product with the highest utility value. At a glance, QuestionPro lets you compare all the possible combinations of product profiles ranked by utility value to build the product or service that the market is looking for.
Market Share Simulation: One of the most unique and fascinating aspects about conjoint analysis is the conjoint simulator. This gives you the ability to “predict” the consumers choice for new products and concepts that may not yet exist. Measure the gain or loss in market share based on changes to existing products in the given market.
Brand Premium: How much more will a customer pay for a Samsung versus an LG television? Assigning price as an attribute and tying that to an attribute returns a model for a $ per utility distribution. This is leveraged to compute the actual dollar amount relative to any attribute. When the analysis is done relative to brand, you get to put a price on your brand.
Price Elasticity and Demand Curve: Price elasticity relates to the aggregate demand for a product and the shape of the demand curve. We calculate it by plotting the demand (frequency count/total response) at different levels of price.
There are two main types of conjoint analysis : Choice-based Conjoint (CBC) Analysis and Adaptive Conjoint Analysis (ACA).
Choice-based Conjoint (CBC) Analysis: This type of conjoint analysis is the most popular, because it asks consumers to imitate the purchasing behavior in the real market: which products they would choose, given certain criteria on price and features.
Adaptive Conjoint Analysis (ACA):This type of conjoint analysis is used more often in scenarios where the number of attributes/features exceeds what can be done in a choice based scenario. ACA is great for product design and segmentation research, but not for price.
QuestionPro uses CBC, or Discrete Choice Conjoint Analysis, which is a great option if price is one of the most important factors to you or your customers. The key benefit of the method is that it provides a picture of the market’s willingness to make tradeoffs between various features.
The result is an answer to what constitutes an “ideal” product or service.
Level Up Conjoint Analysis Insights
Conjoint Deliver Realistic and Actionable Insights
Although Conjoint analysis requires more involvement in survey design and analysis, the benefits of realistic and actionable insights than a standard survey alone is worth the additional planning effort. Price is important to most folks shopping for a laptop. But how much more is the majority willing to pay for longer battery life for their laptop if it means a heavier and bulkier design? How much less in value is a smaller screen size compared to a slightly larger one? Find this out now before making a huge investment.
The other thing to note is that conjoint is just a piece of the insights pie. Capture the full story with a cohesive pricing, consumer preference, branding, or go-to-market strategy using other question types and delivery methodologies to stretch the project to its full potential. With QuestionPro, you are able to build and deliver comprehensive surveys that combines conjoint analysis results with insights from additional questions or custom profiling information included in the survey.
Often times we are asked, “When is a good time to run a discrete choice conjoint analysis study?” So much so that we’ve coined the term Conjoint O’ Clock. If you find yourself needing to get into the mind of your customers to understand why they buy, then ask yourself what are my insight goals? It’s time for Conjoint O’ Clock if you are trying to:
- Launch a new product or service into the market
- Repackage existing products or services to the market
- Understand your customers and what they value in your products
- Gain actionable insight to increase your brand’s competitive edge
- Place a price on your and competing brands
- Revamp your pricing structure
To calculate the utility values or parts worth, we use a logit model coupled with a Nelder-Mead Simplex algorithm. The benefit of this algorithm allows QuestionPro to offer a cohesive and comprehensive survey experience all within one platform. Have confidence in your results by reviewing the algorithm below.
Notation:
- Let there be R respondents, with individuals r = 1 ... R
- Let each respondent see T tasks, with t = 1 ... T
- Let each task t have C concepts, with c = 1 ... C
- If we have A attributes, a = 1 to A, with each attribute having La levels, l = 1 to La, then the part-worth for a particular attribute/level is w’(a,l). In this exercise, we will be solving this (jagged array) of part worths.
- We can simplify this to a one-dimensional array w(s), where the elements are {w′(1, 1), w′(1, 2)...w′(1, L1), w′(2, 1)...w′(A, LA)} with w having S elements.
- A specific concept x can be shown as a one-dimensional array x(s), where x(s)=1 if the specific attribute is available, and 0 otherwise.
- Let Xrtc represent the specific concept of the cth concept in the tth task for the r th respondent. Thus, the experiment design is represented by the four dimensional matrix X with size RxTxCxS.
- If respondent r chooses concept c in task t then let Yrtc=1; otherwise 0.
- The value Ux of a definite idea is the total of the part-worths for those elements available in the conception, i.e. the scalar product of x and w.
The Multi-Nominal Logit Model
For a simple choice between two concepts, with utilities U1 and U2, the multi-nominal logit (MNL) model predicts that concept 1 will be chosen
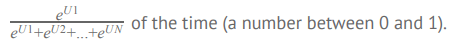
Modeled Choice Probability
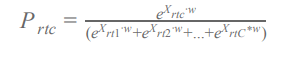
Let the choice probability (using MNL model) of choosing the cth concept in the tth task for the r th respondent be:
Log-Likelihood Measure
The Log-Likelihood (LL) measure is calculated as:

Solving for Part-Worths Using Maximum Likelihood
We solve for the part-worth vector by finding the vector w that gives the maximum value for LL.
Note that we are solving for S variables.
- This is a multi-dimensional, nonlinear continuous maximization issue, and it is essential to have a standard solver library. We use the Nelder-Mead Simplex Algorithm.
- The Log-Likelihood function should be implemented as a function LL(w, Y, X), and then optimized to find the vector w that gives us a maximum. The responses Y, and the design
X are specified, and constant for a specific development. The starting values for w can be set to the origin 0. The final part-worths values, w, are re-scaled so that the part-worths for any attribute have a mean of zero. This is done by subtracting the mean of the part-worths for all levels of each attribute.
The QuestionPro Conjoint Analysis offering includes the following tools:
- Conjoint Task Creation Wizard :
Wizard based interface to create Conjoint Tasks based on simply entering
Features(Attributes) and Levels for each of the features.
- Conjoint Design Parameters :
Tweak your design but choosing the number of tasks, number of profiles per task as well as
"Not-Applicable" option.
- Utility Calculation: Automatically calculates utilities.
- Relative Importance: Automatically calculates relative importance of attributes (based
on utilities)
- Cross/Segmentation and Filtering: Filter the data based on criteria and then run
Relative Importance calculations.
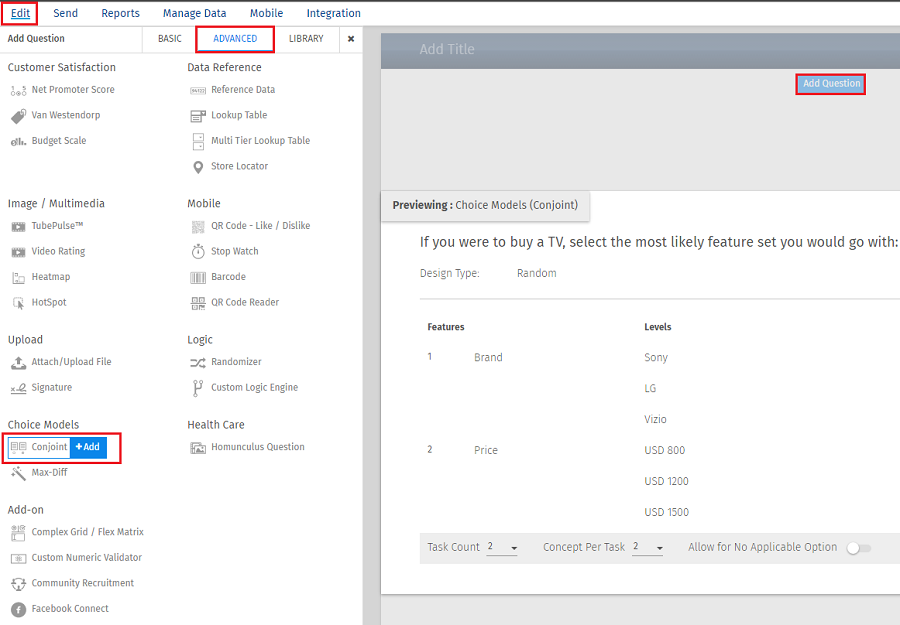
- Step 1 : Under Edit Survey click on the Add New
Question link and select the Conjoint (Discrete Choice) Option from under Advanced
Question
Types.
- Step2 : Enter the features and levels.
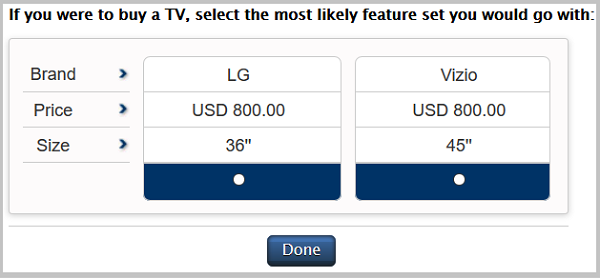
- Step 3 : On the survey the selection options will
display as below:
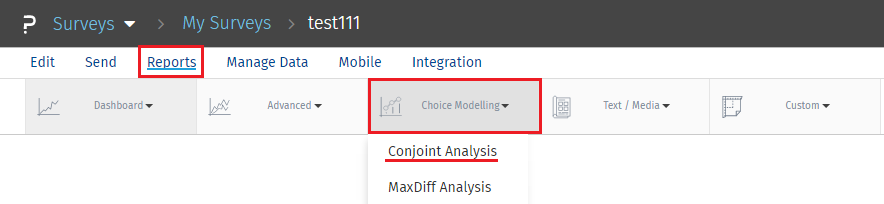
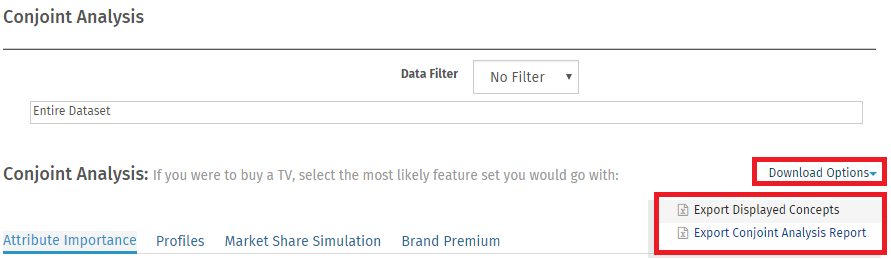
Where can I view Reports for Conjoint Analysis
Questions?
- Step 1 : Go To: Login » Surveys » Reports »
Choice Modelling » Conjoint Analysis
- Step 2 : Here you can view the online conjoint analysis
reports.
- Step 3 : You can download the data in Excel/CSV or HTML
format.
 Survey Software
Easy to use and accessible for everyone. Design, send and analyze online surveys.
Survey Software
Easy to use and accessible for everyone. Design, send and analyze online surveys.
 Research Suite
A suite of enterprise-grade research tools for market research professionals.
Research Suite
A suite of enterprise-grade research tools for market research professionals.
 Customer Experience
Experiences change the world. Deliver the best with our CX management software.
Customer Experience
Experiences change the world. Deliver the best with our CX management software.
 Employee Experience
Create the best employee experience and act on real-time data from end to end.
Employee Experience
Create the best employee experience and act on real-time data from end to end.