- Add widgets
- Survey Comparison
- Heatmap
- Confidentiality Settings
- eNPS in Workforce Analytics Portal
- Notes Widget
- Text Analysis Widget
- Response rate
- Text Report
- Trend analysis widget
- Show/hide Markers and Building blocks
- Question Filter
- Single Question Widget
- Heatmap default
- Sentiment analysis
- Scorecard
- Driver analysis
- Scorecard: All options view
- Heatmap Column Types
- Multiple Tabs in a Dashboard
- 360 feedback introductory text
- 360 feedback display configurations
- 360 feedback display labels
- Multi Level Priority Logic
- 360 Surveys- Priority Model
- 360 feedback - skip logic
- 360 feedback - show hide question logic
- 360 Survey Settings
- 360 feedback configuration
- Customize the validation text
- 360 Survey design
- 360-Reorder section
- 360 Section Type - Single Select Section
- 360 Delete Sections
- 360 Add Sections
- 360 section type - Free responses text section
- 360 Section Type - Presentations text section
- 360 Section-Edit Configurations
- 360 Survey- Languages
- Matrix section

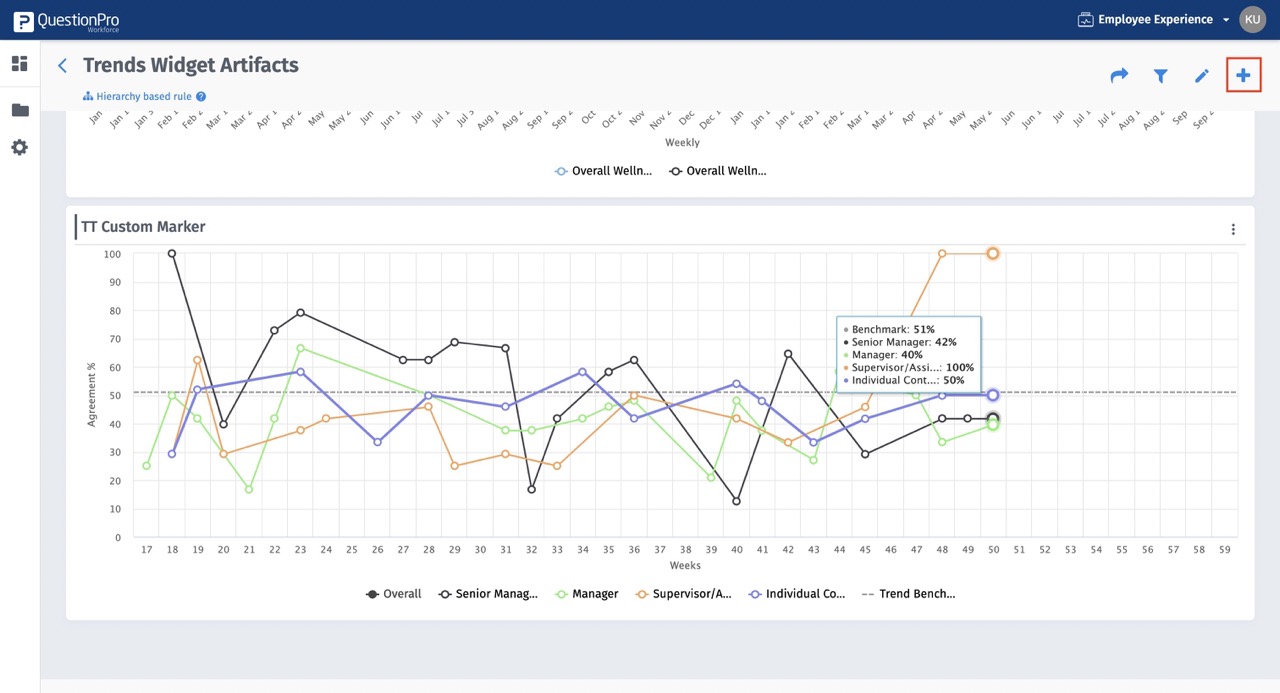
Trend analysis widget
A trend analysis widget for surveys is a visual tool displayed on a dashboard that helps you track how specific survey metrics change over time. It allows you to identify patterns, trends, and potential areas for improvement based on your survey data.
Click to download video
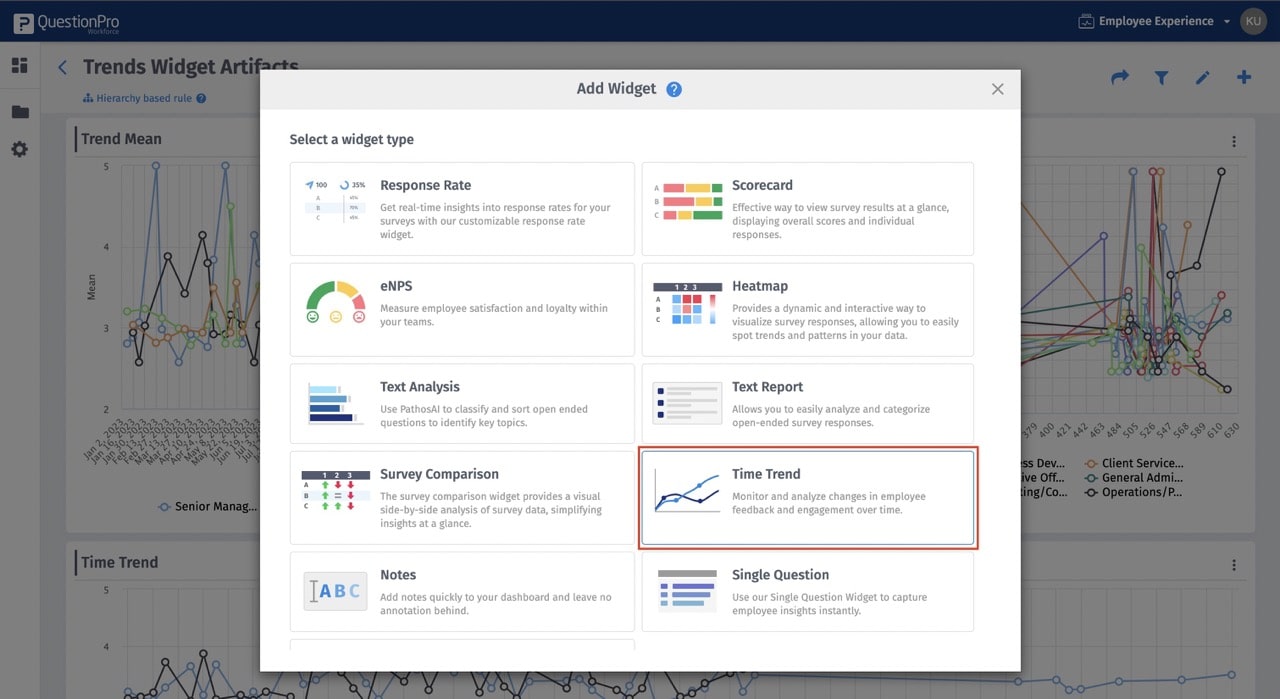
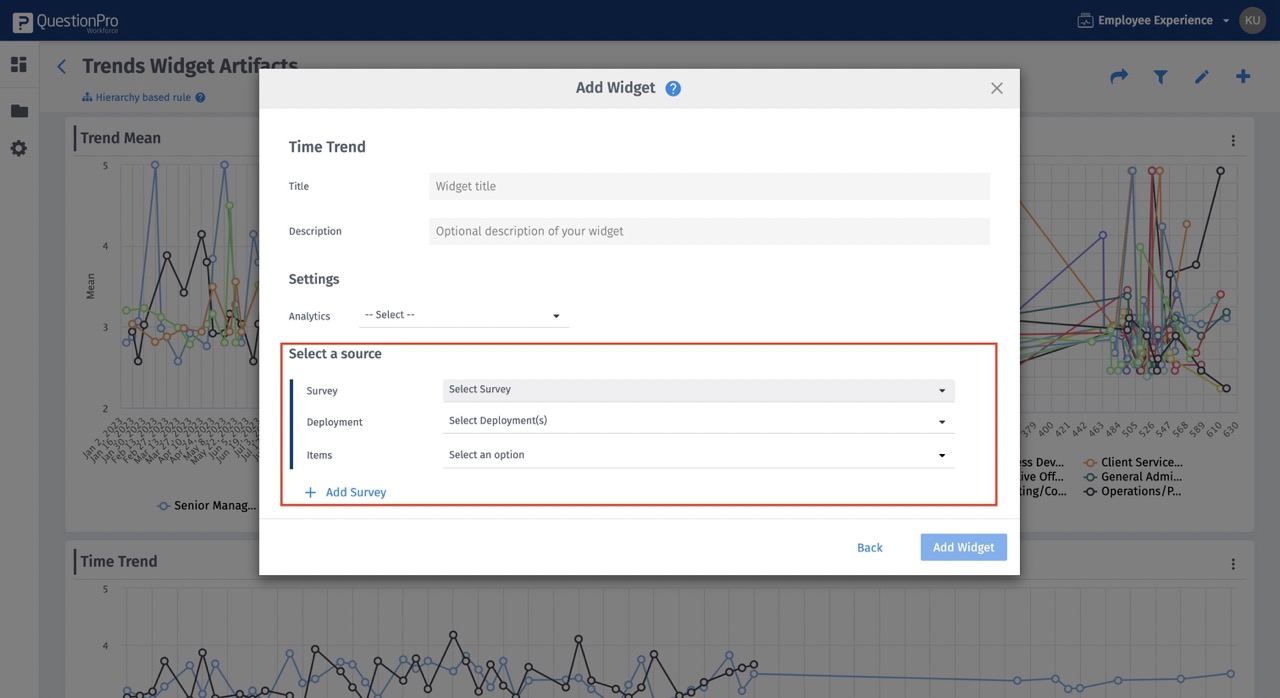
Click on Add widget
Choose “Time trend”
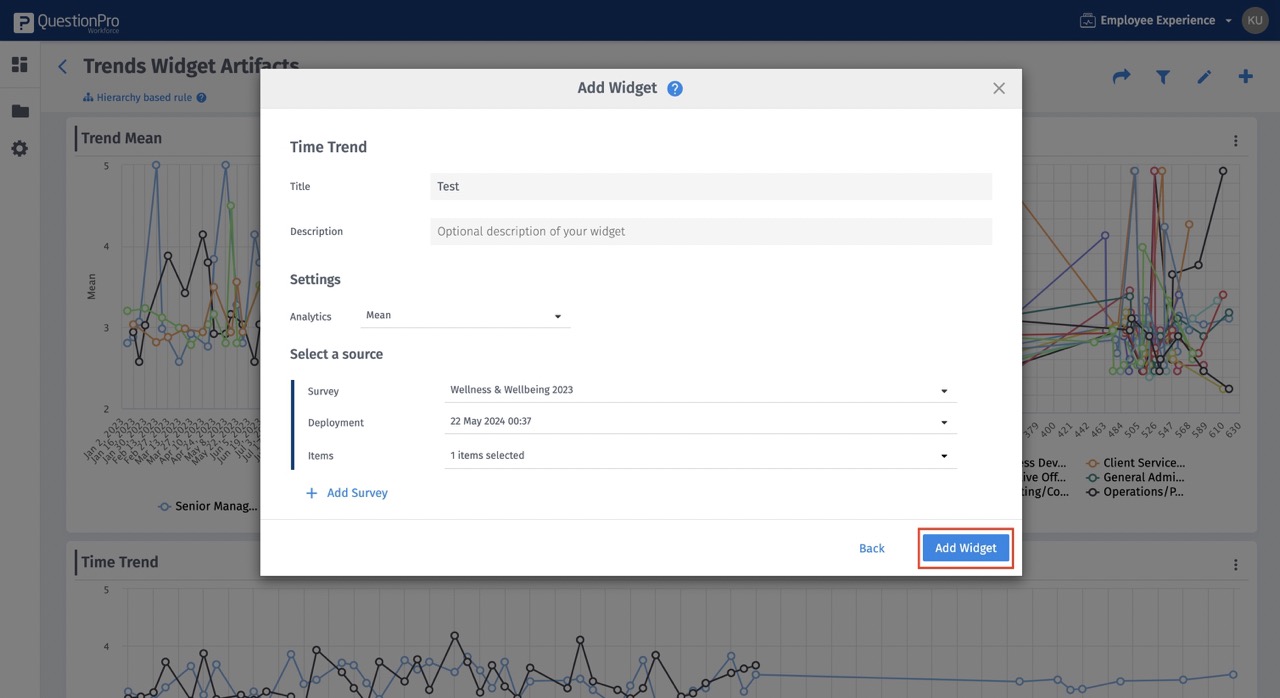
Enter the Widget title, description of the new widget and analytics type
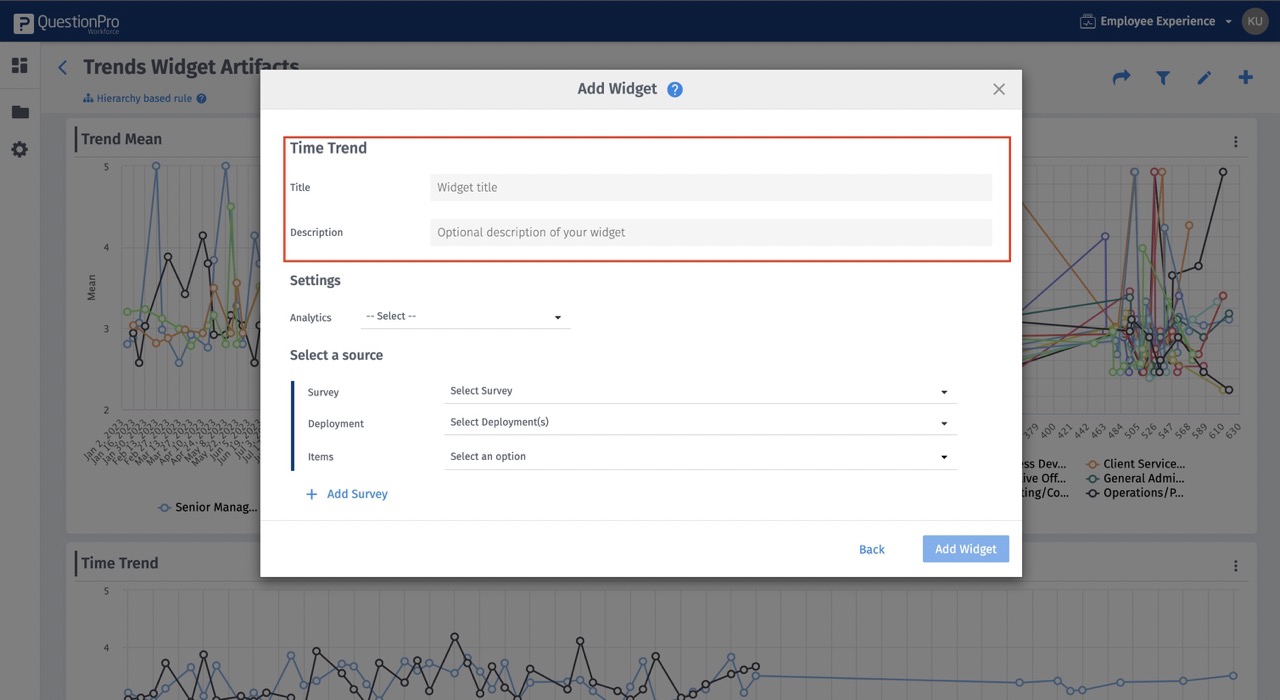
Select survey, deployment, and questions that need to be analysed
Click on “Add widget”
Users can edit the widget by clicking on the edit icon
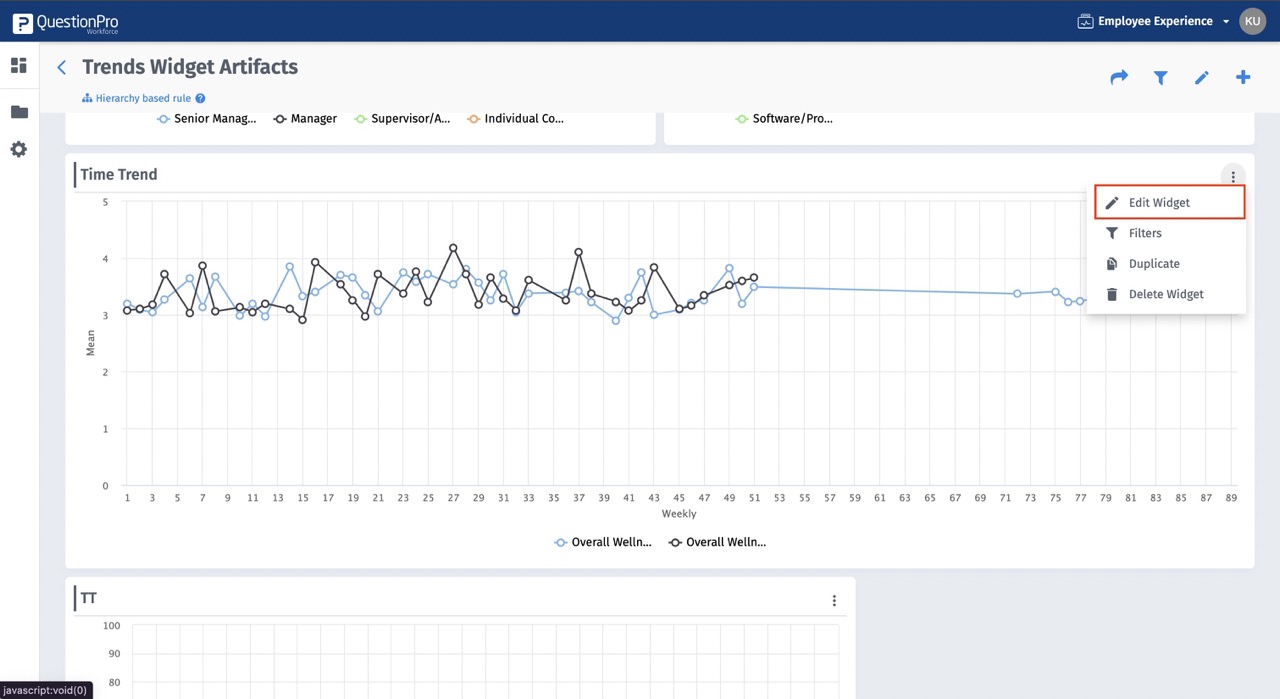
Users can delete the widget or duplicate the widget
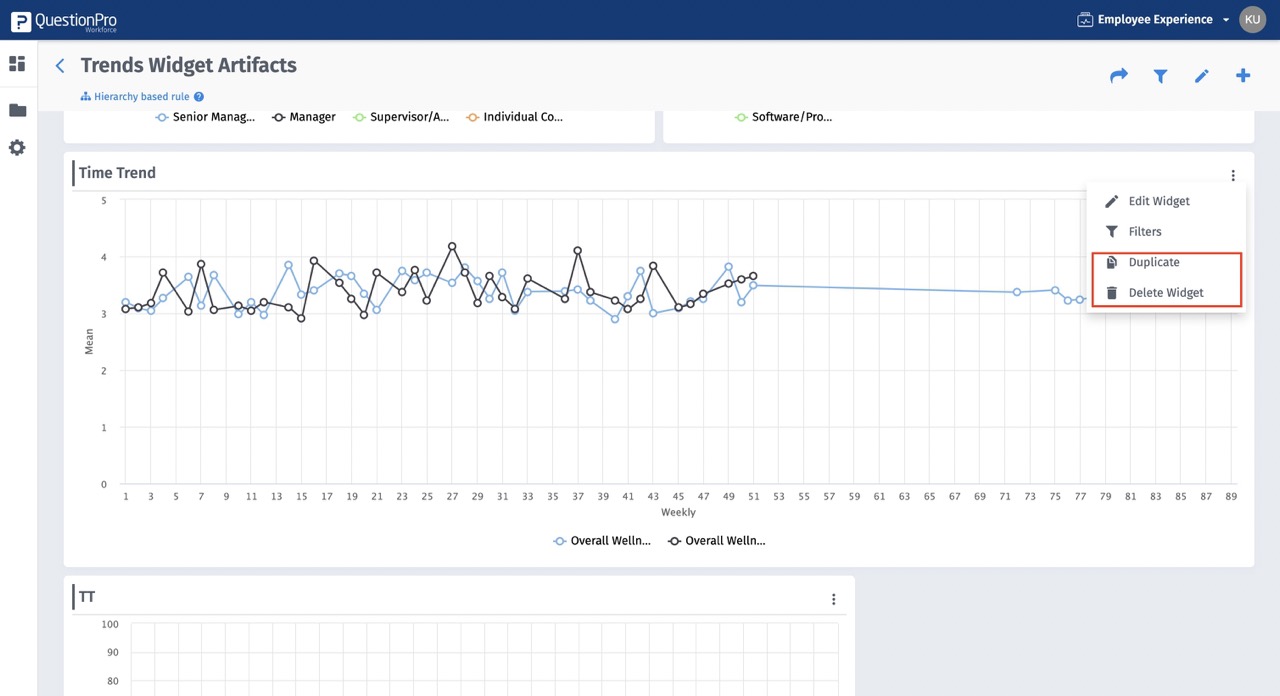
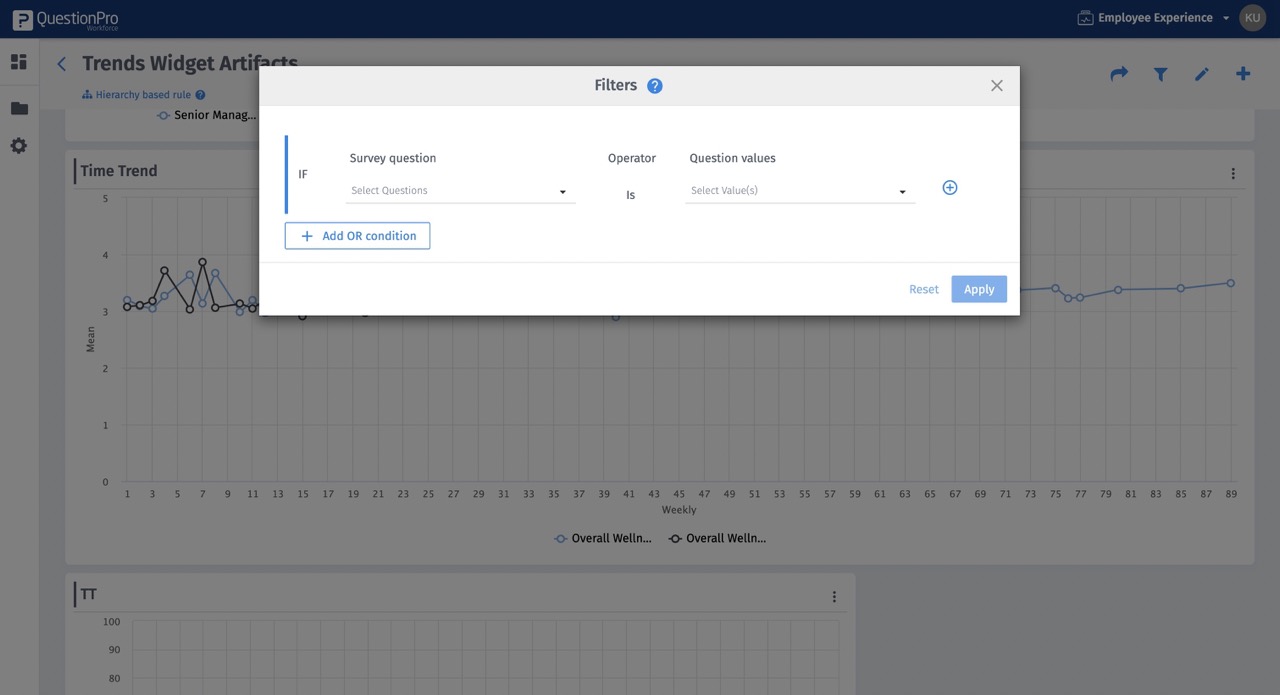
Users can filter the widget data by “And” and “or” conditions
Users can edit the widget by clicking on the edit icon
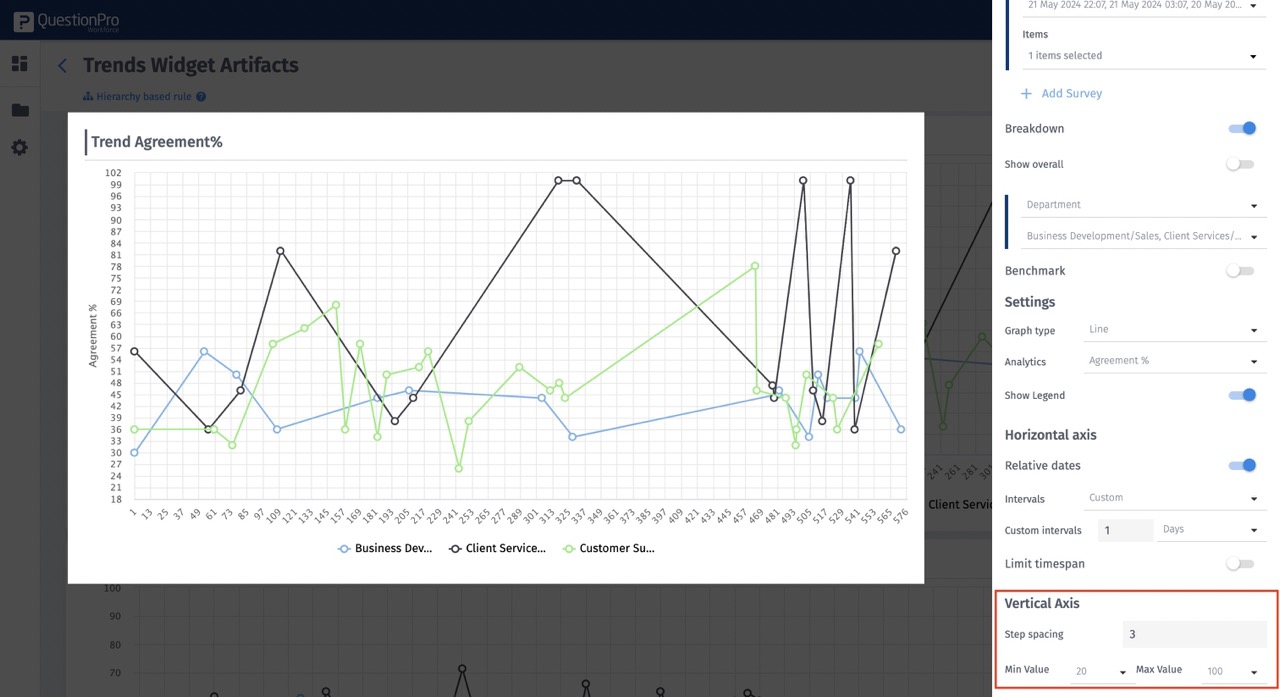
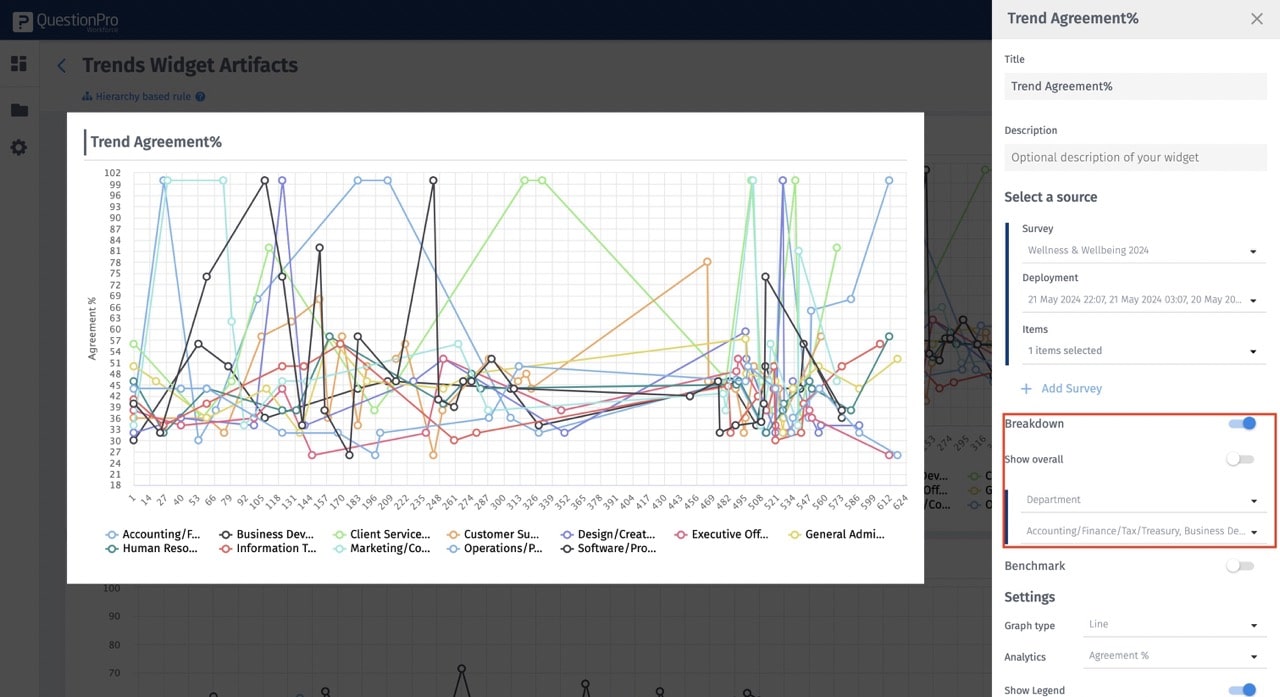
Enable breakdown option to further drill down the data with custom fields and its options along with an overall toggle to compare with the overall trend
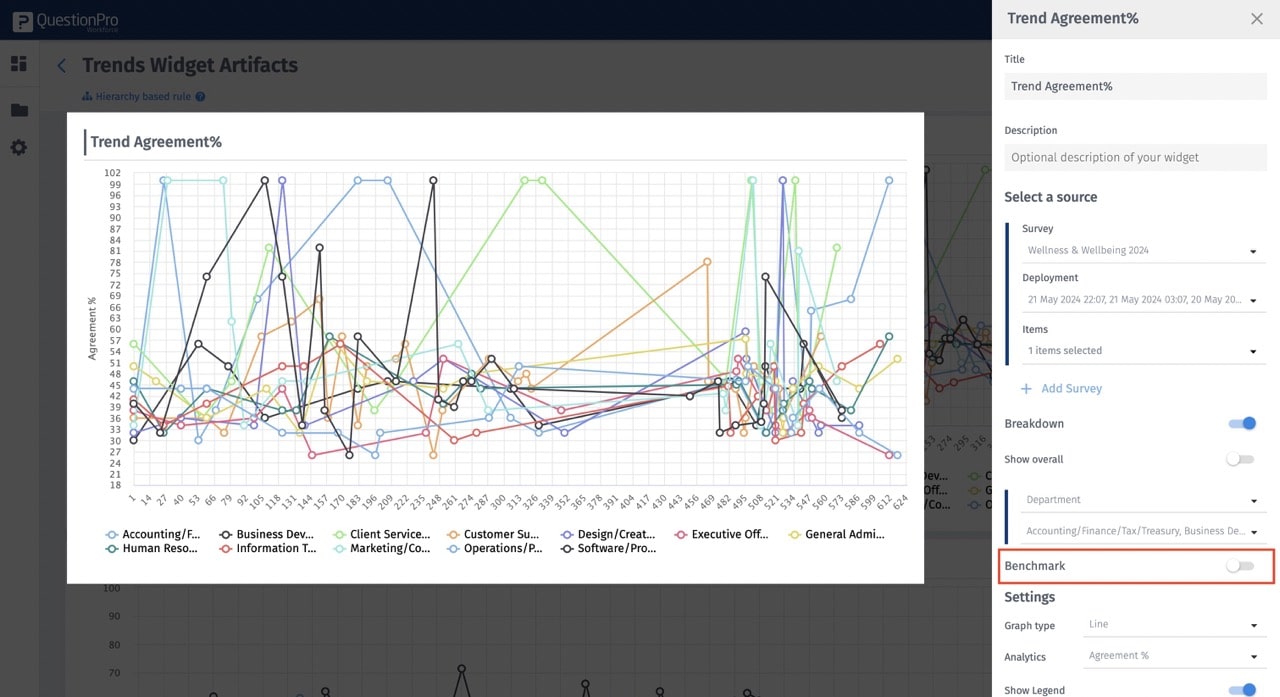
Enable the benchmark option to compare the data with benchmark data
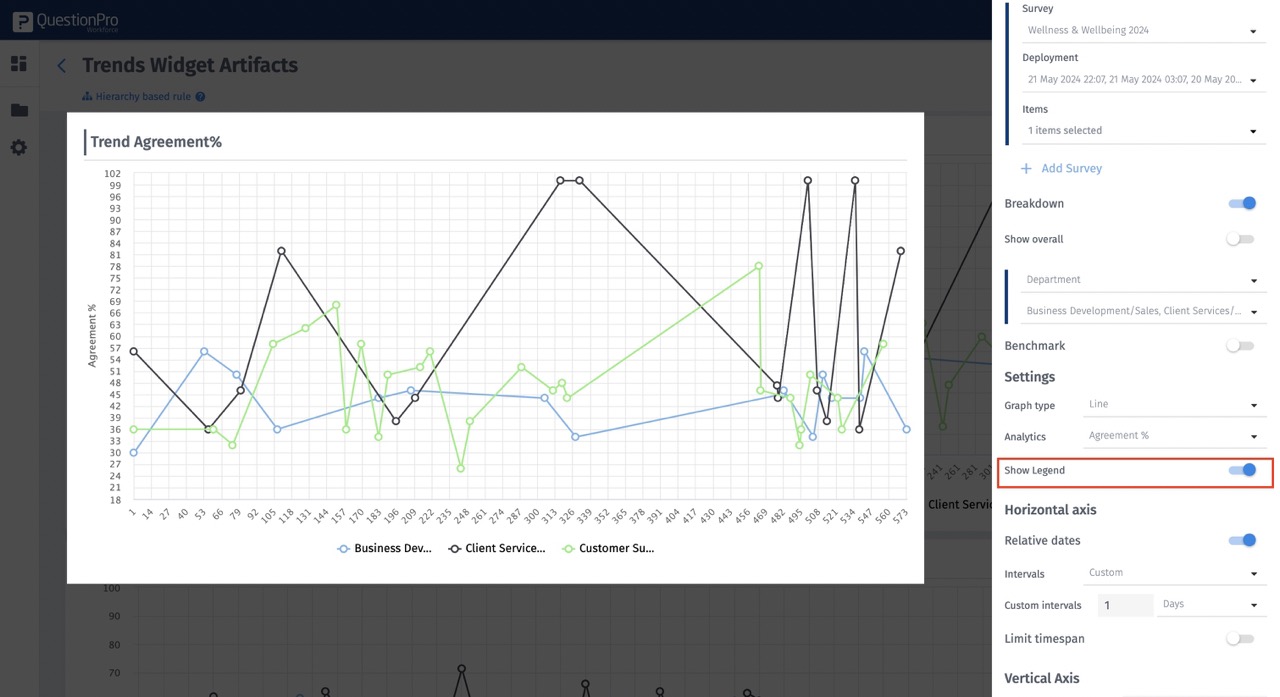
Under the settings option, you can choose the chart style and analytics between agreement and mean
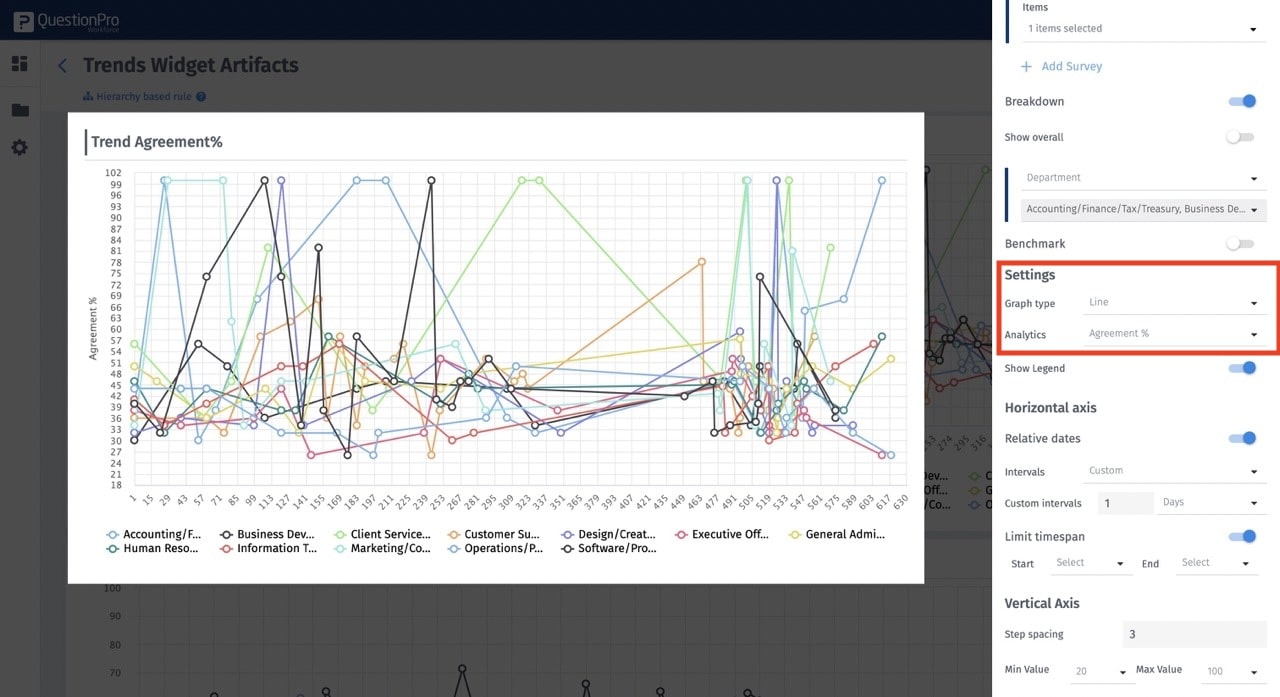
Hide all legends( Line representation) by disabling the “show legend” option
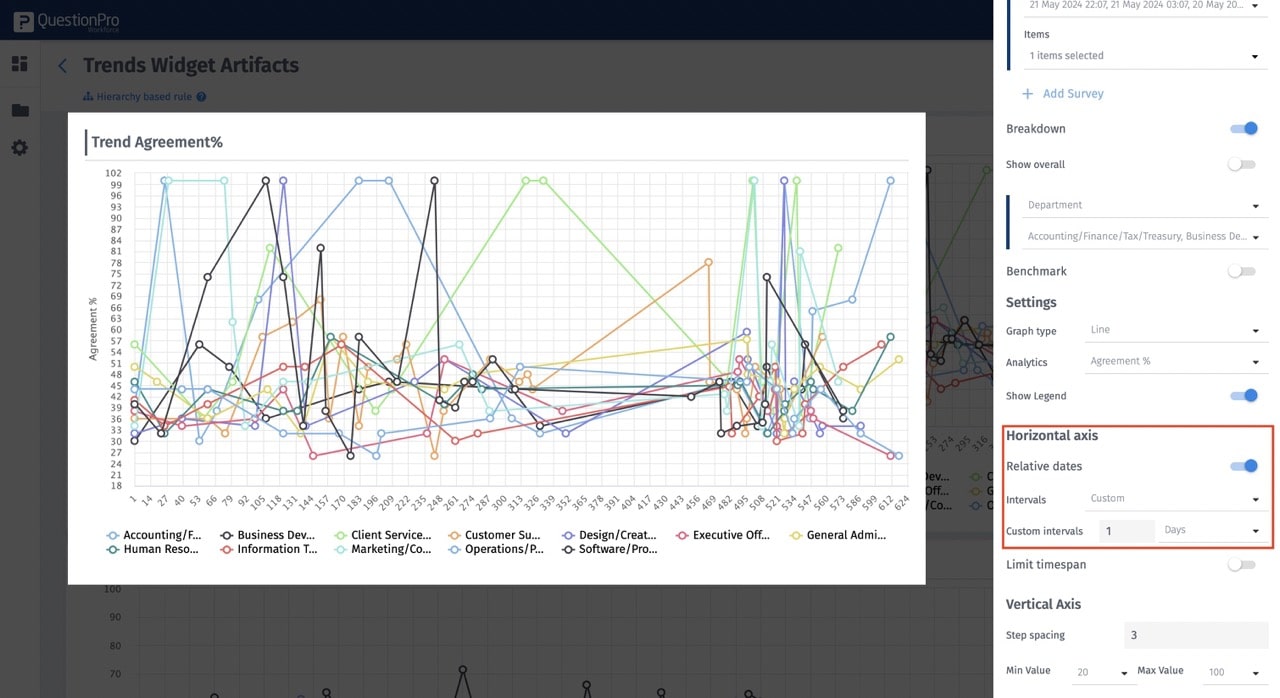
Under the horizontal axis section, enable “Relative dates” and select the interval needed for the analysis or you can choose custom to select the custom intervals of your own choice
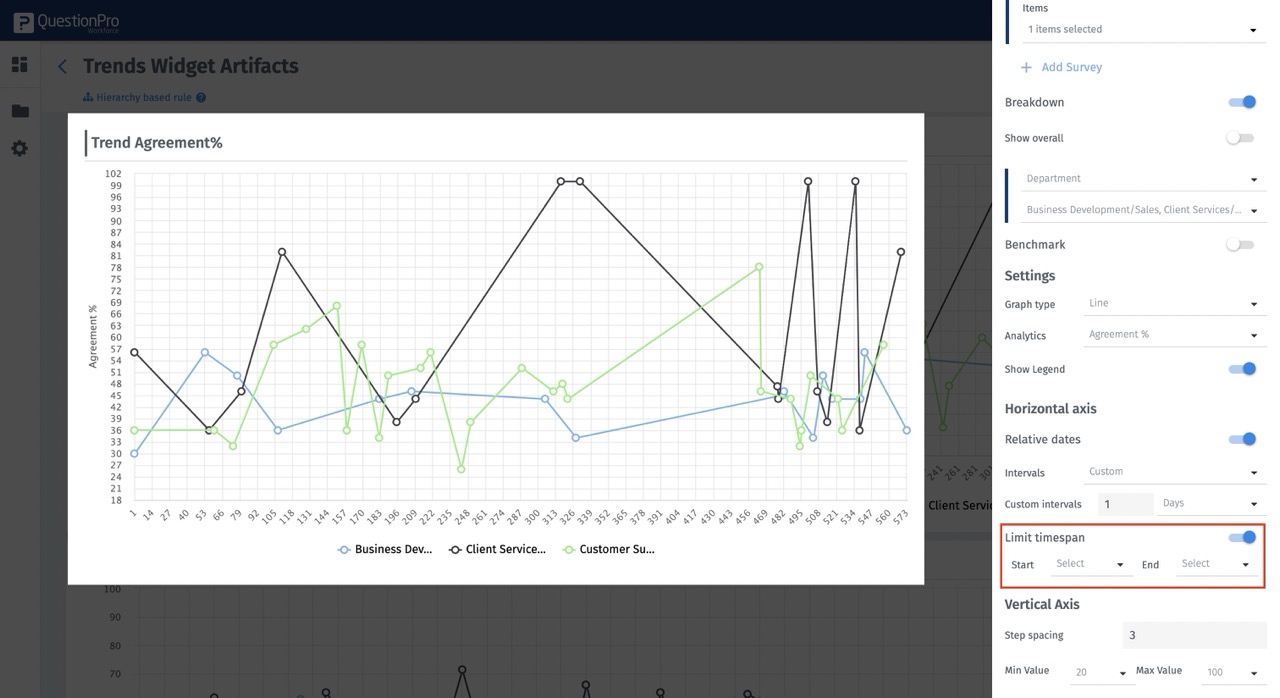
Enable limit span to further choose start and end time period
Under the vertical axis, you can update step spacing and min, and max values for the representation