


Sentiment Donut
The Sentiment Donut is a visual widget that shows the proportional distribution of sentiments derived from text responses to a specific survey question.
This donut-style chart categorizes responses into six sentiment categories: Very Negative, Negative, Neutral, Positive, Very Positive, and No Sentiment. It helps users quickly assess the emotional tone of feedback and compare sentiment trends across questions, groups, or time periods.
- Sentiment Categories: Each sentiment is color-coded and represented as a segment of the donut.
- Very Negative
- Negative
- Neutral
- Positive
- Very Positive
- No Sentiment
- Proportional View: The donut visually represents the percentage share of each sentiment based on the total number of valid text responses.
- Cross-Question Comparison: Multiple sentiment donuts can be used to compare sentiment across groups or questions (if available).
Video coming soon...
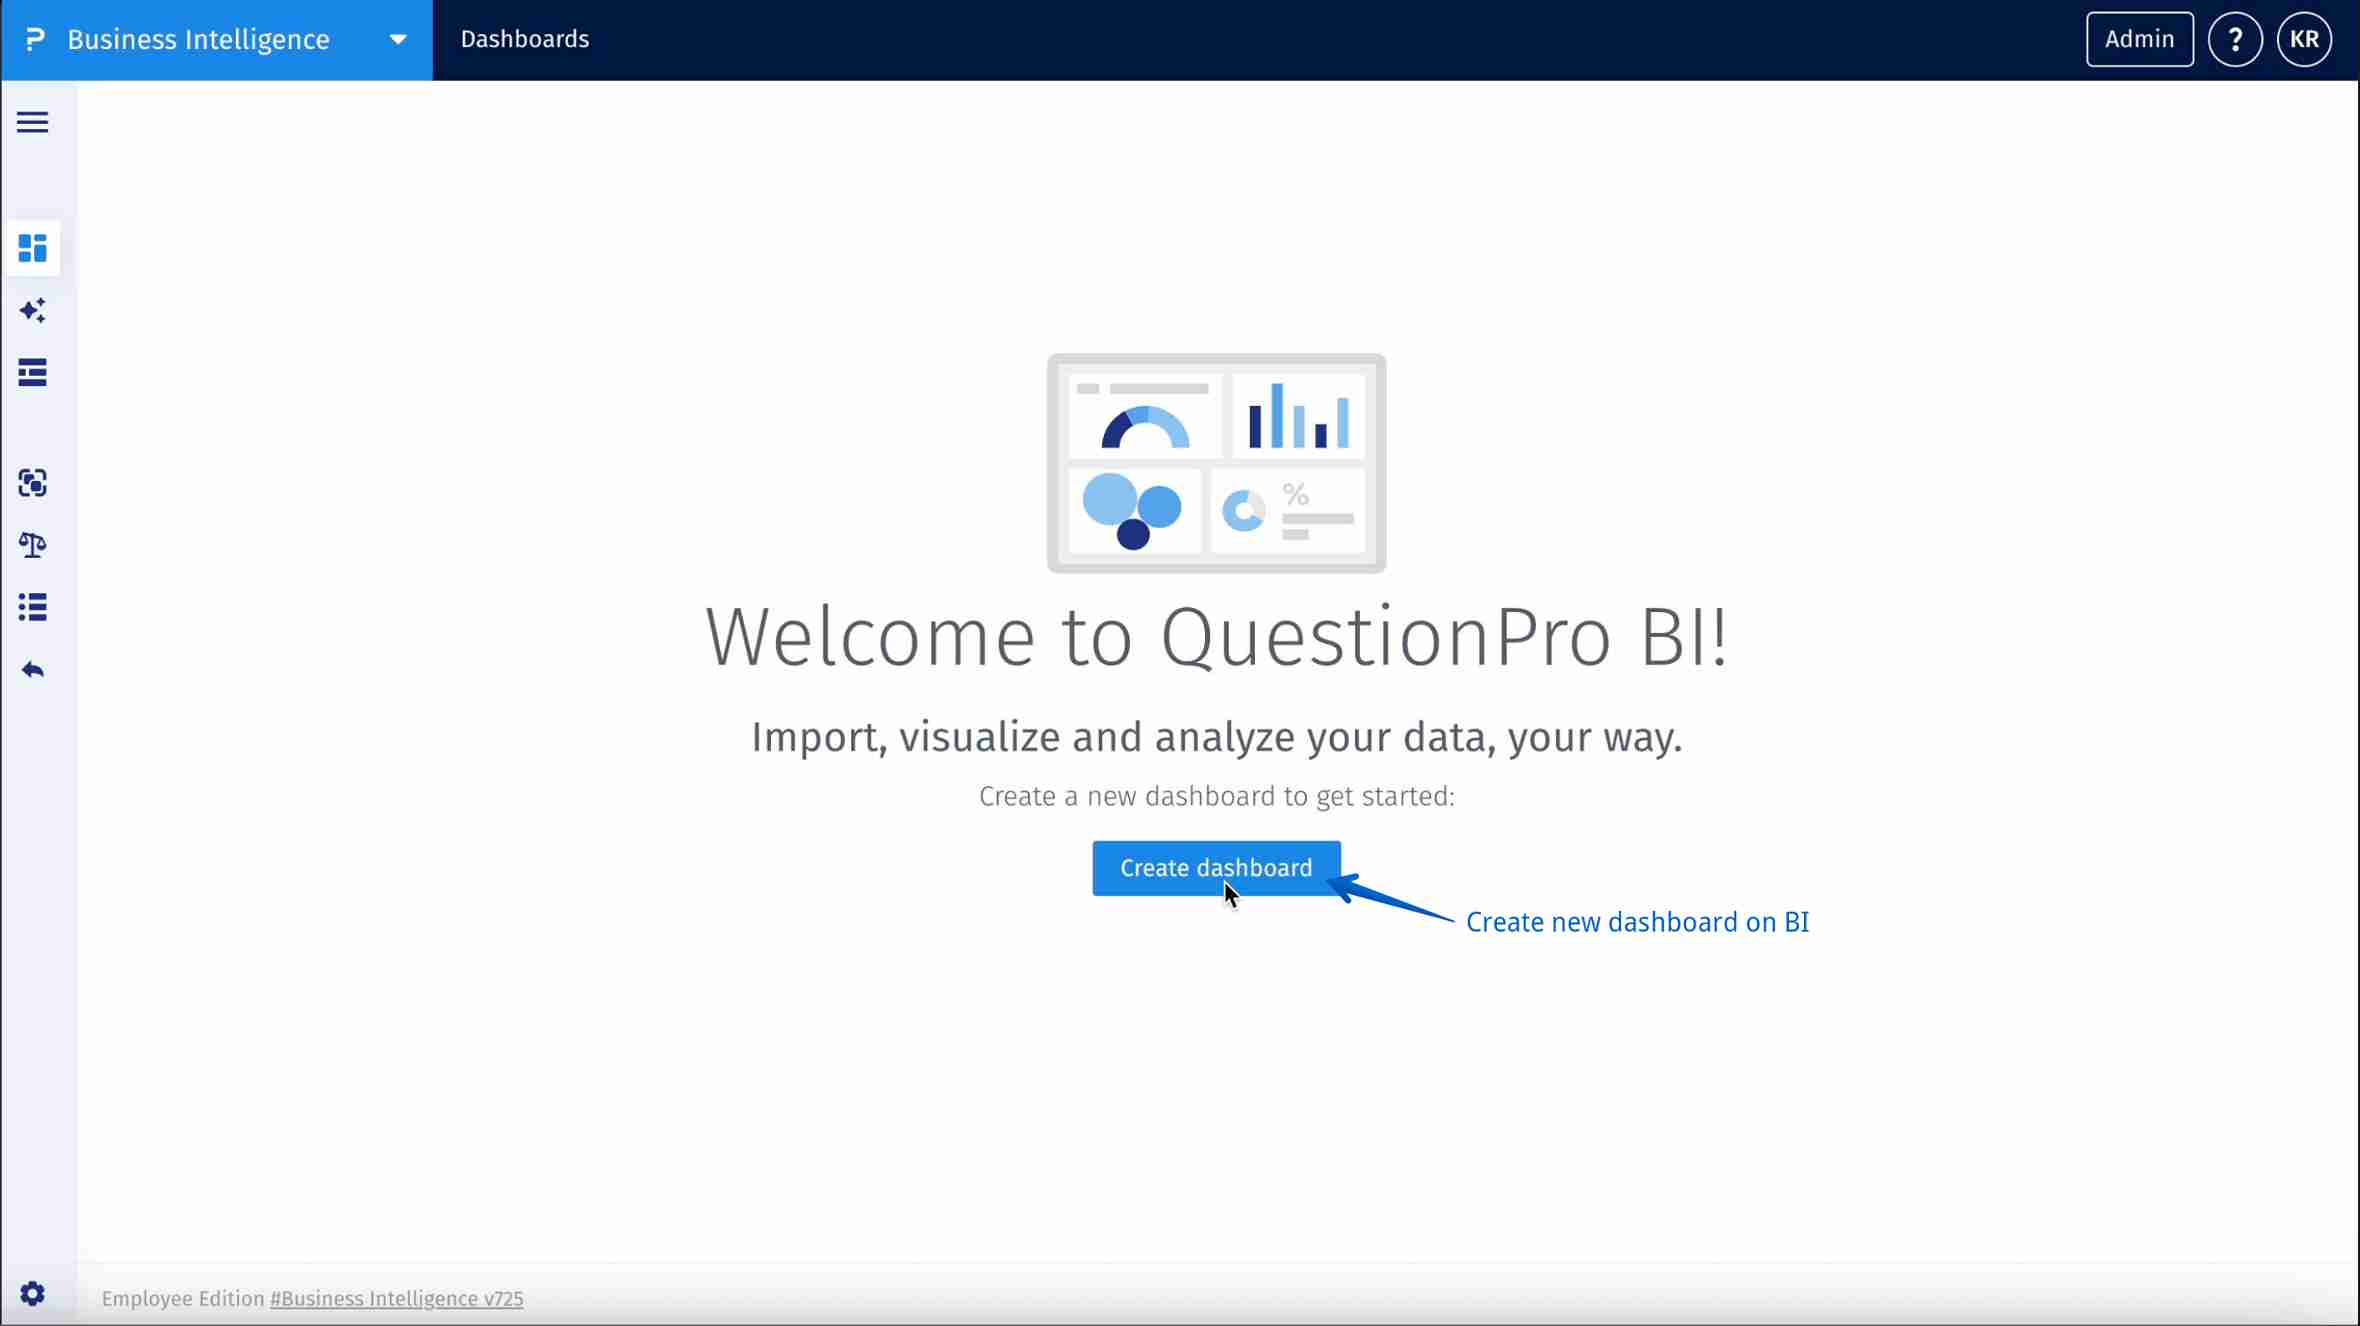
- Step 1: Create dashboard – To create sentiment donut widget create a new dashboard or in an existing go to Step 6.
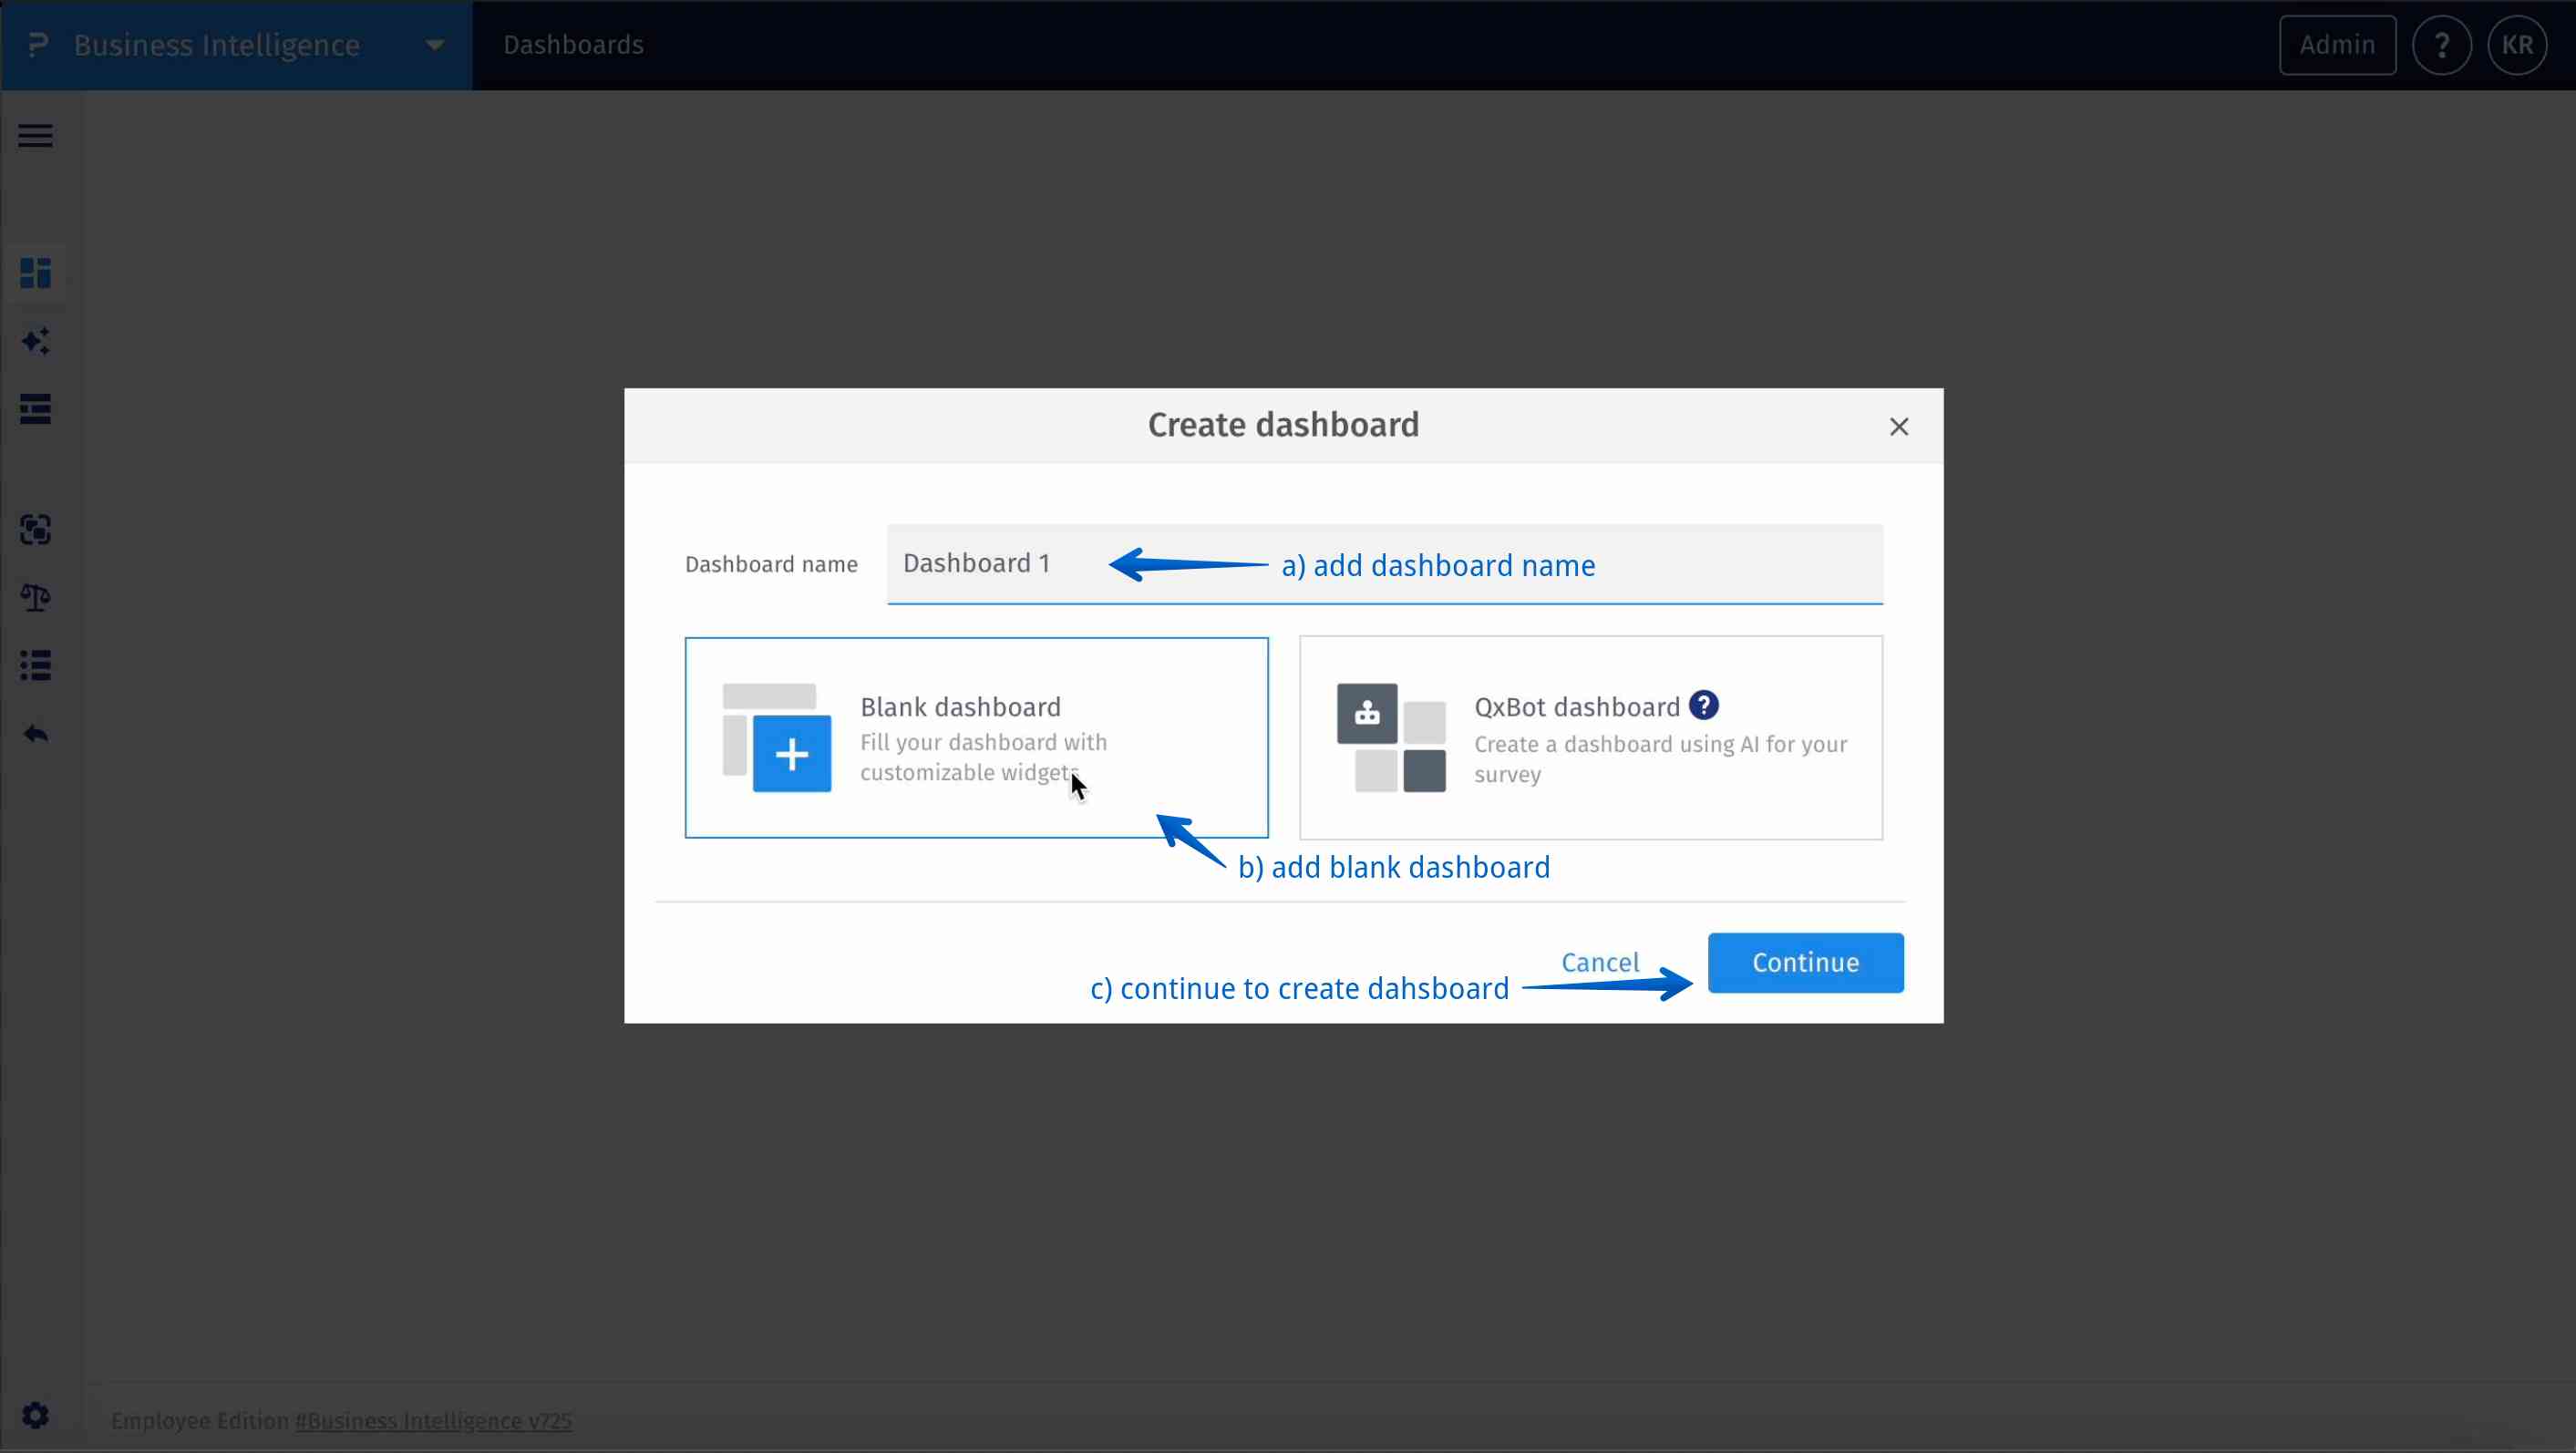
- Step 2: Select blank dashboard – Choose a blank dashboard layout as the starting point for adding your sentiment donut widget or in an existing go to Step 6.
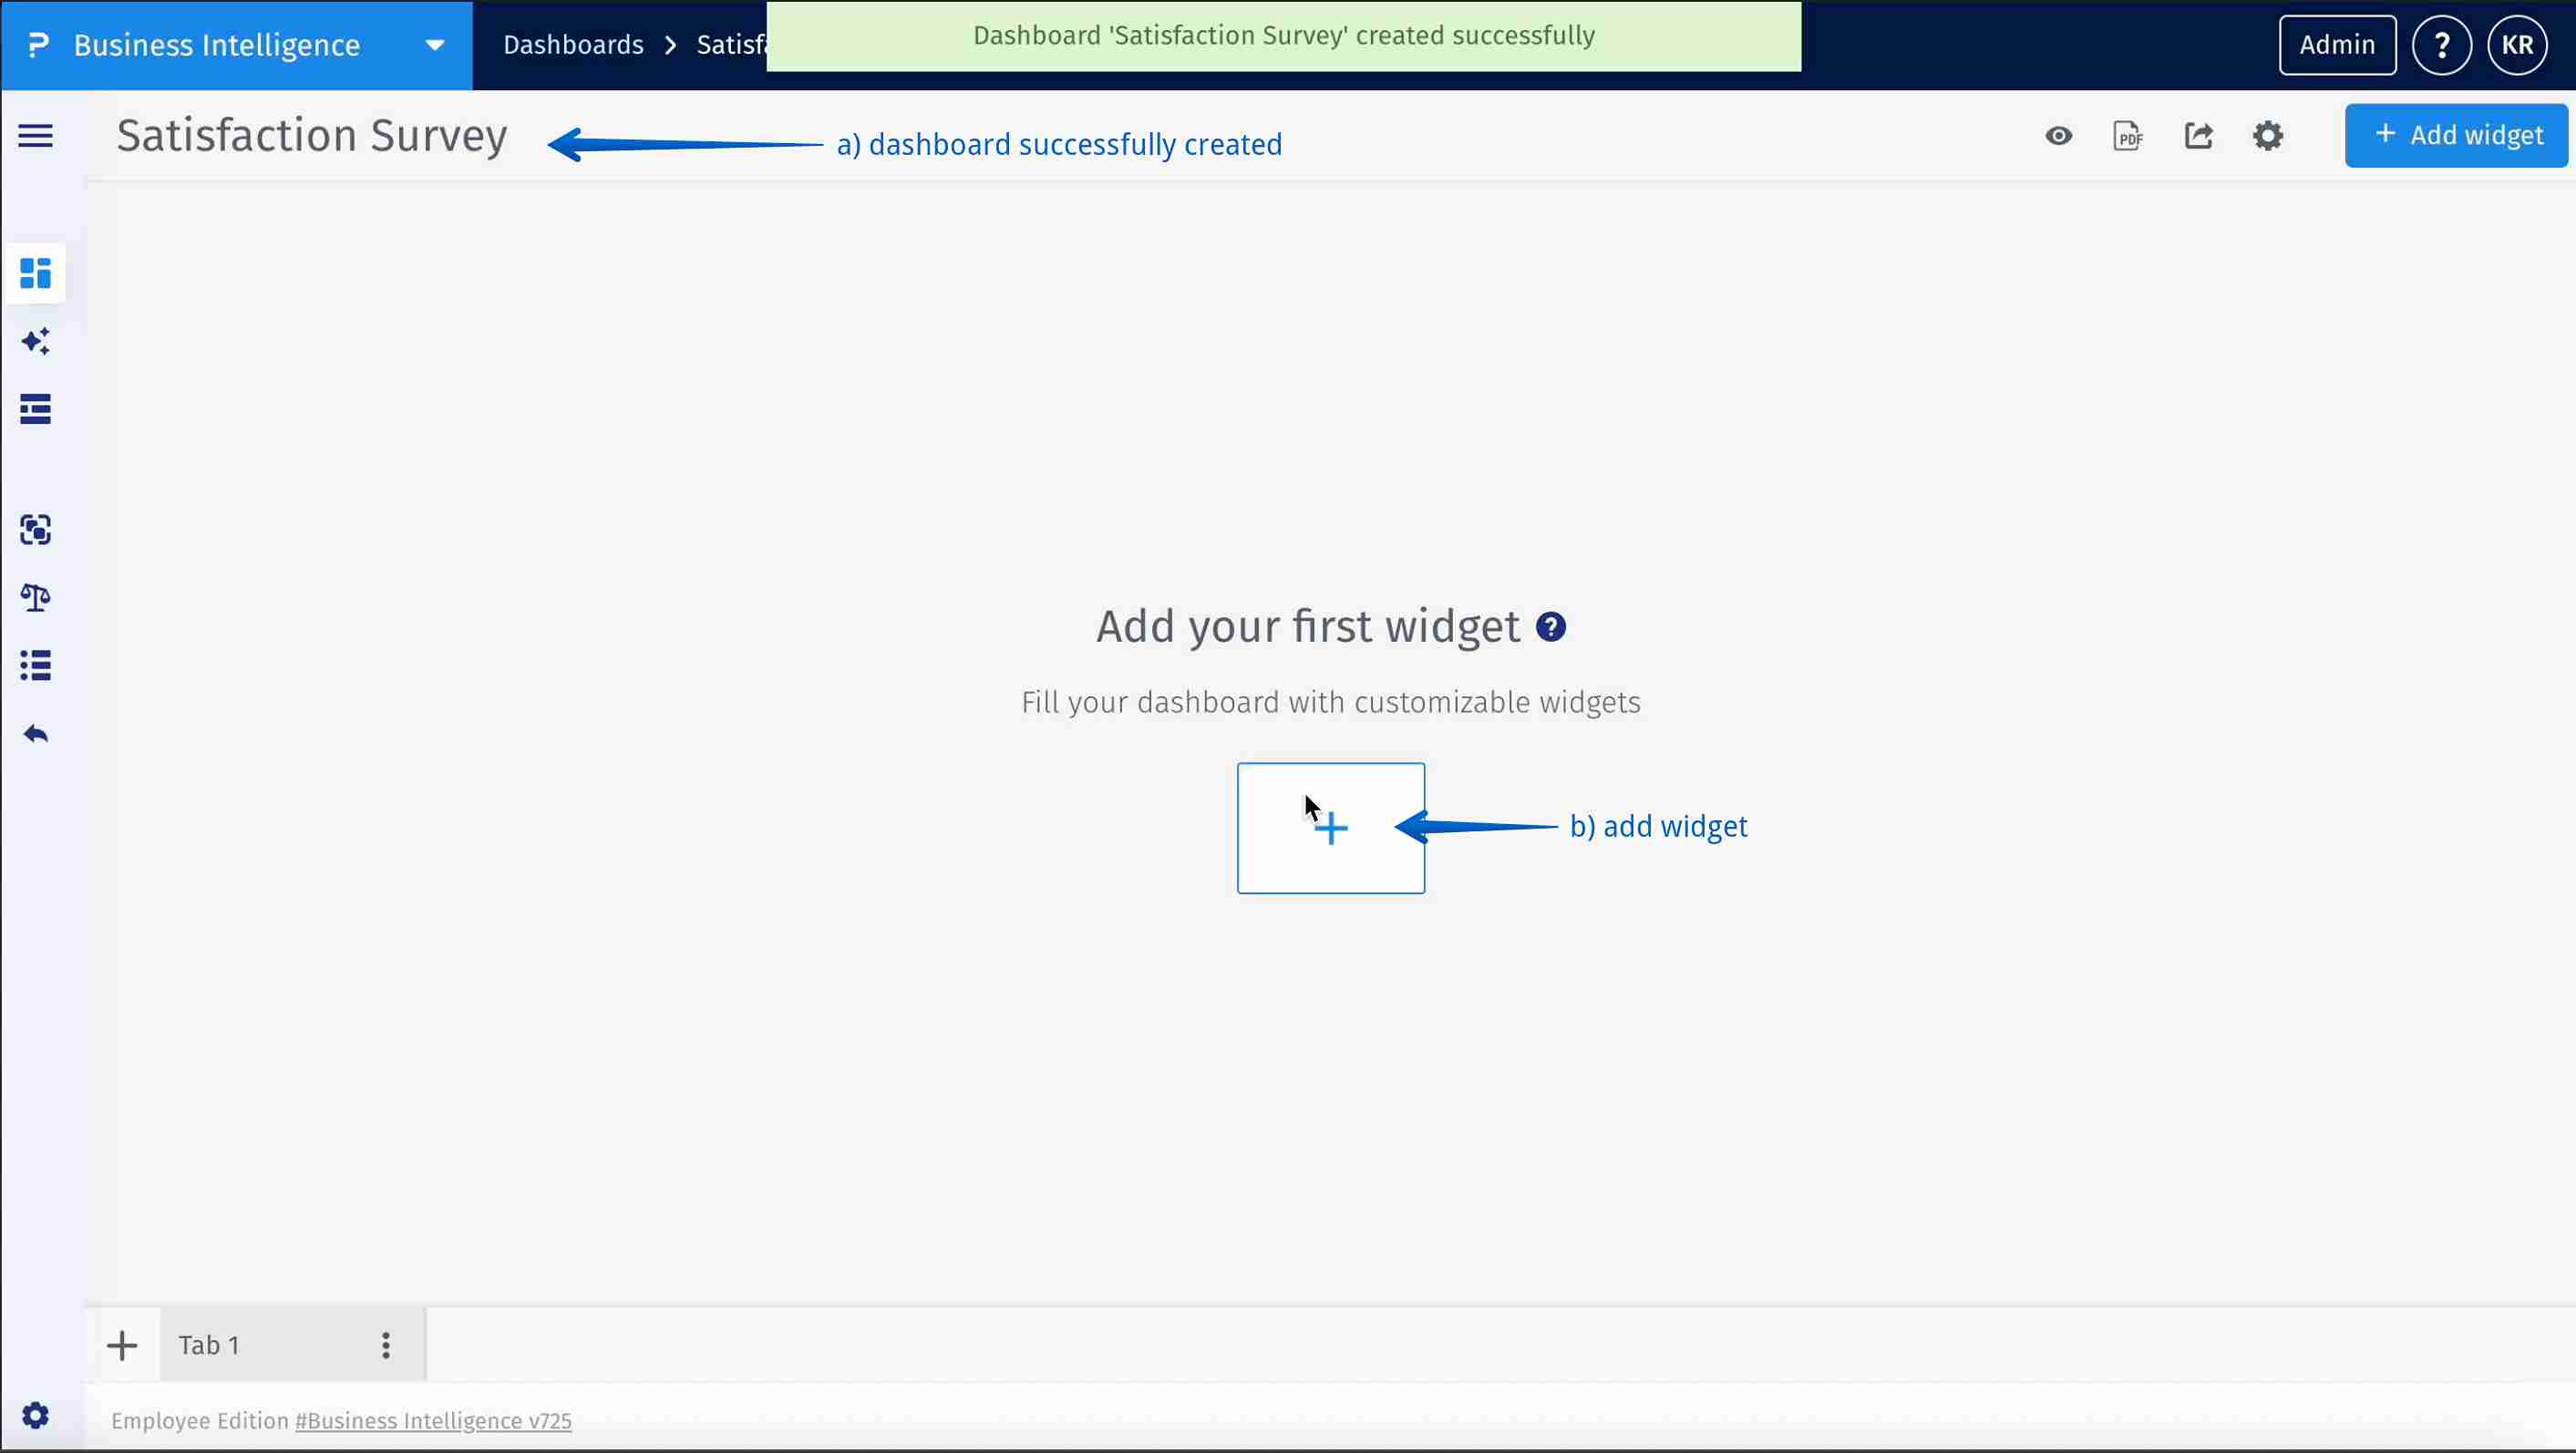
- Step 3: Add widget – Click on “Add Widget” to begin inserting visual elements, into your dashboard
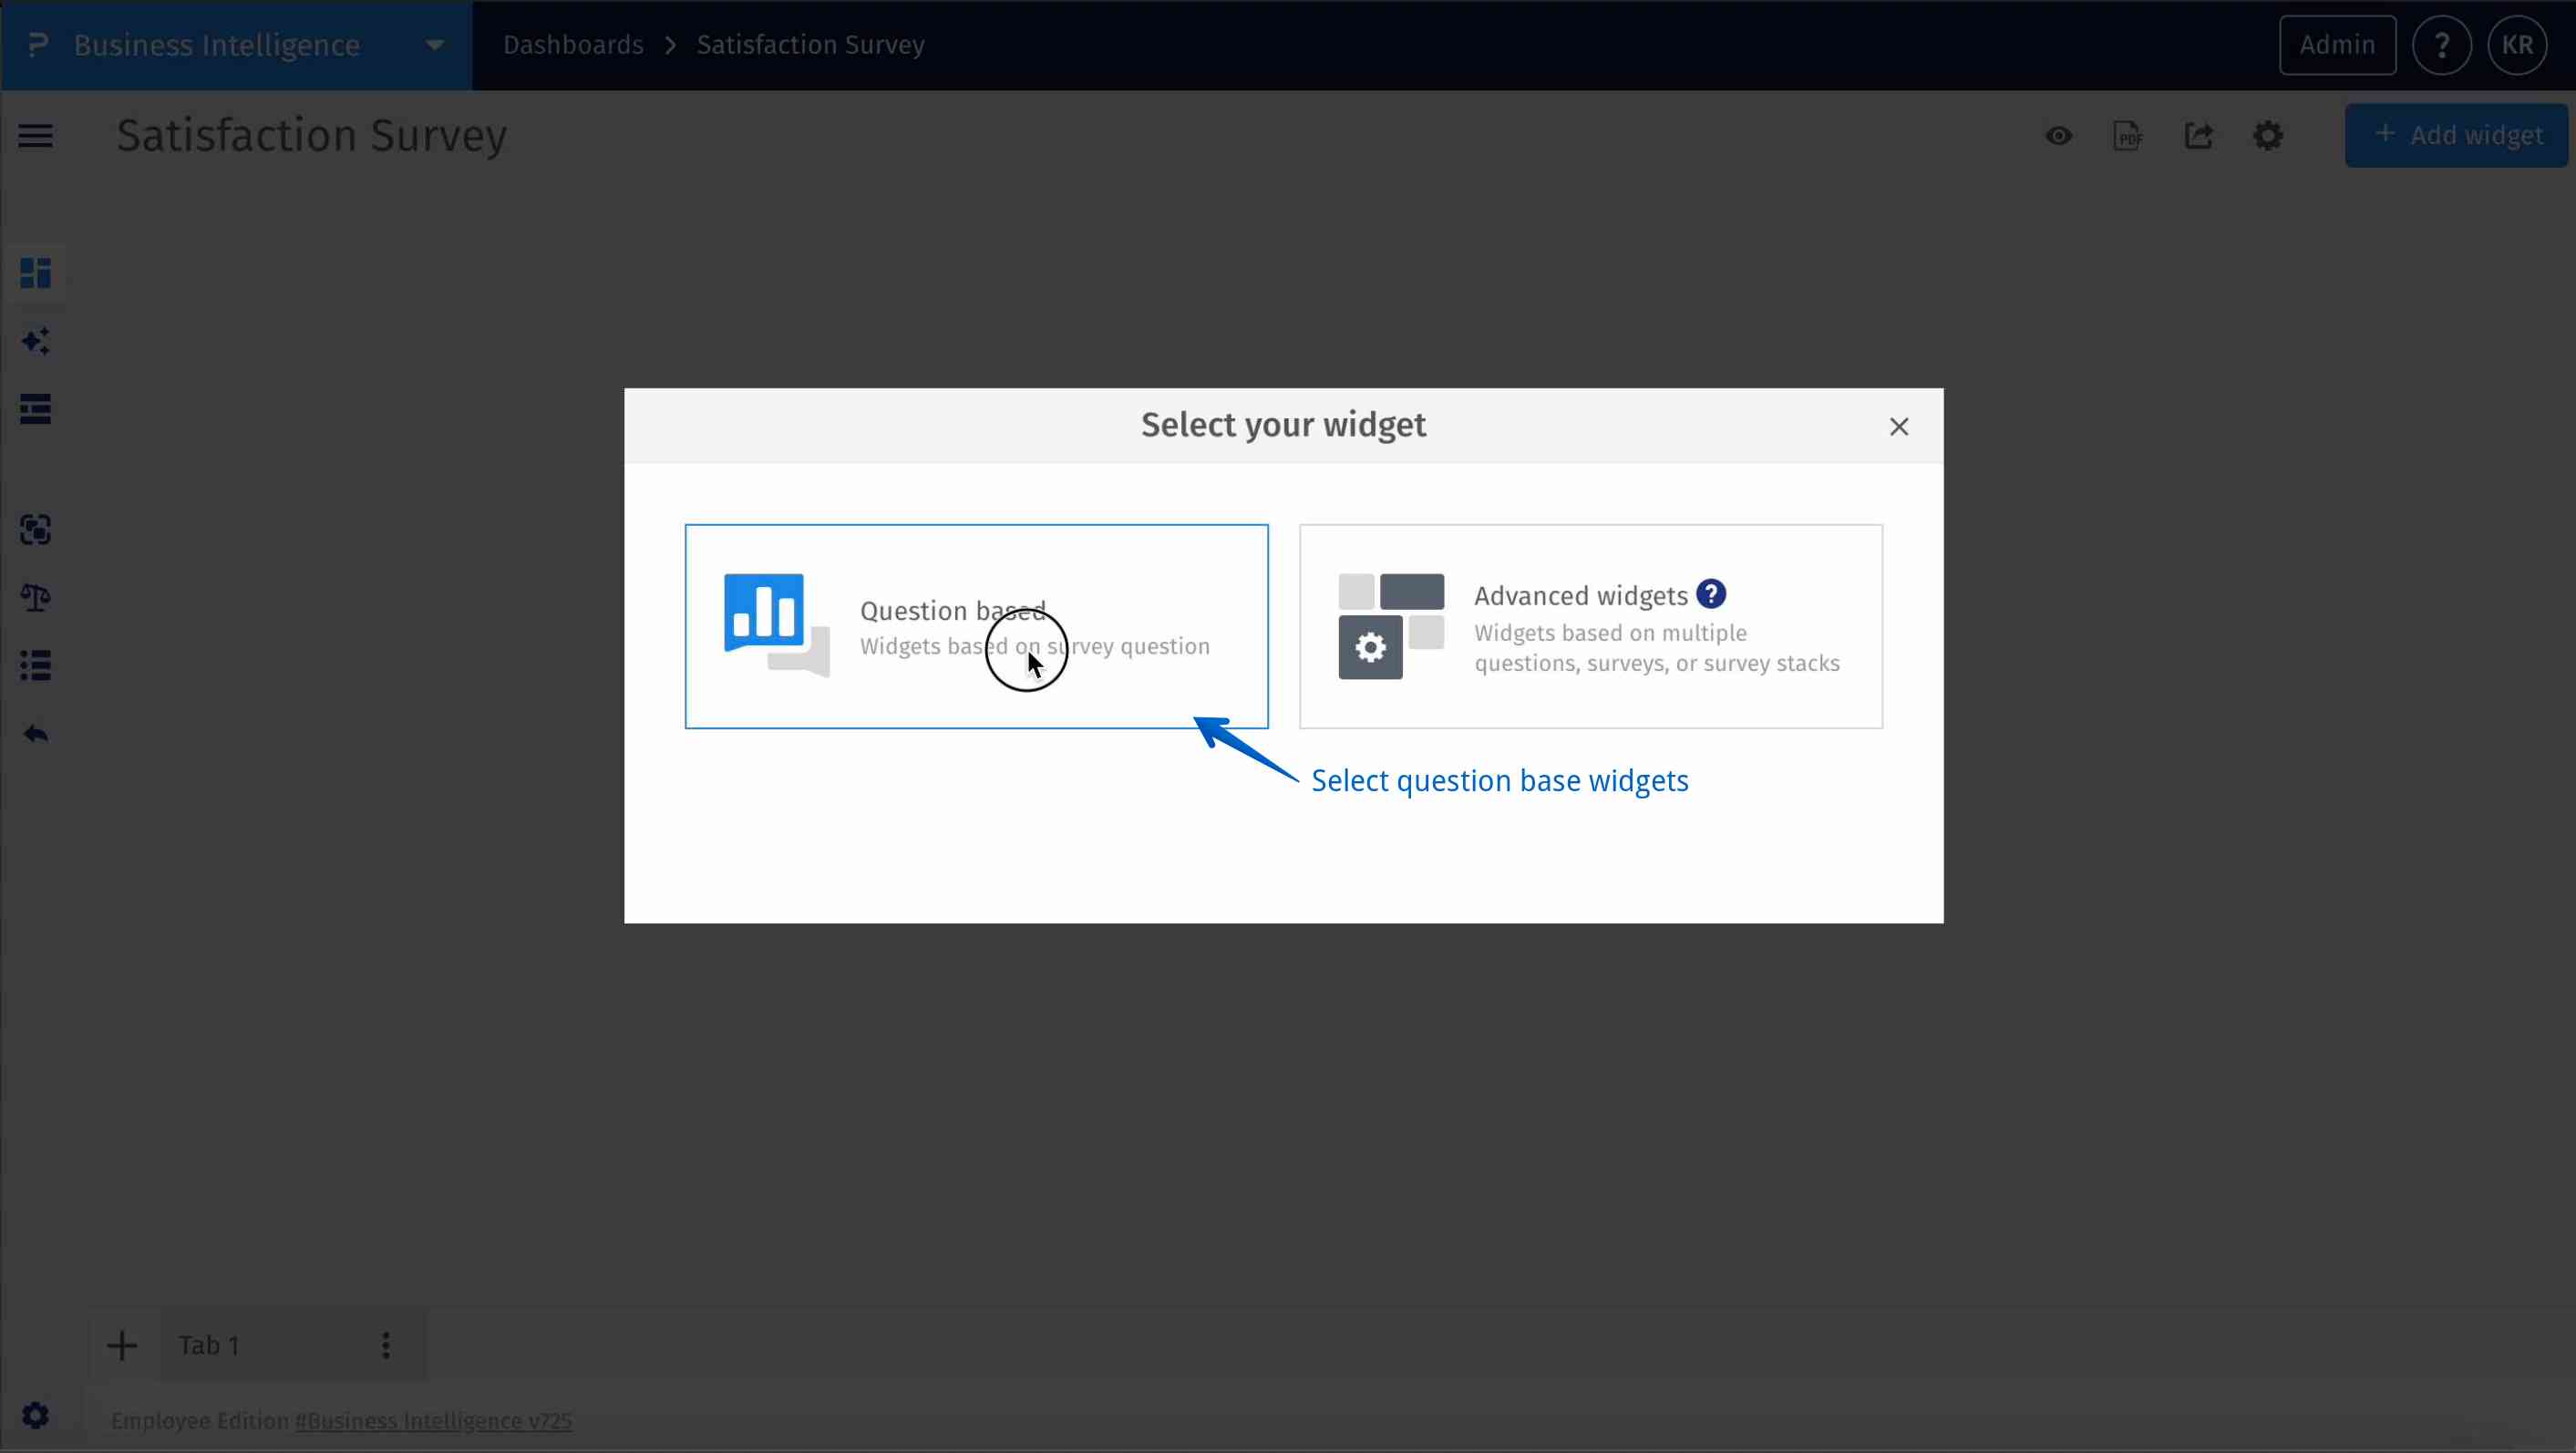
- Step 4: Select your widget – Choose the sentiment donut widget and link it to a specific open-ended survey question to visualize sentiment proportion from each respondent in the survey.
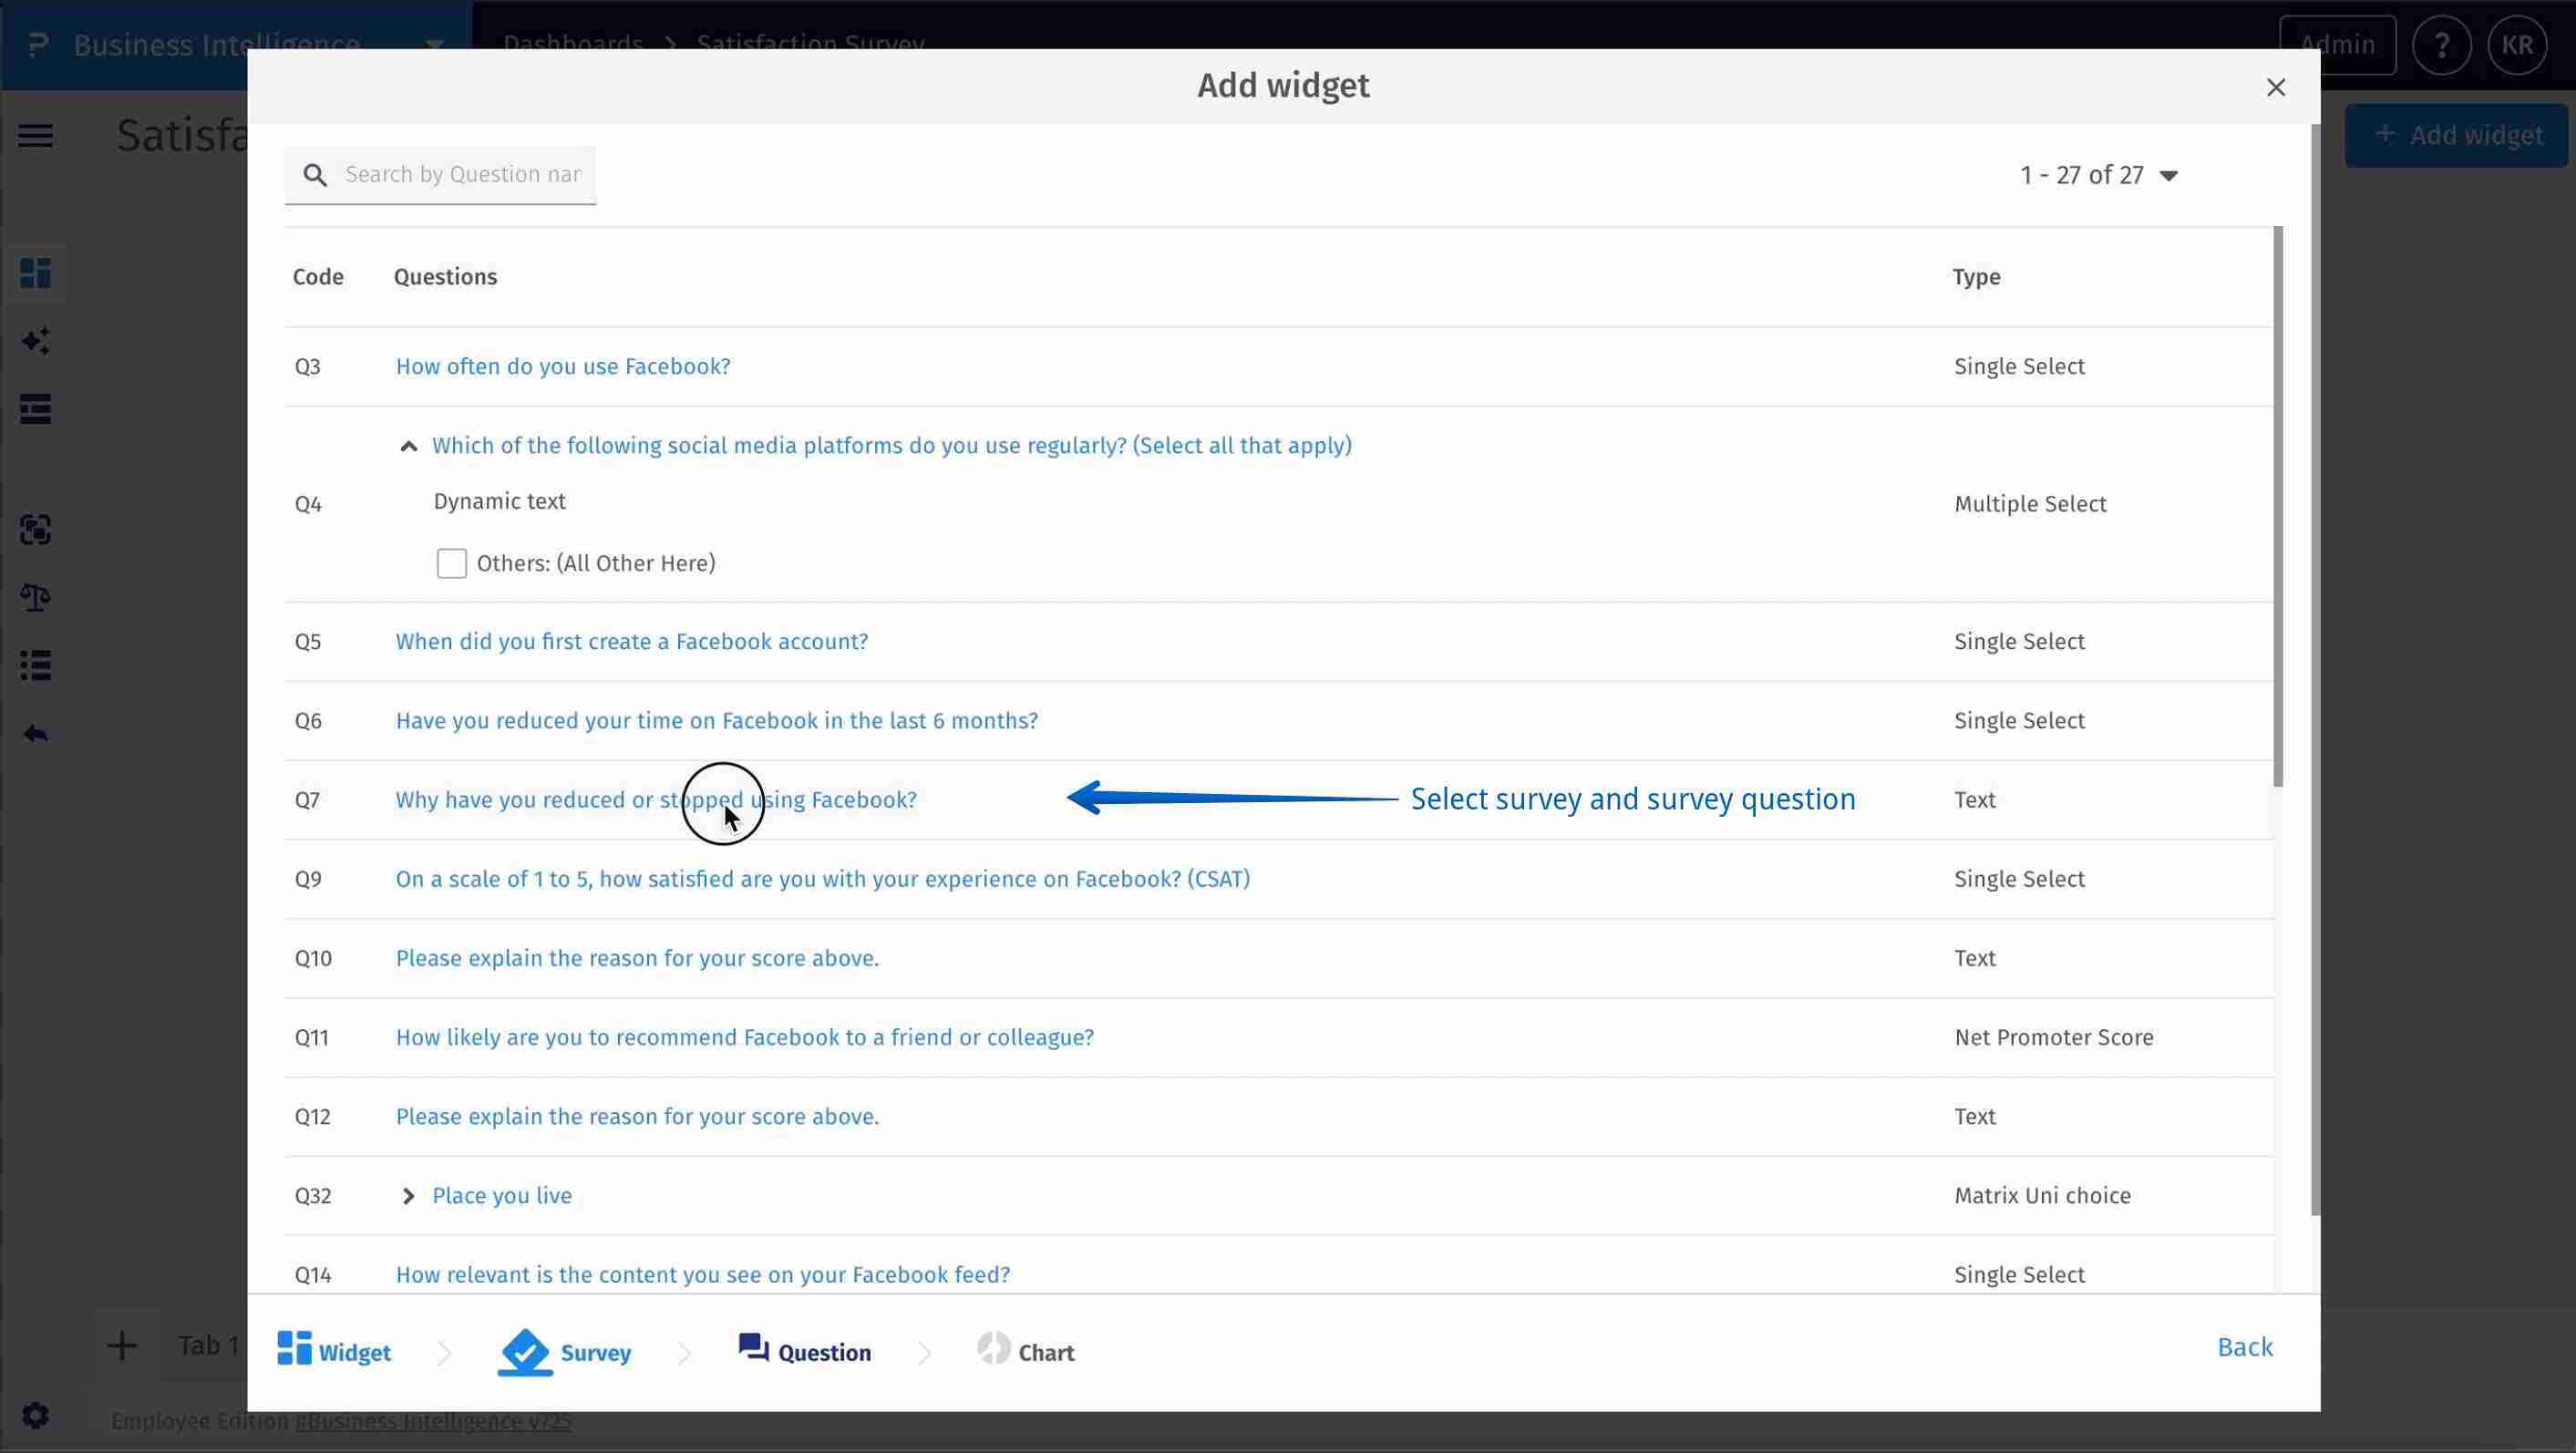
- Step 5: Select survey and survey question – Select the relevant survey and then choose a text-based (open-ended) question. The sentiment donut widget supports only text question types to display proportion of sentiments for a specific survey question.
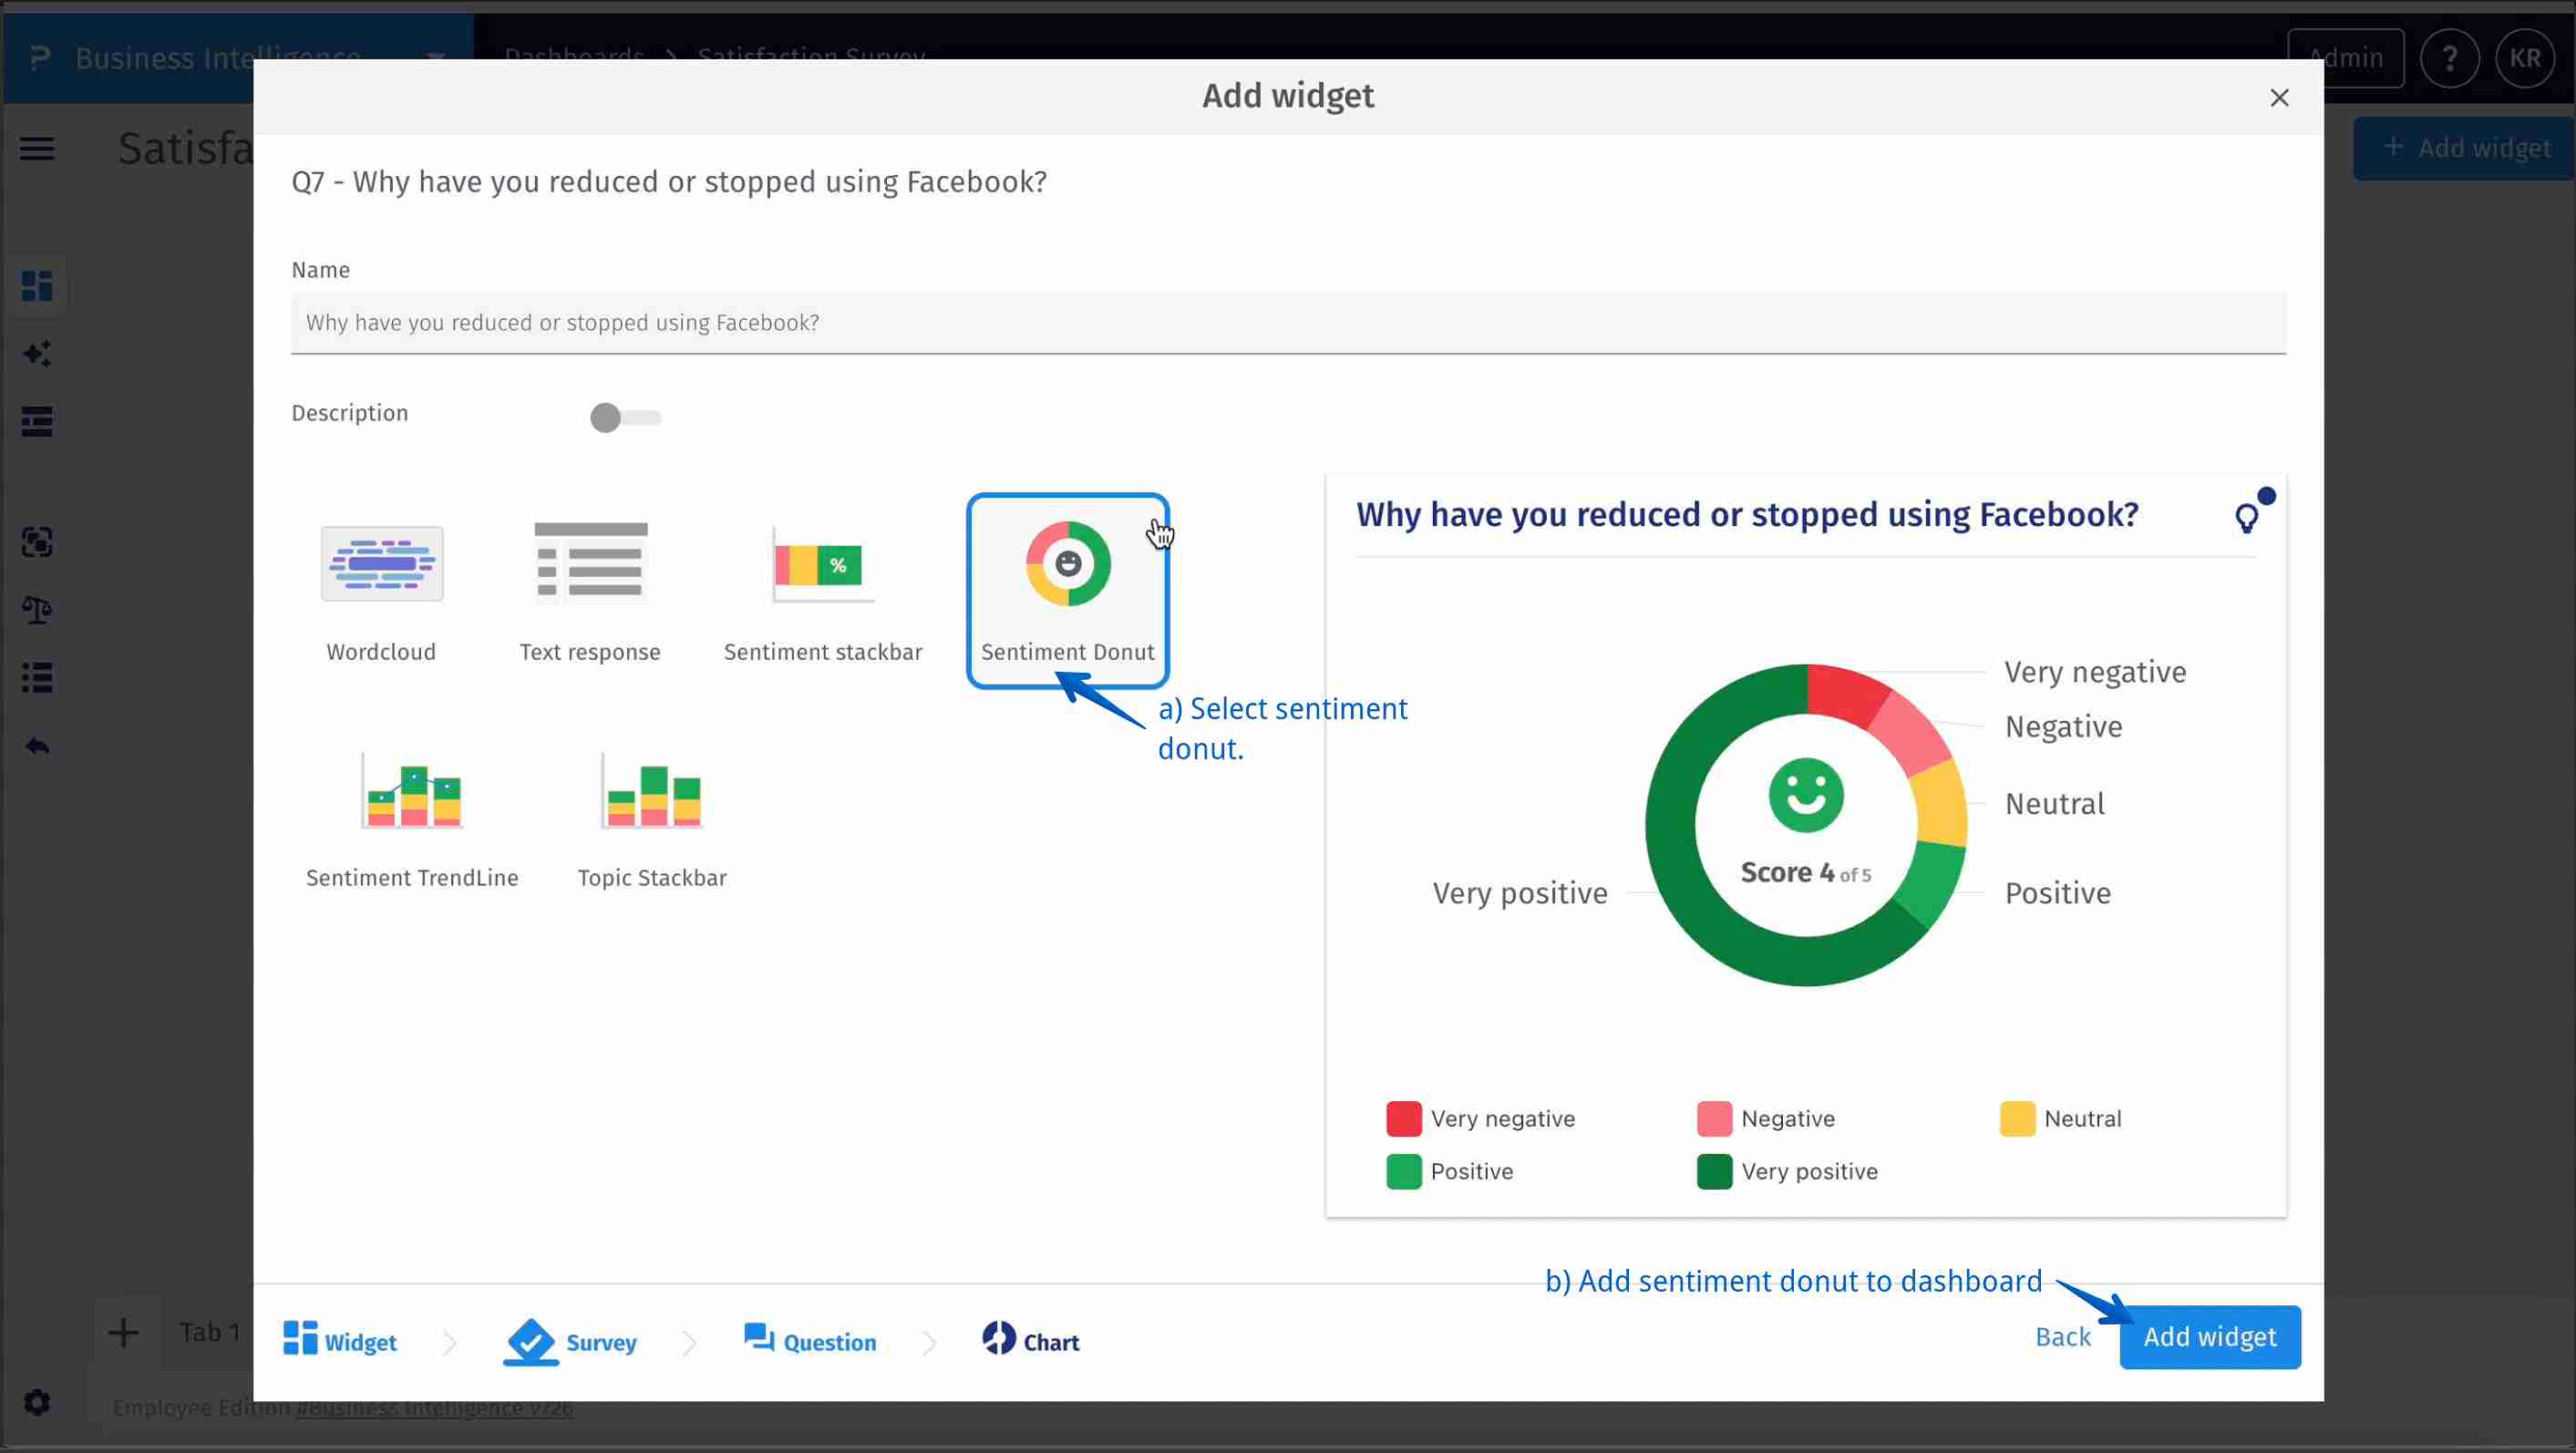
- Step 6: Select sentiment donut – Select the relevant survey and then choose a text-based (open-ended) question. The sentiment donut widget supports only text question types to display proportion of sentiment for a specific survey question.
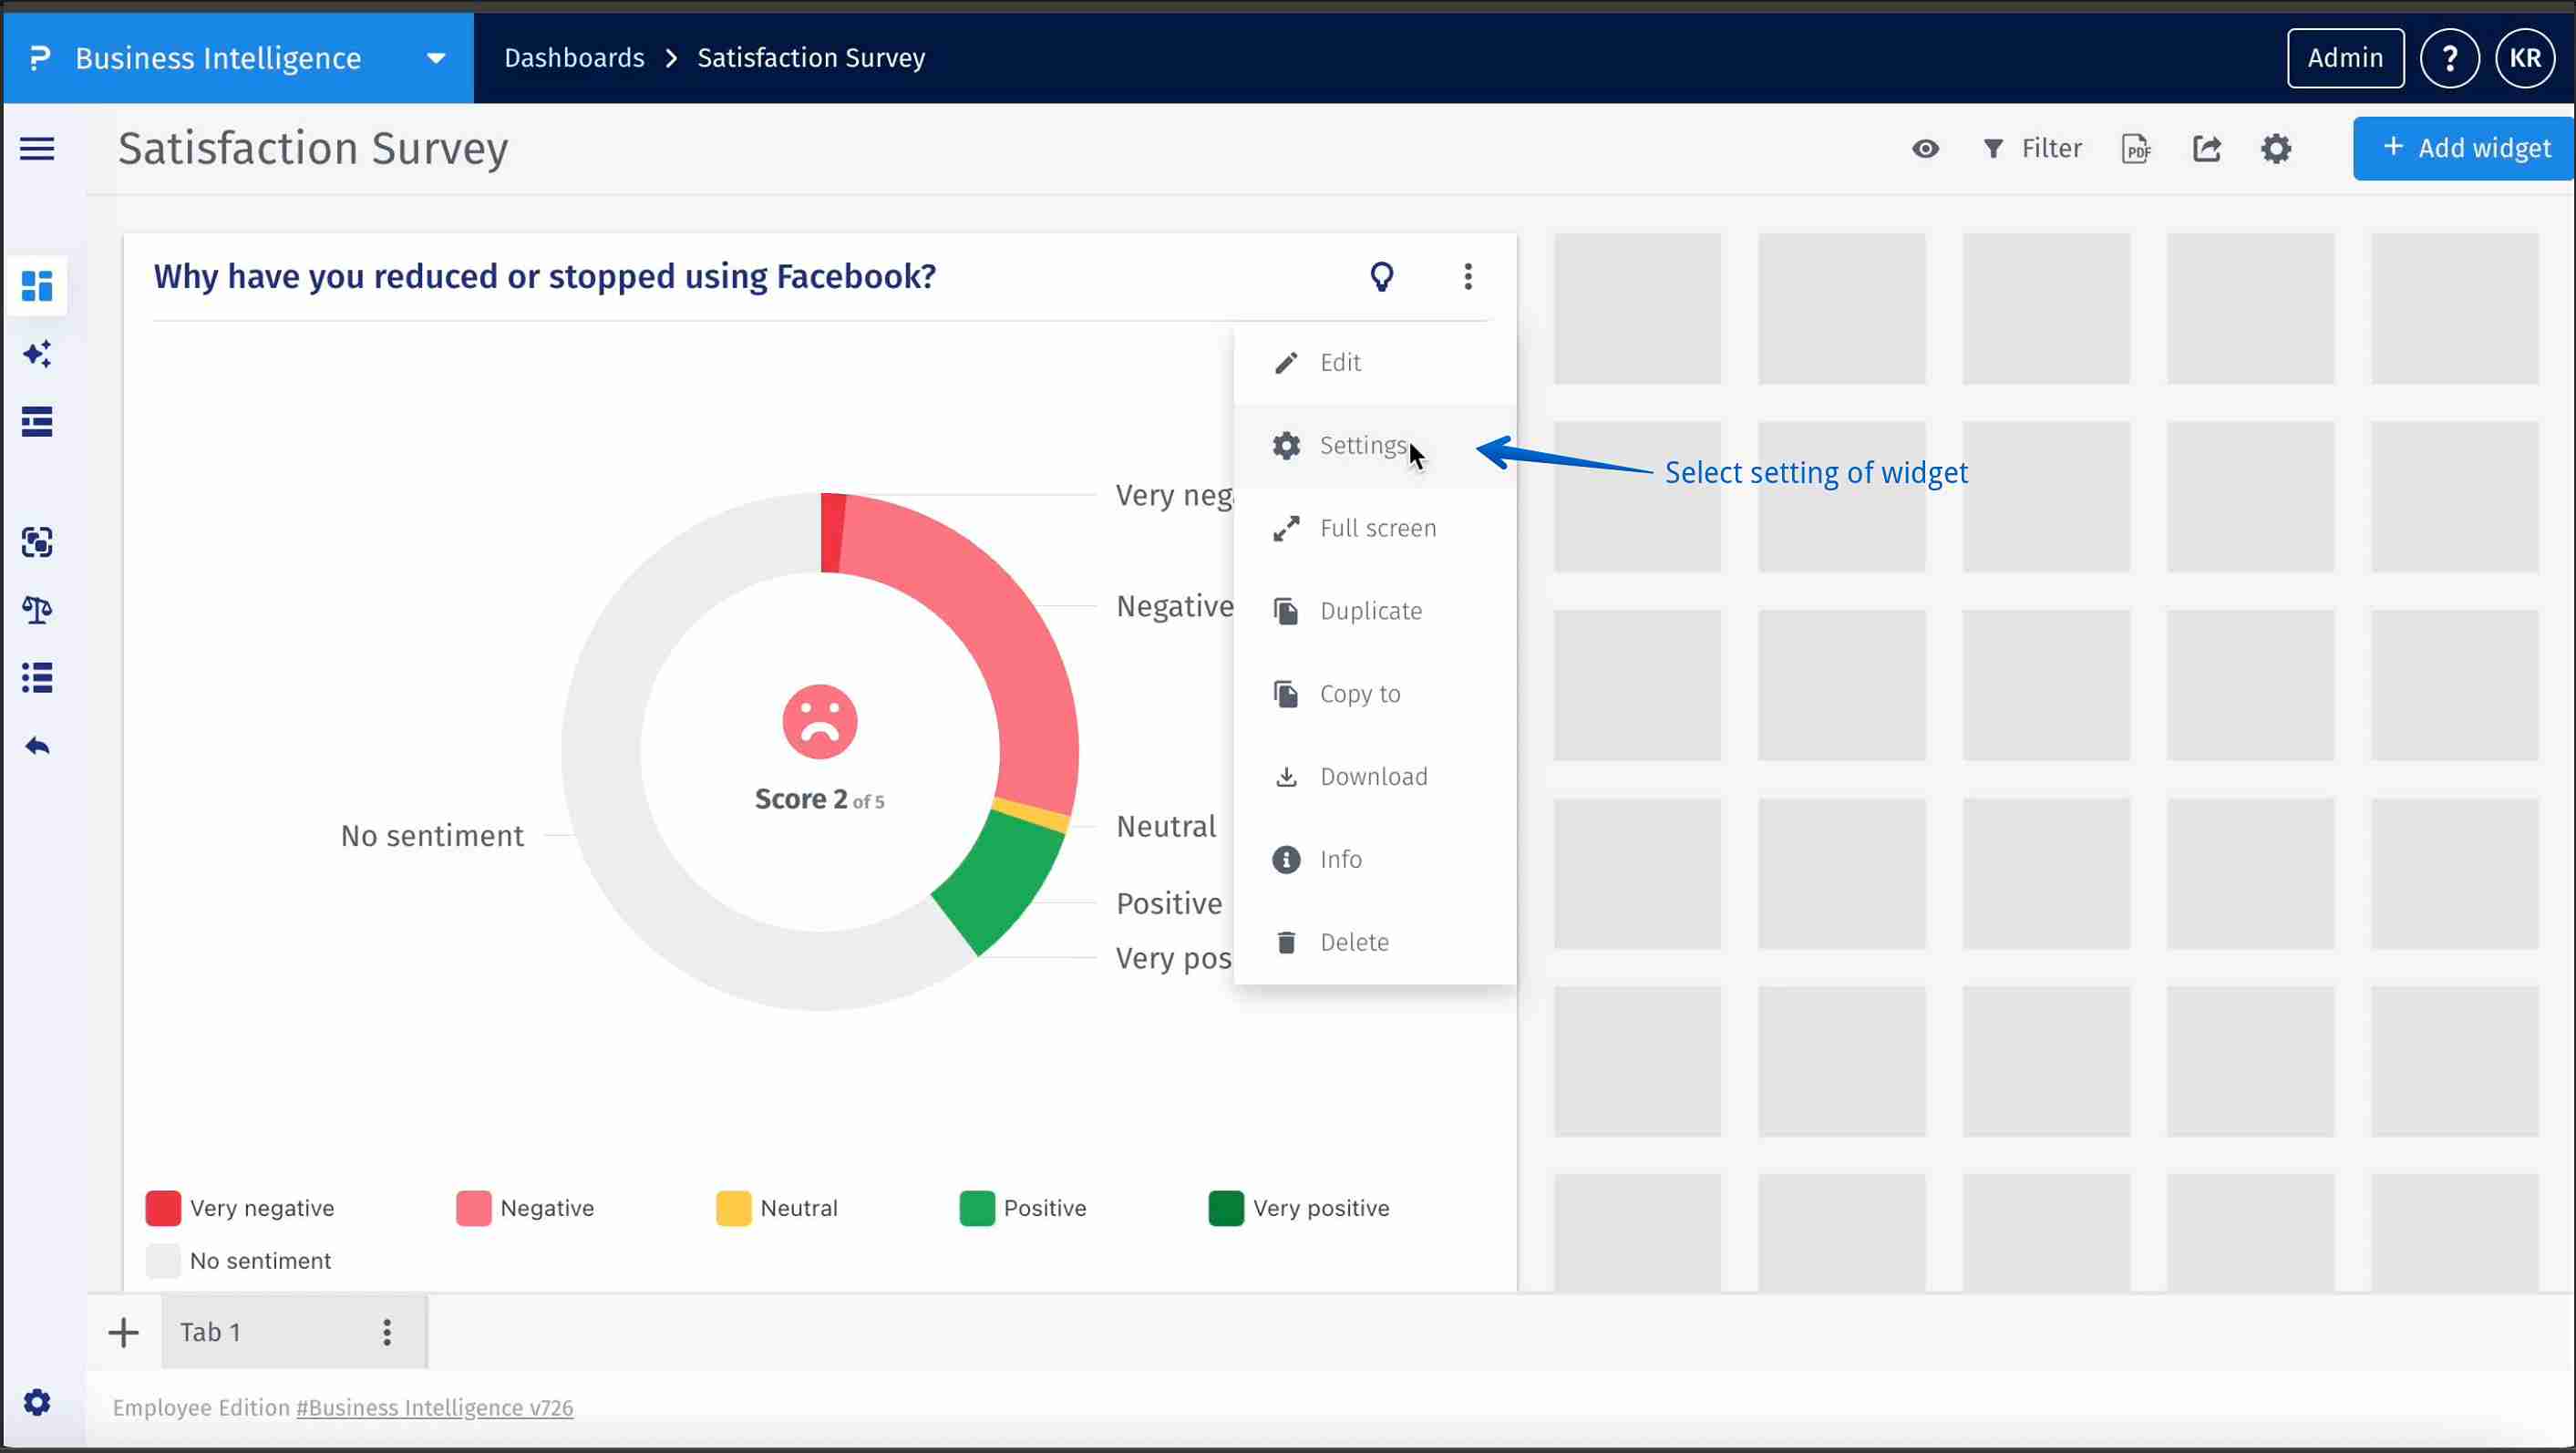
- Step 7: Change setting for sentiment donut widget – Click on the three-dot menu (⋮) on the sentiment donut widget to access and customize settings for the widget
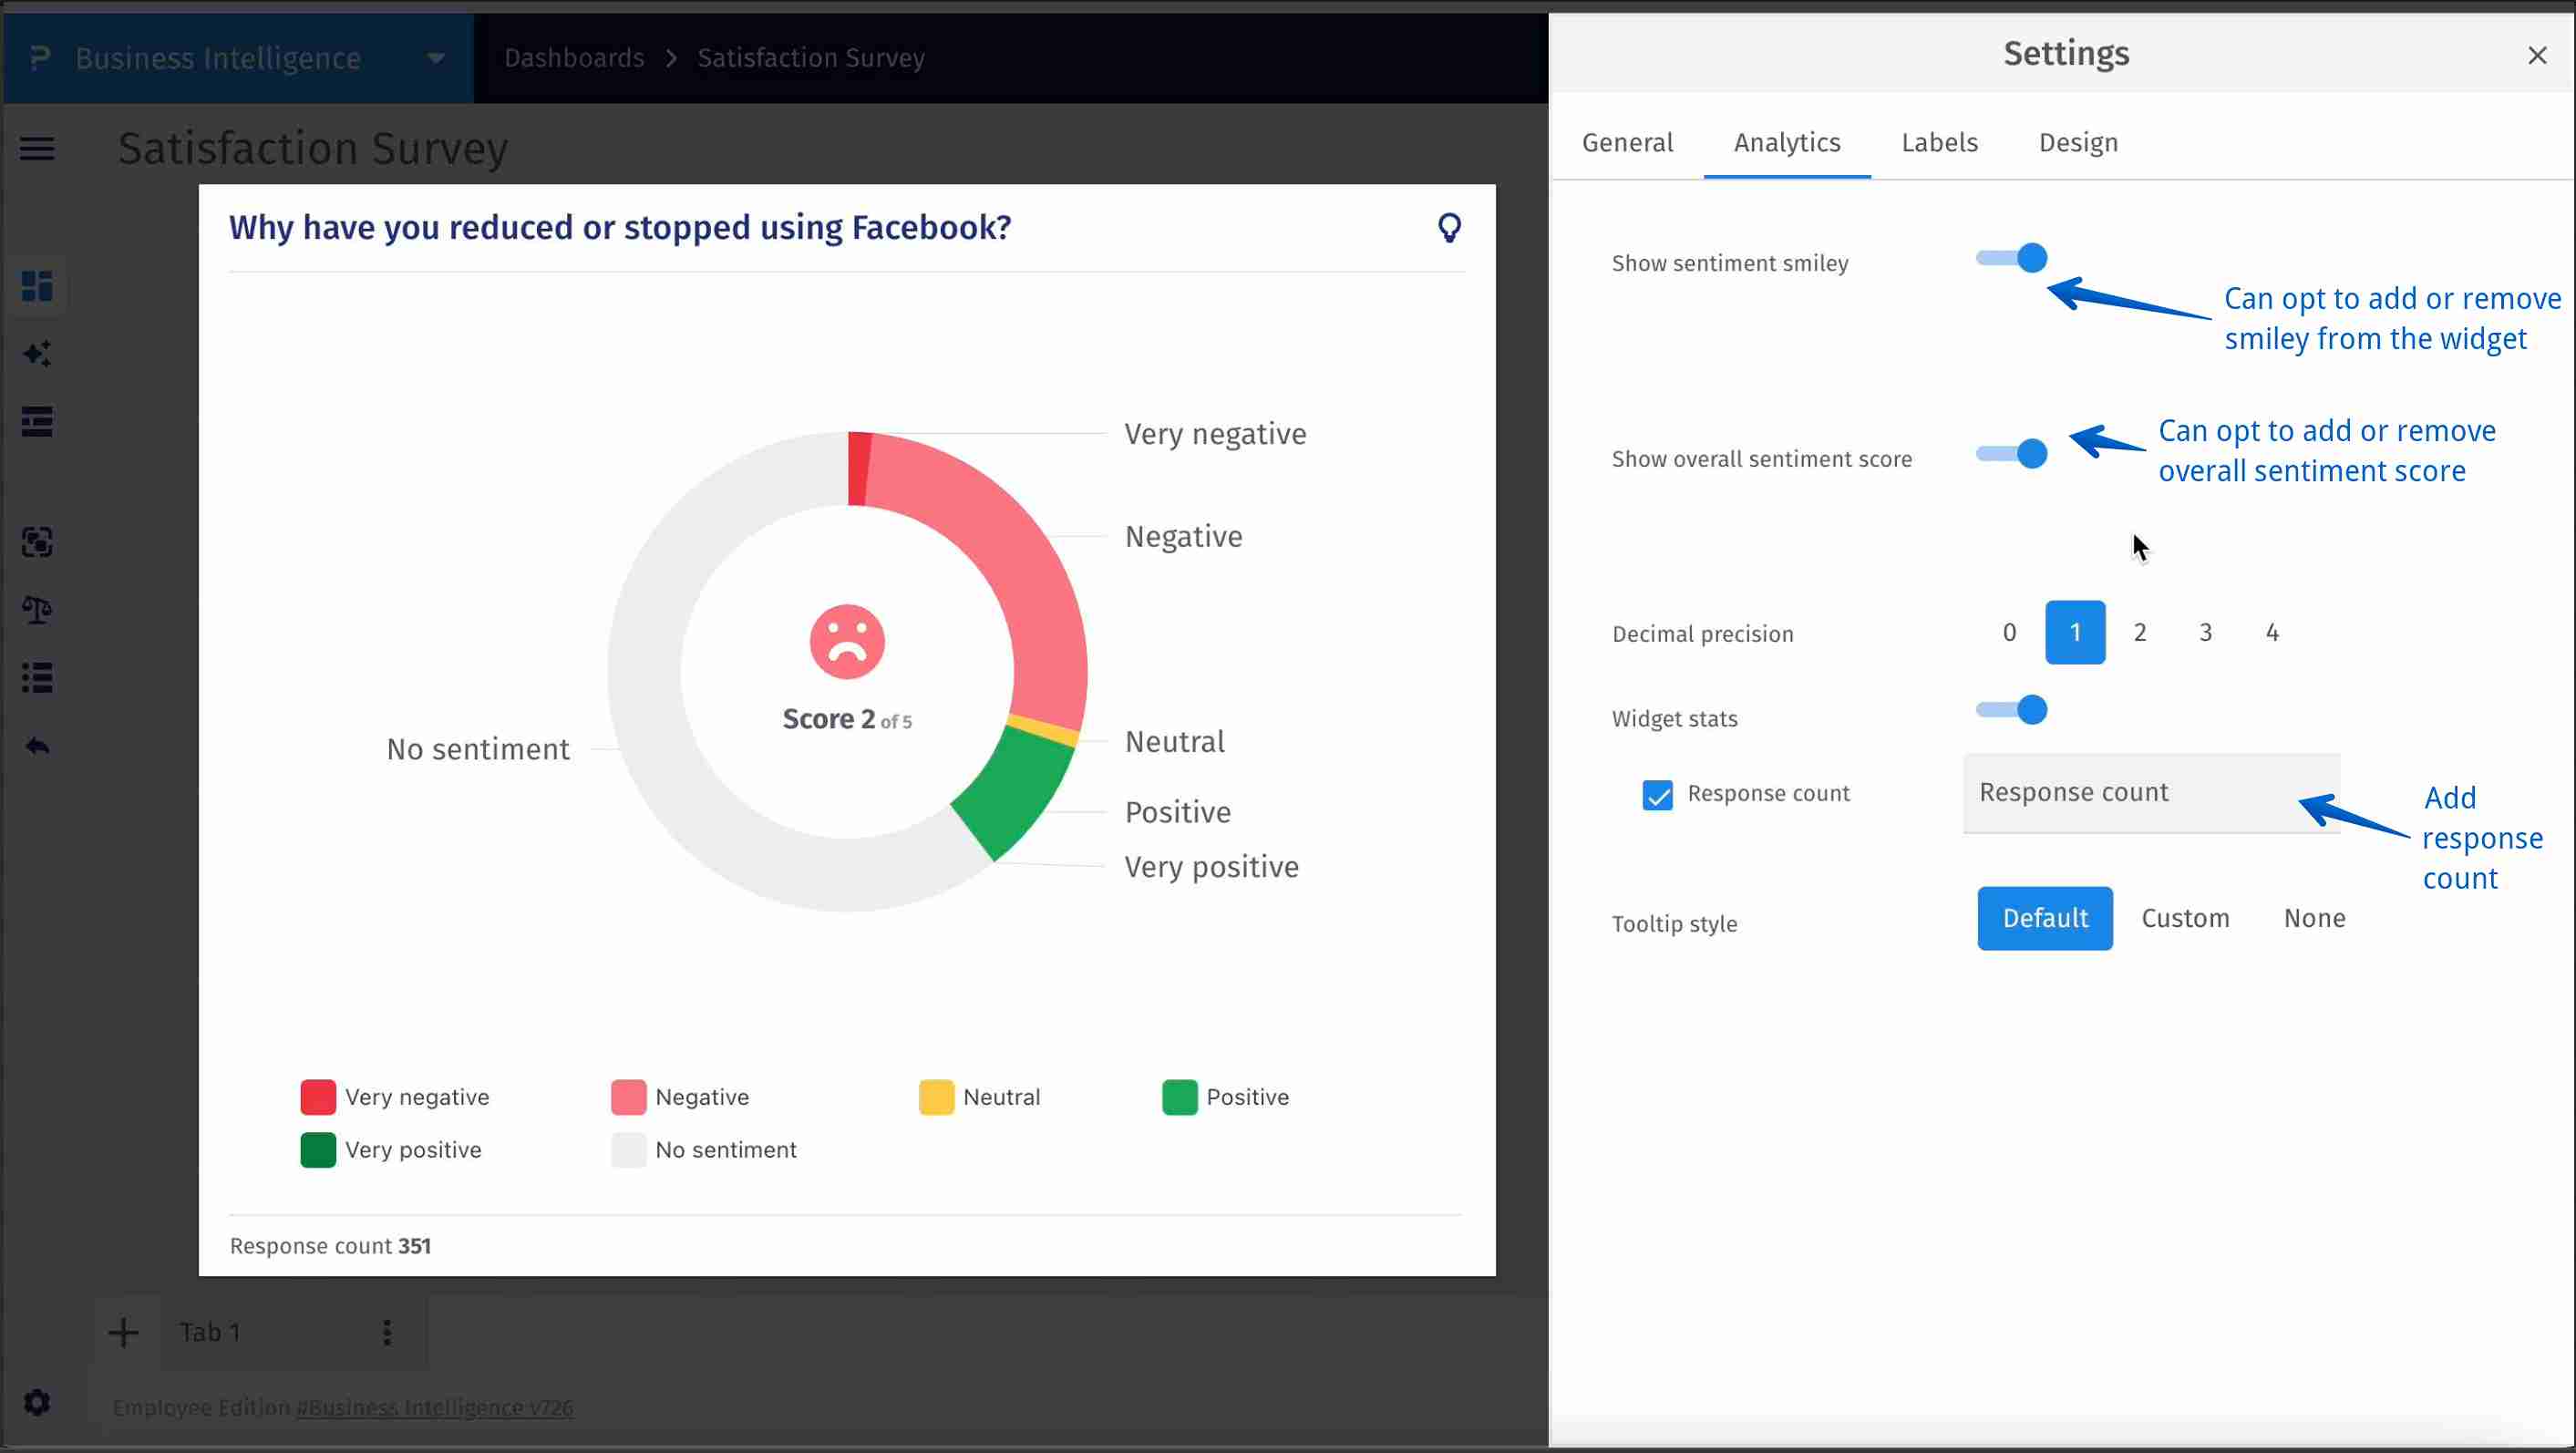
- Step 7a: Change setting > Analytics – Select to add or remove smiley form the widget, overall sentiment score or add response count
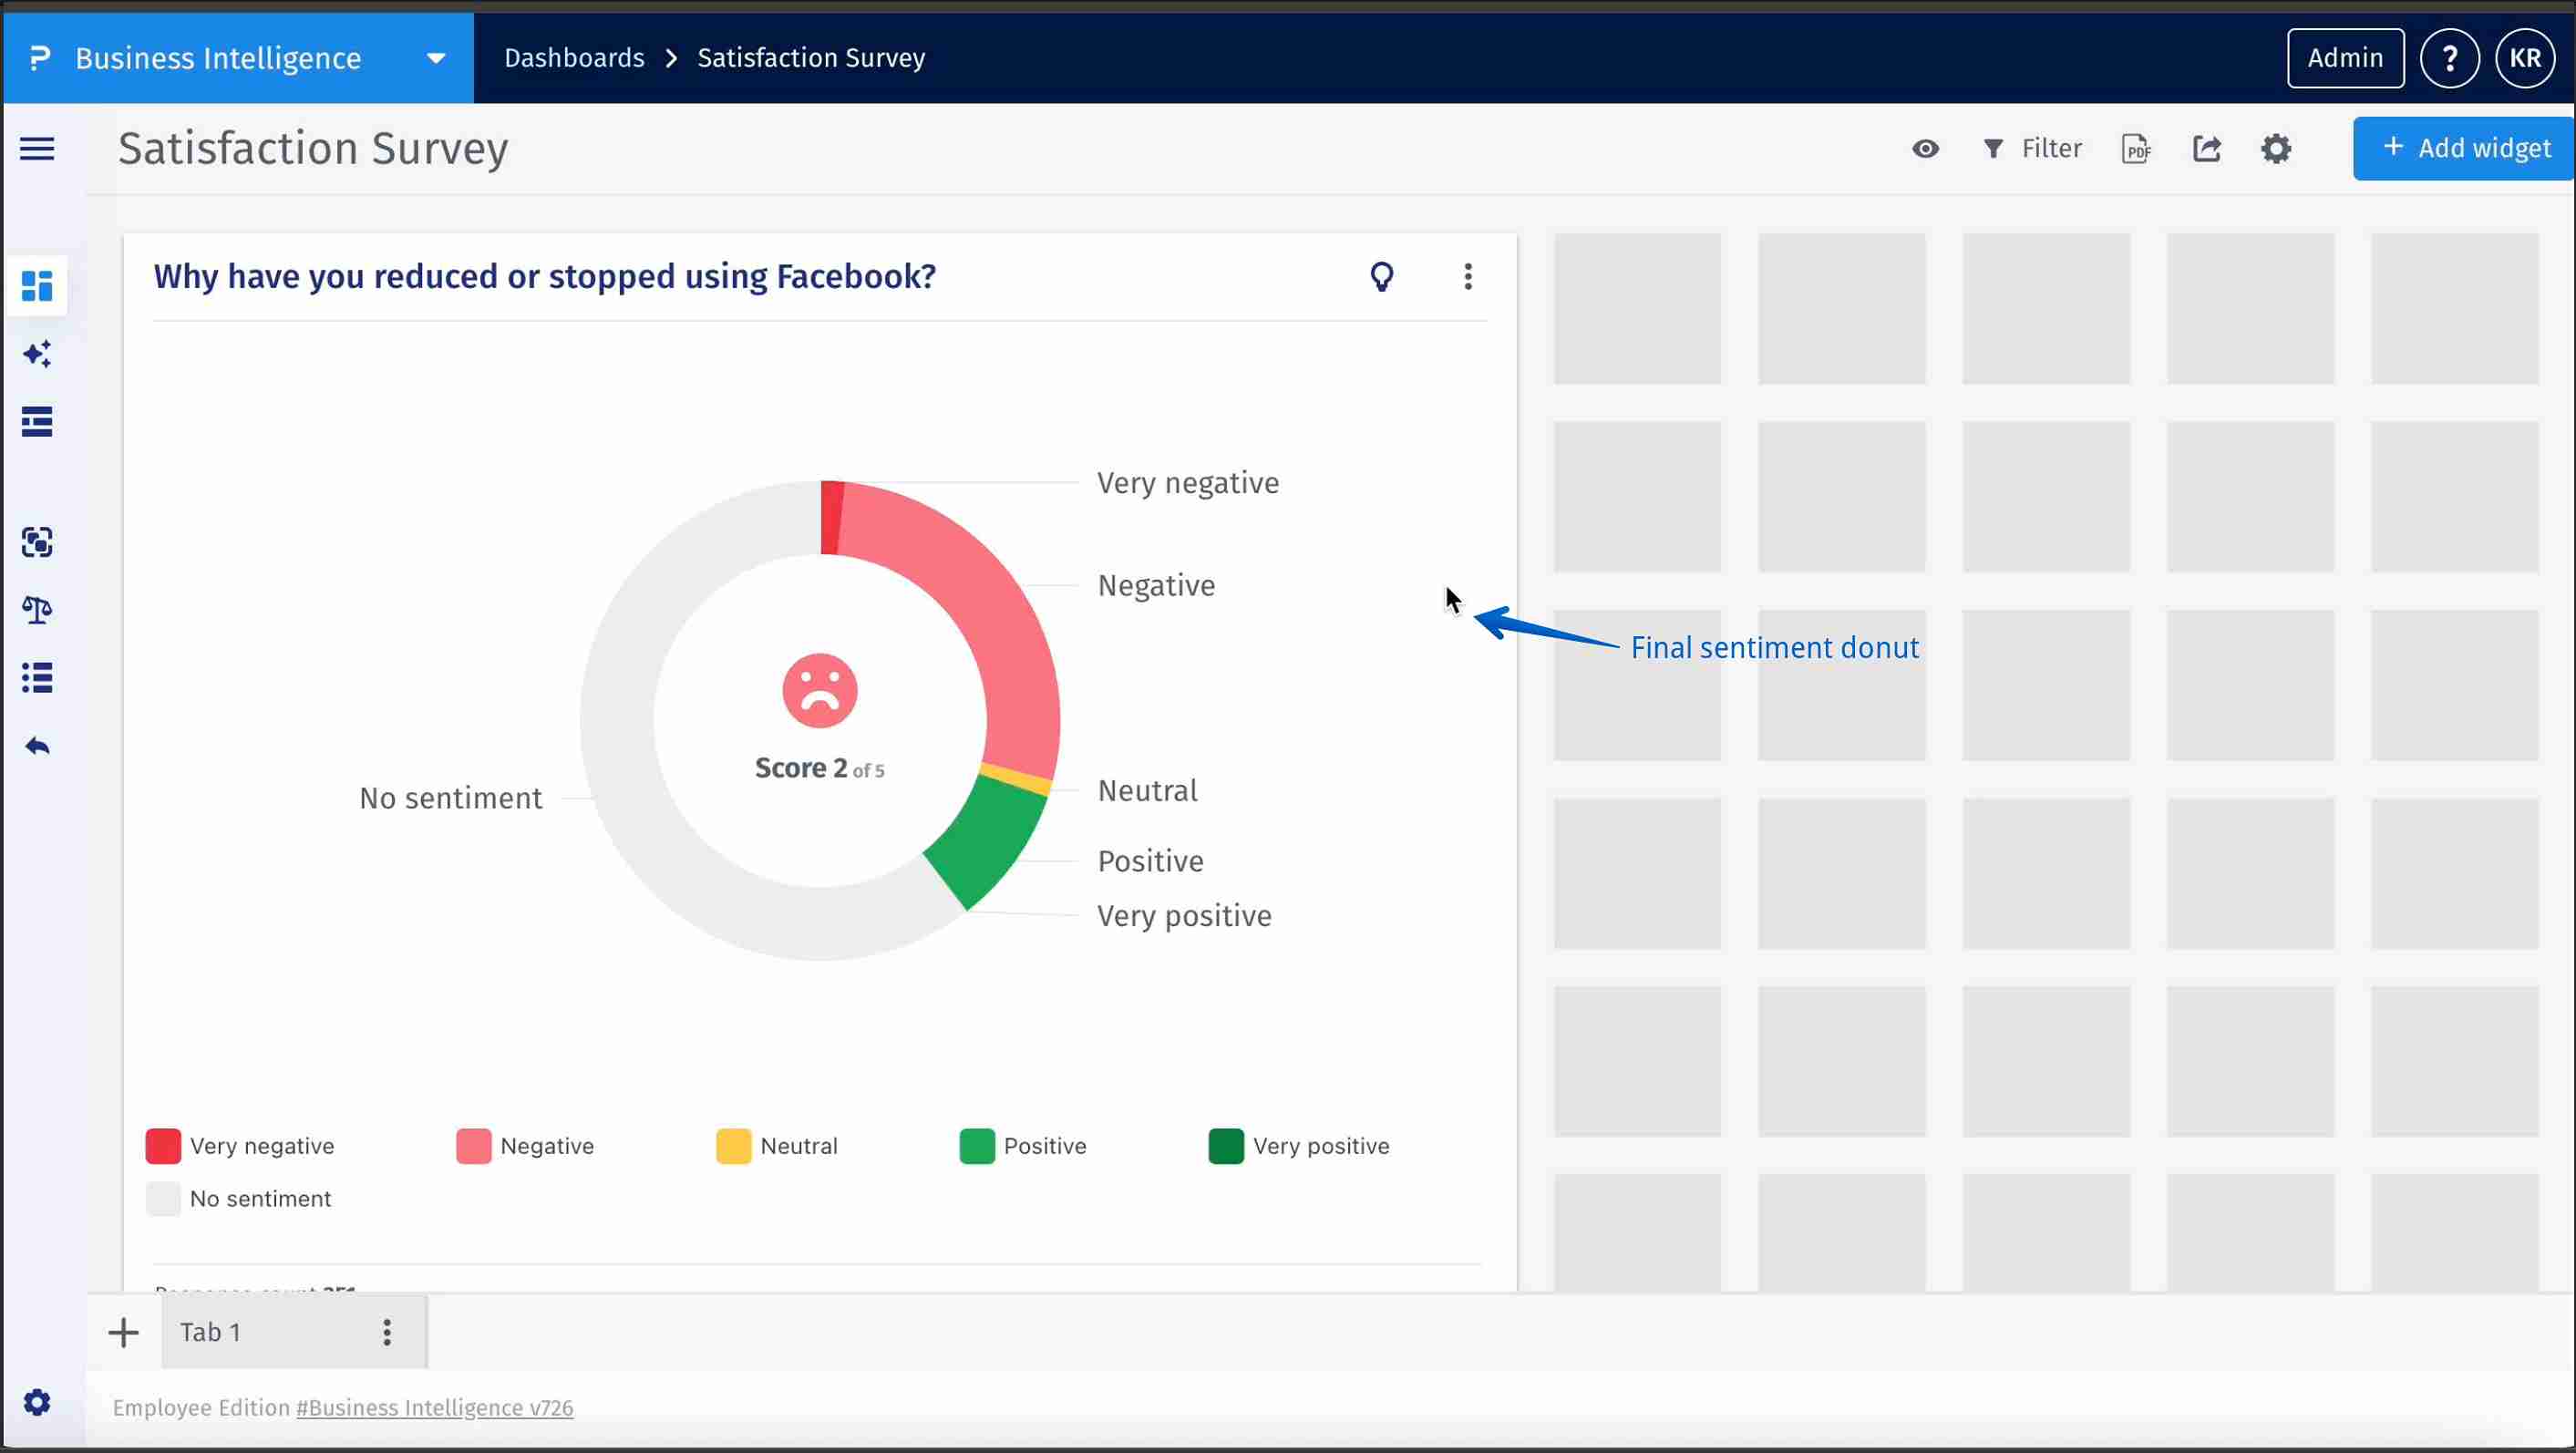
- Step 8: Final sentiment donut widget – This widget visually displays the proportion of sentiments—Very Negative, Negative, Neutral, Positive, Very Positive, or No Sentiment—derived from the analyzed text responses to a specific question, using a color-coded donut chart. It provides an at-a-glance summary of overall respondent sentiment.
- un ordered list
- Sentiment Analysis: The process of identifying and categorizing emotions in text responses, such as positive or negative tones.
- Donut Chart: A circular statistical graphic similar to a pie chart but with a blank center.
- No Sentiment: Text responses that could not be classified under any of the defined sentiment categories.
- Text Response: A participant’s written answer to an open-ended question.