


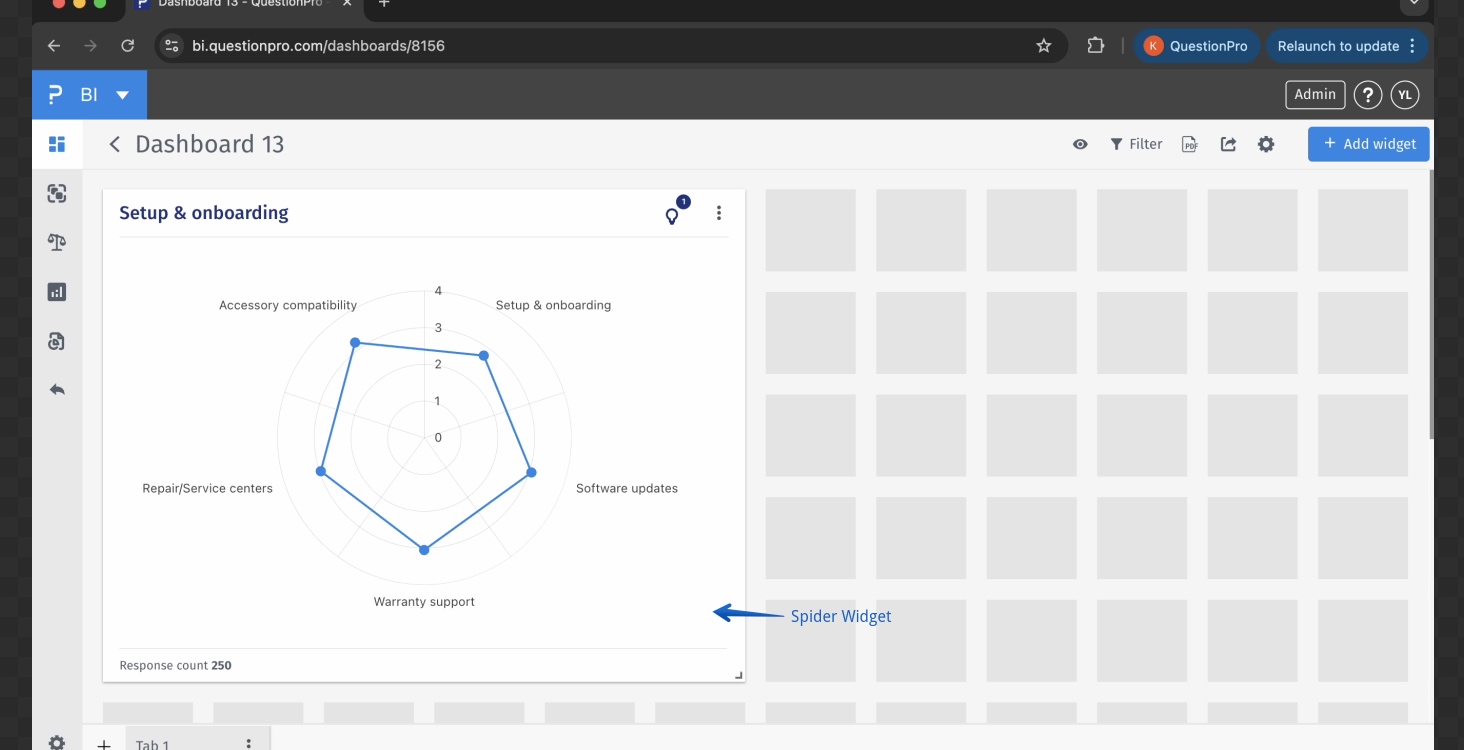
Spider Widget
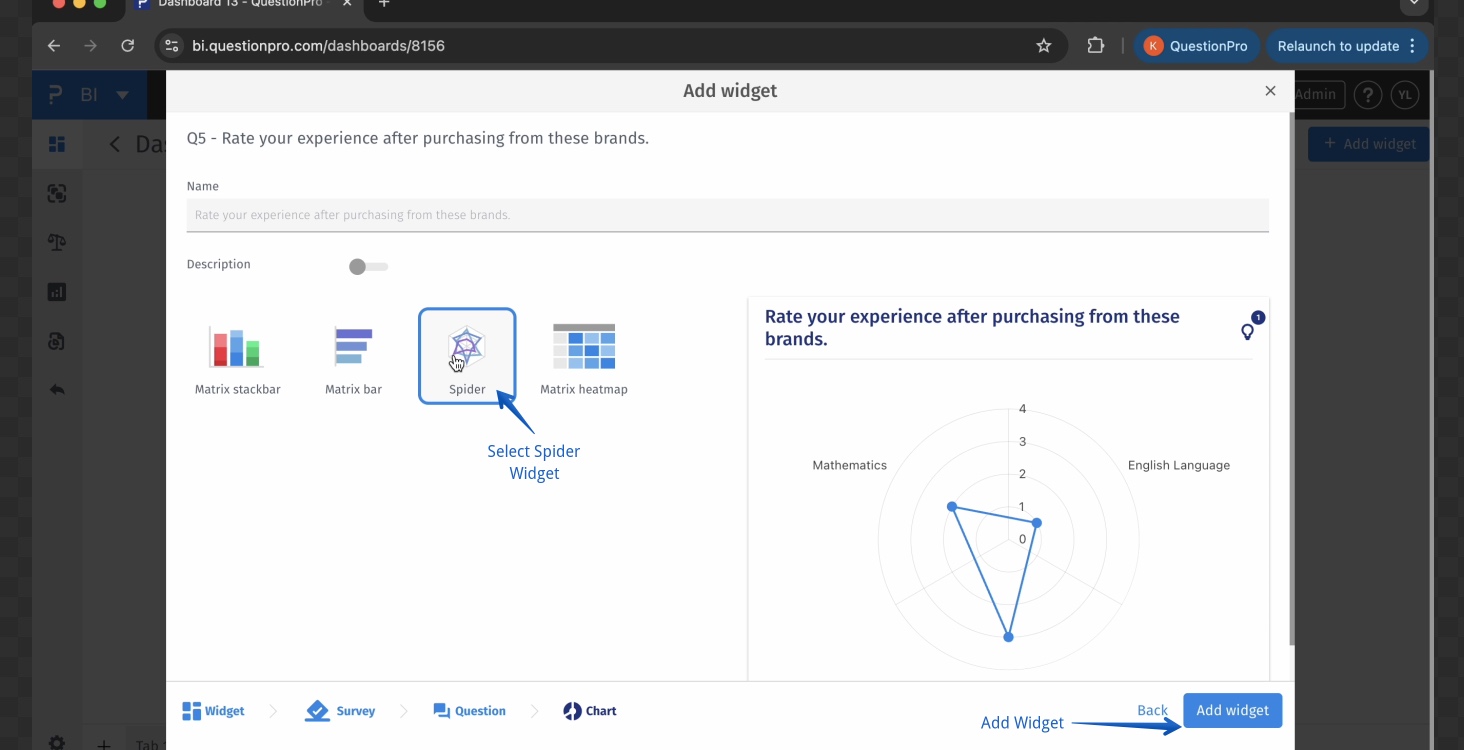
Spider Widget is a data visualization feature in the BI dashboard designed for matrix-style survey questions, where multiple attributes or statements are measured using the same response scale (such as a Likert scale, awareness, or satisfaction level). It presents data in a radial chart—also known as a radar or spider chart—allowing users to easily compare multiple attributes on a unified scale.
This feature is particularly effective for showcasing perception, performance, or sentiment across various categories, enabling quick visual assessment of strengths, weaknesses, and overall balance among attributes.
Key Capabilities of the Spider Feature:
- Matrix Question Compatibility: Each axis on the chart represents one attribute, and the plotted values show the distribution or average score across those attributes.
- Radial Comparison Visualization: Data is displayed as a closed polygon across the axes, making it easier to spot patterns, imbalances, or outliers in responses.
- Multiple Series Support: Users can overlay multiple series on the same chart—ideal for comparing data across time periods, respondent groups, or survey waves.
- Customizable Scales and Labels: Adjust response ranges and axis labels to fit different use cases, such as satisfaction, agreement, or importance.
- Compare brand perceptions across different traits (e.g., trust, value, innovation).
- Track employee satisfaction scores by department or location.
- Analyze change in customer sentiment across survey waves or after product updates.
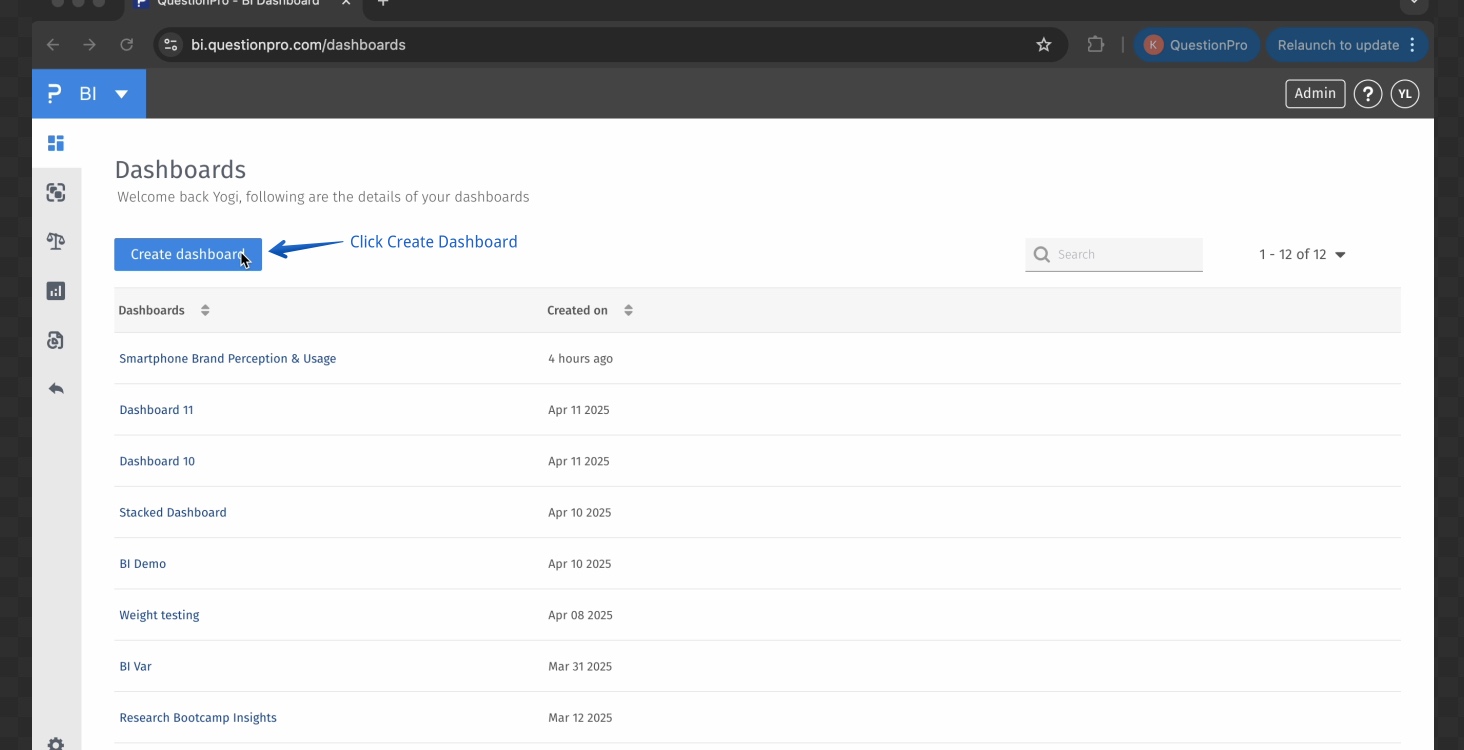
BI > Create Dashboard
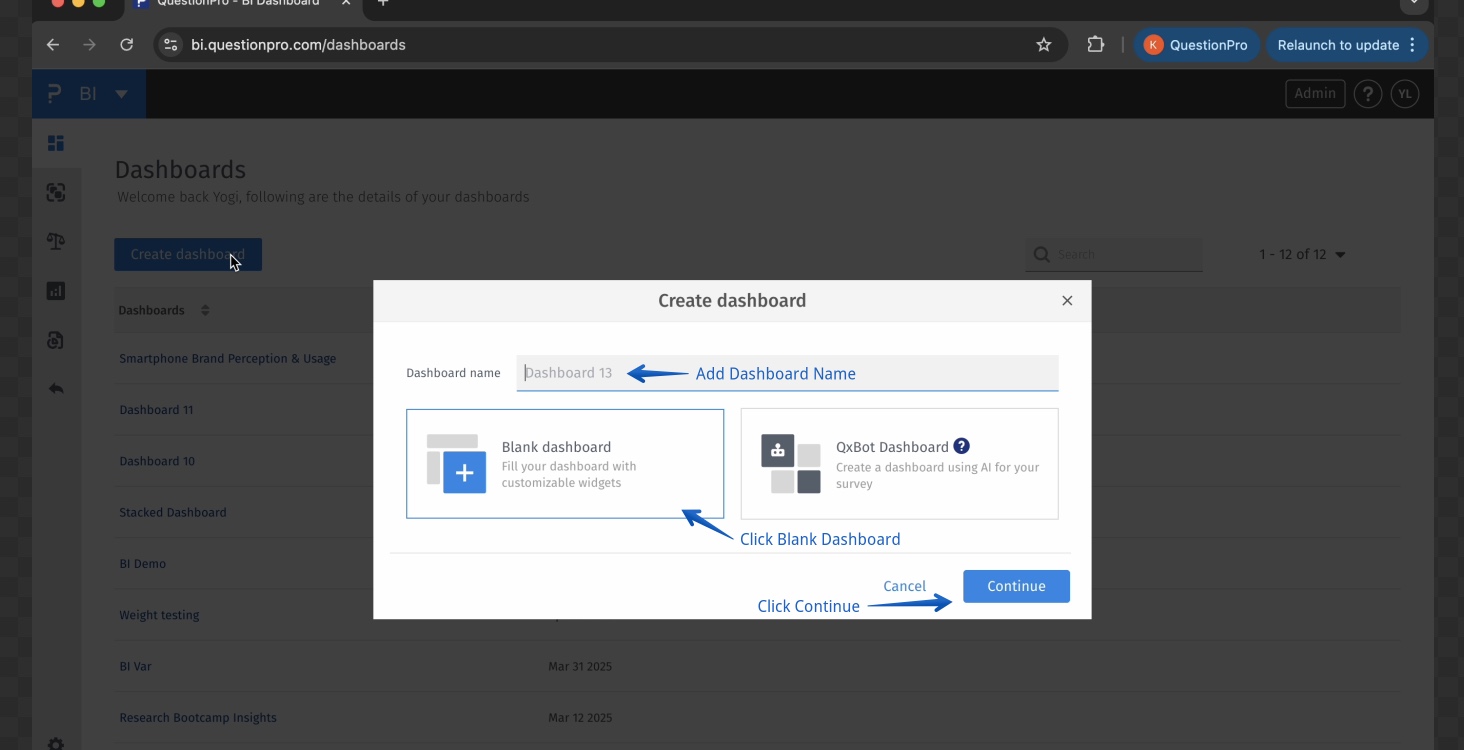
BI > Create Dashboard > Blank Dashboard
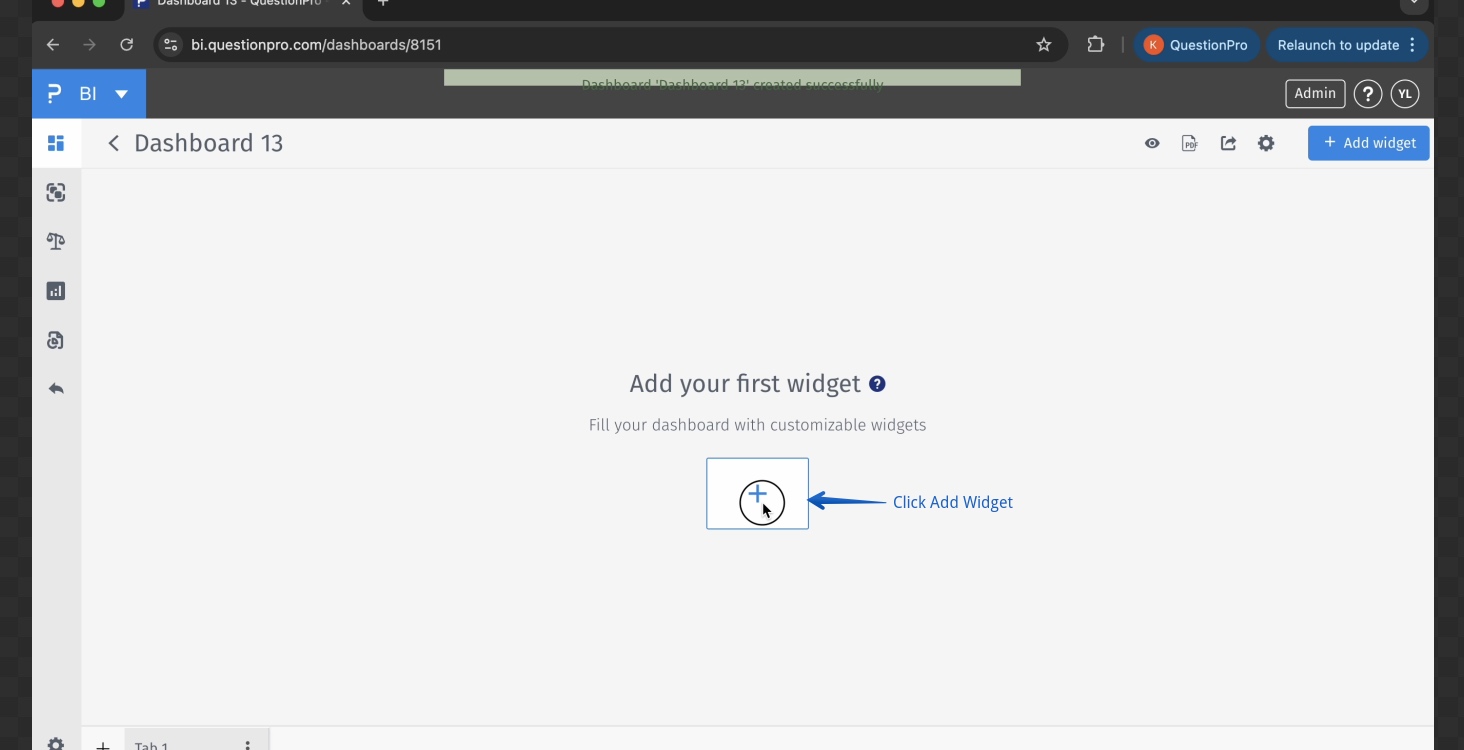
BI > Create Dashboard > Blank Dashboard > Add Widget
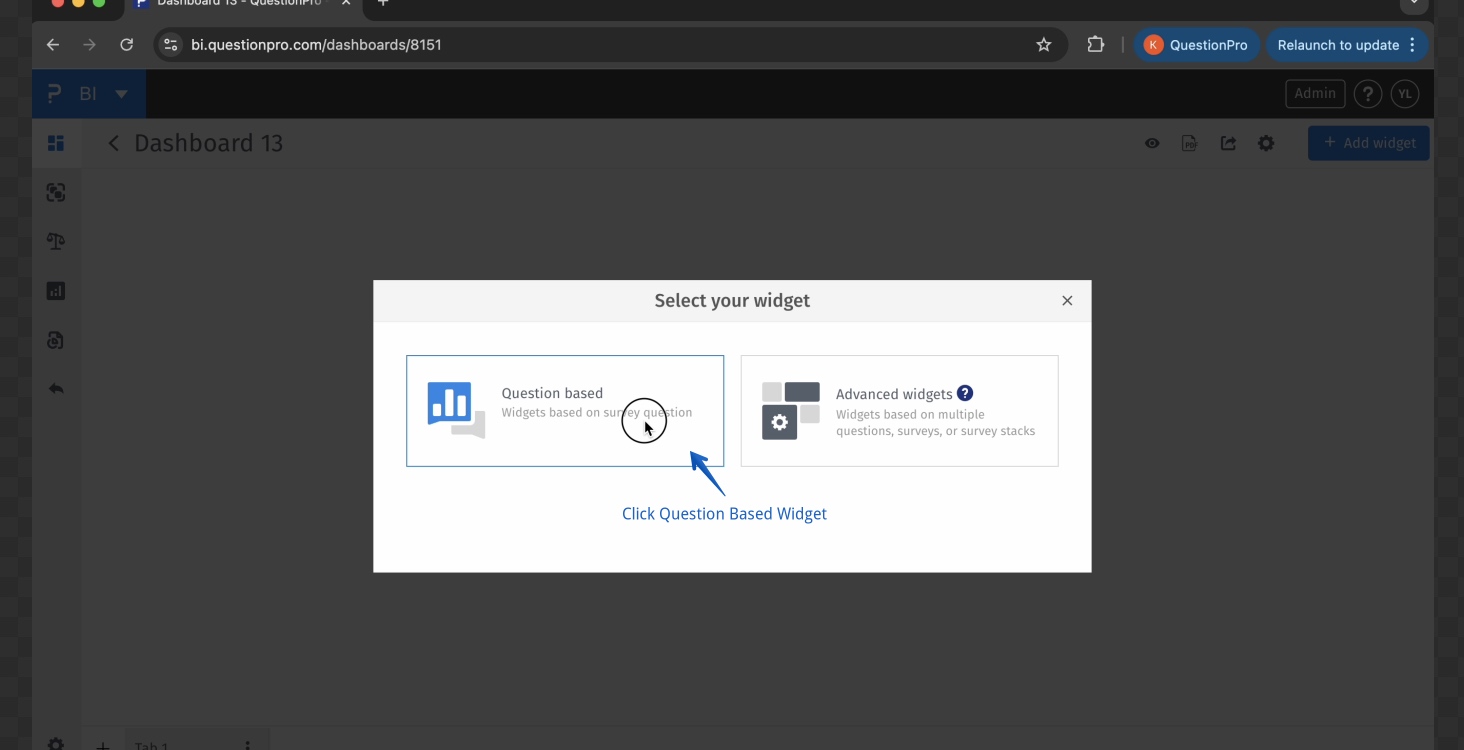
BI > Create Dashboard > Blank Dashboard > Add Widget > Question Based
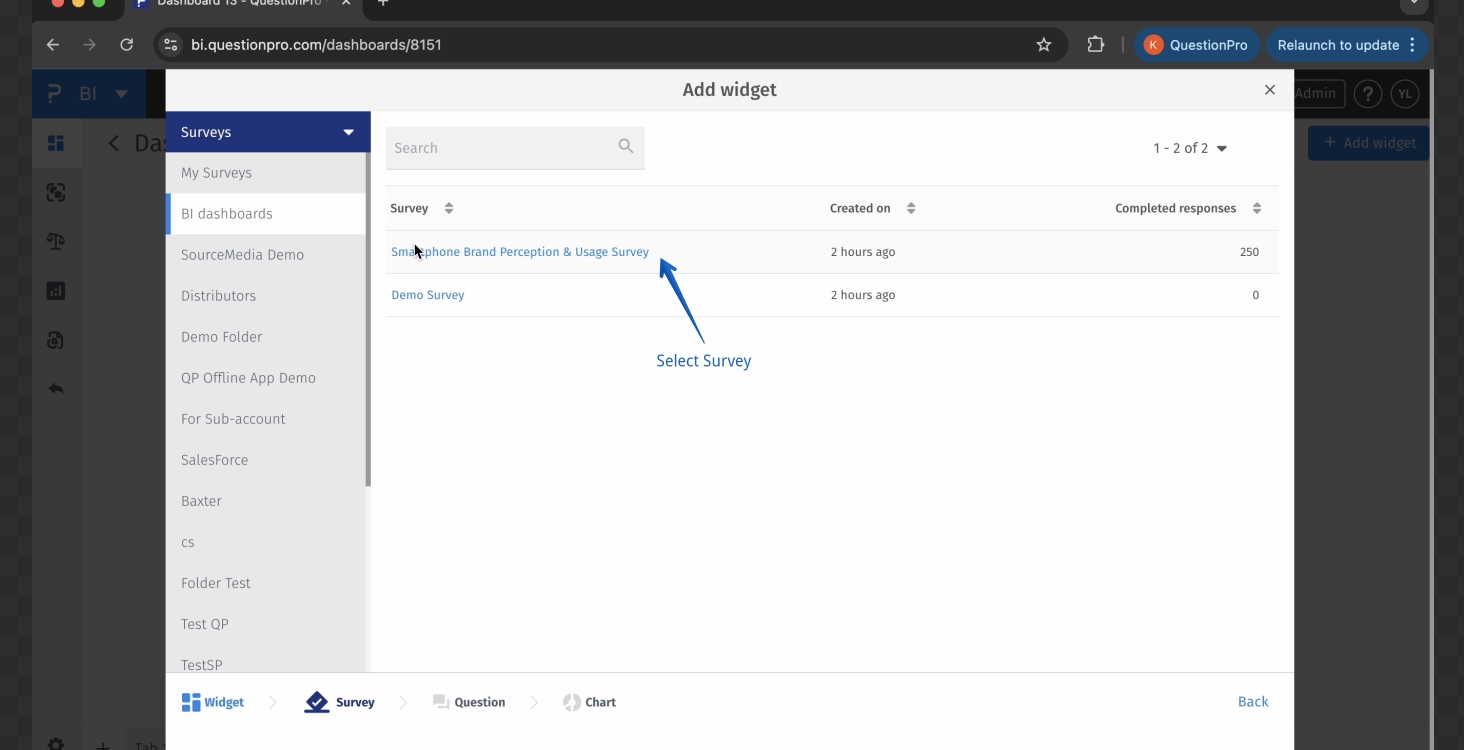
BI > Create Dashboard > Blank Dashboard > Add Widget > Question Based > Select Survey
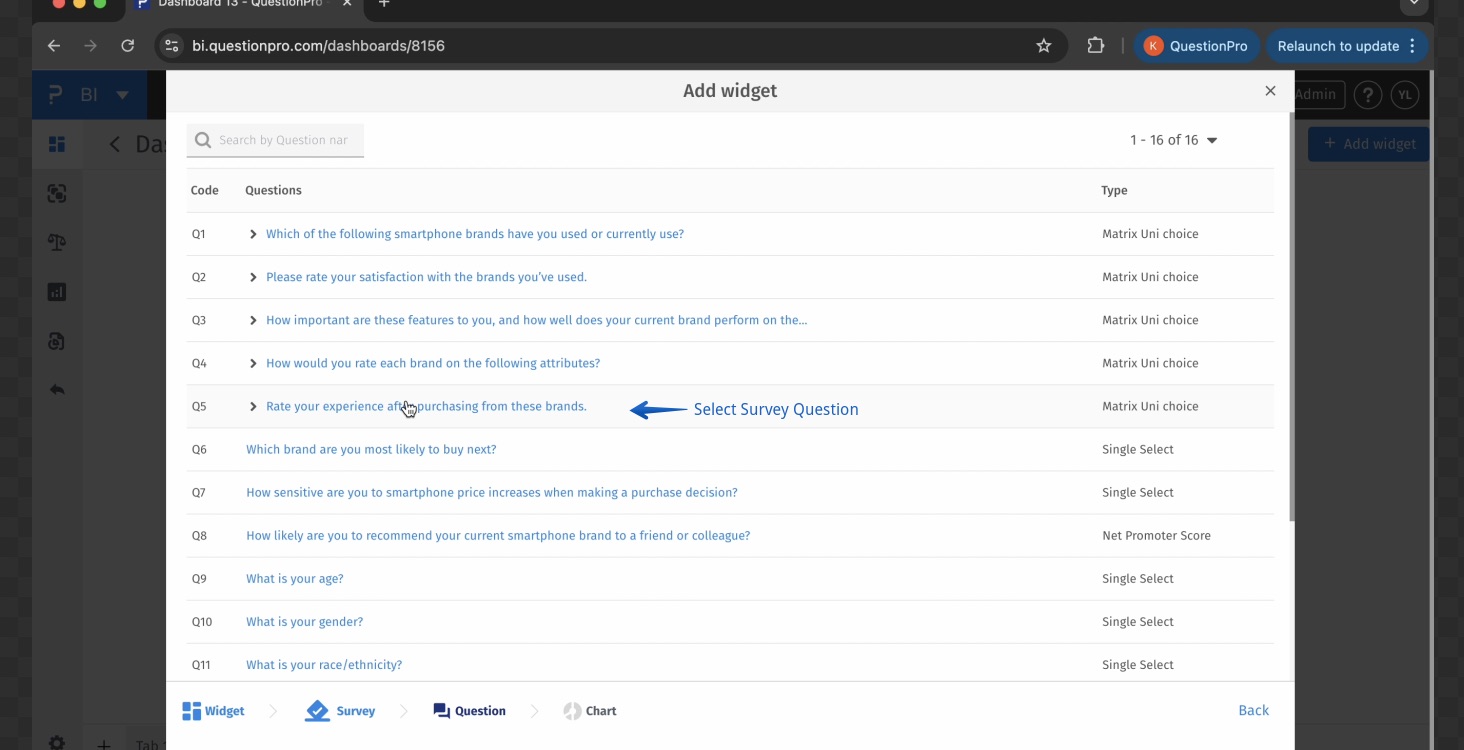
BI > Create Dashboard > Blank Dashboard > Add Widget > Question Based > Select Survey > Select Survey Question (Type - Matrix)
BI > Create Dashboard > Blank Dashboard > Add Widget > Question Based > Select Survey > Select Survey Question (Type - Matrix) > Spider Widget
BI > Spider Widget
- Matrix Question: A survey format where multiple attributes are rated on the same response scale.
- Spider Chart / Radar Chart: A graphical method of displaying multivariate data using axes starting from the same point.
- Attribute: A specific trait, statement, or item being evaluated in a matrix question.
- Likert Scale: A type of rating scale used to represent levels of agreement, frequency, importance, etc.
- Series: A group of related data points plotted on the same chart for comparison (e.g., Wave 1 vs. Wave 2).