


Stat Highlight
The Stat Highlight widget allows you to create a single-value statistics widget to display key survey metrics such as Net Promoter Score (NPS), Customer Effort Score (CES), Customer Satisfaction Score (CSAT), Mean, and Mean Percentage.
This widget is designed to surface important performance indicators at a glance, making it ideal for dashboards focused on high-level insights and quick interpretation.
To use the Stat Highlight widget, add it as a standard question-based widget to a BI dashboard, select a data source, and configure the desired scoring model and display settings.
Watch this video for a quick overview of the Stat Highlight widget in BI:
Click to download the video
-
Single-Value Metric Display
Displays a single calculated statistic derived from survey responses to highlight key performance indicators. -
Support for Standard Scoring Models
Supports commonly used customer experience metrics such as NPS, CES, CSAT, Mean, and Mean Percentage. -
Custom Scoring Configuration
Allows mapping of answer options to scoring categories based on the selected scoring model. -
Flexible Number Formatting
Provides options to control decimal precision, number formats, prefixes, suffixes, and value labels. -
Filter-Aware Calculations
Dynamically updates the displayed value based on applied dashboard or widget-level filters.
Common Tasks:
- Highlight key customer experience metrics such as NPS, CES, or CSAT.
- Display average or percentage-based scores for survey questions.
- Apply custom scoring logic to categorical response options.
- Add contextual labels, prefixes, or suffixes to improve clarity.
- Control how filters impact the displayed statistic.
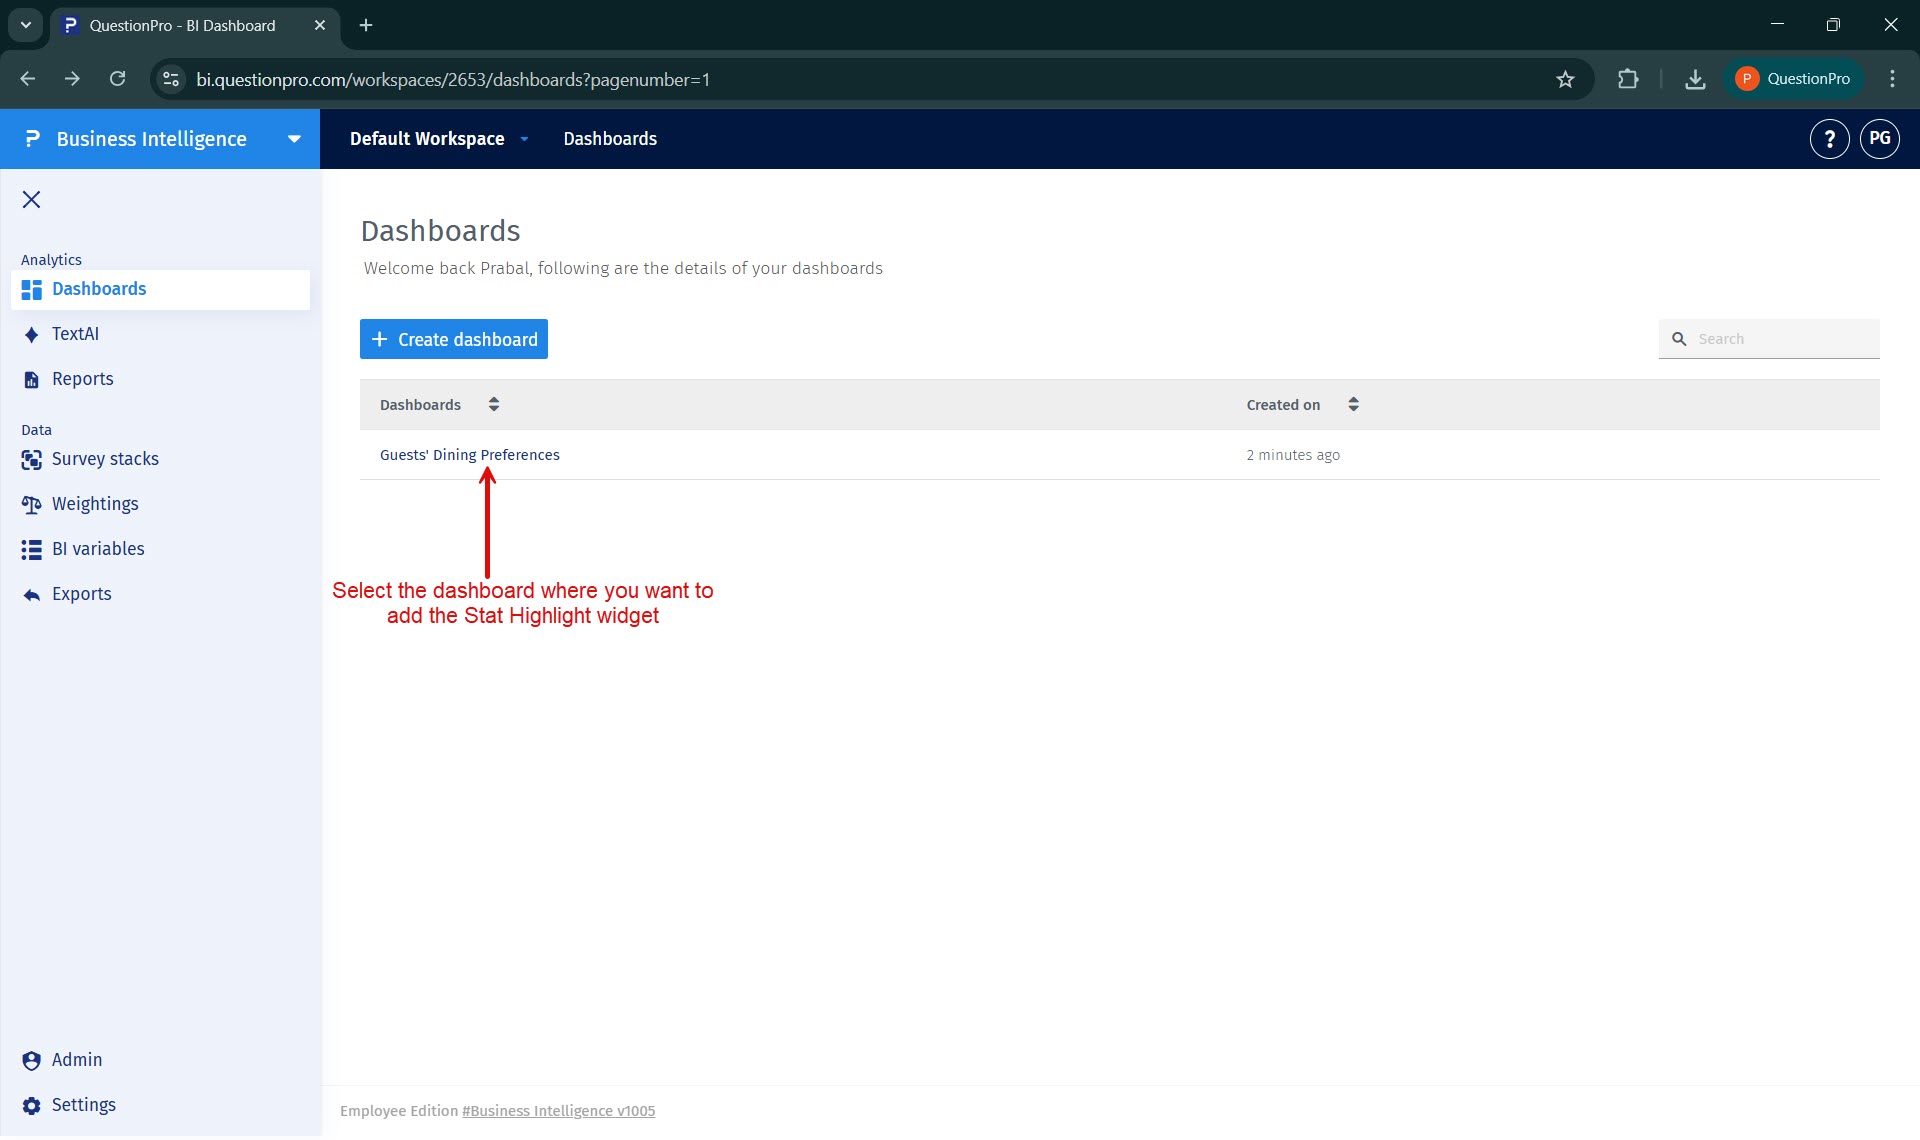
Step 1: Select the dashboard where the widget will be added.
Navigate to BI and select the dashboard from the dashboard list where you want to add the Stat Highlight widget.
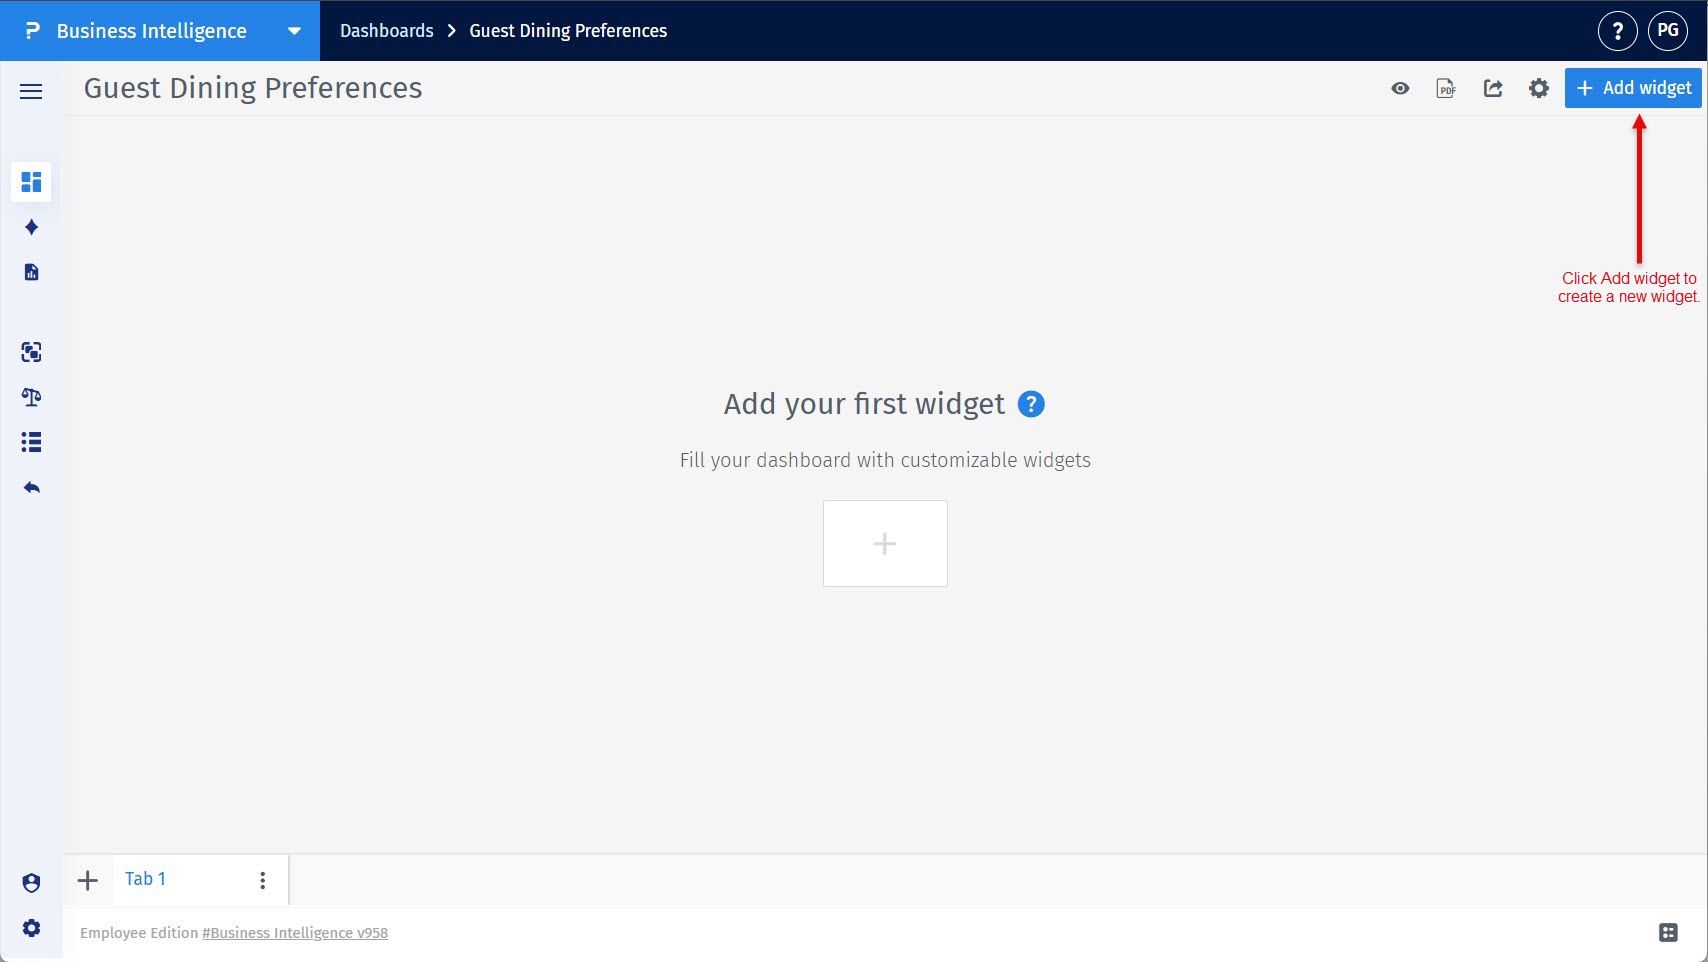
Step 2: Start adding a new widget to the dashboard.
On the selected dashboard, click the Add widget button located in the top-right area of the screen.
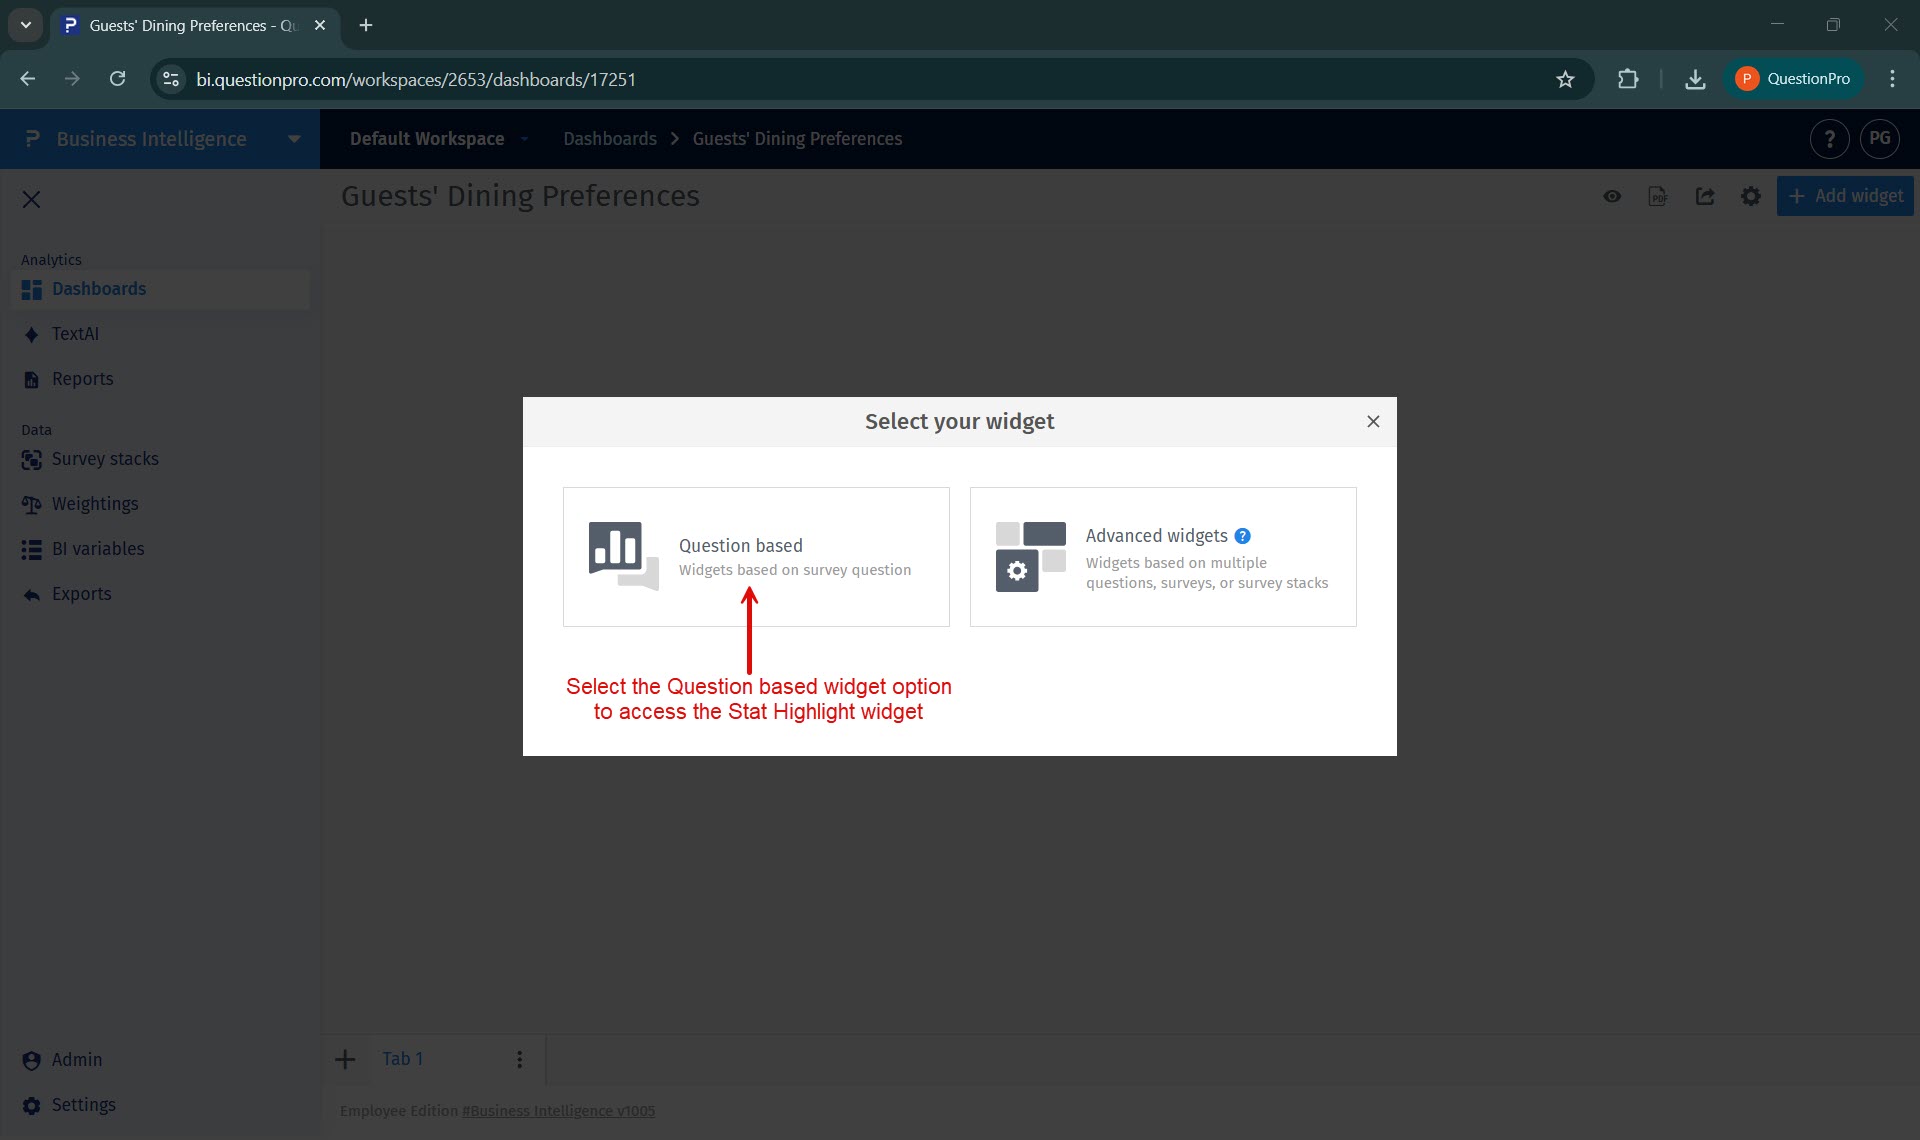
Step 3: Select question based widget type.
Stat Highlight is part of the standard question-based widgets available in BI.
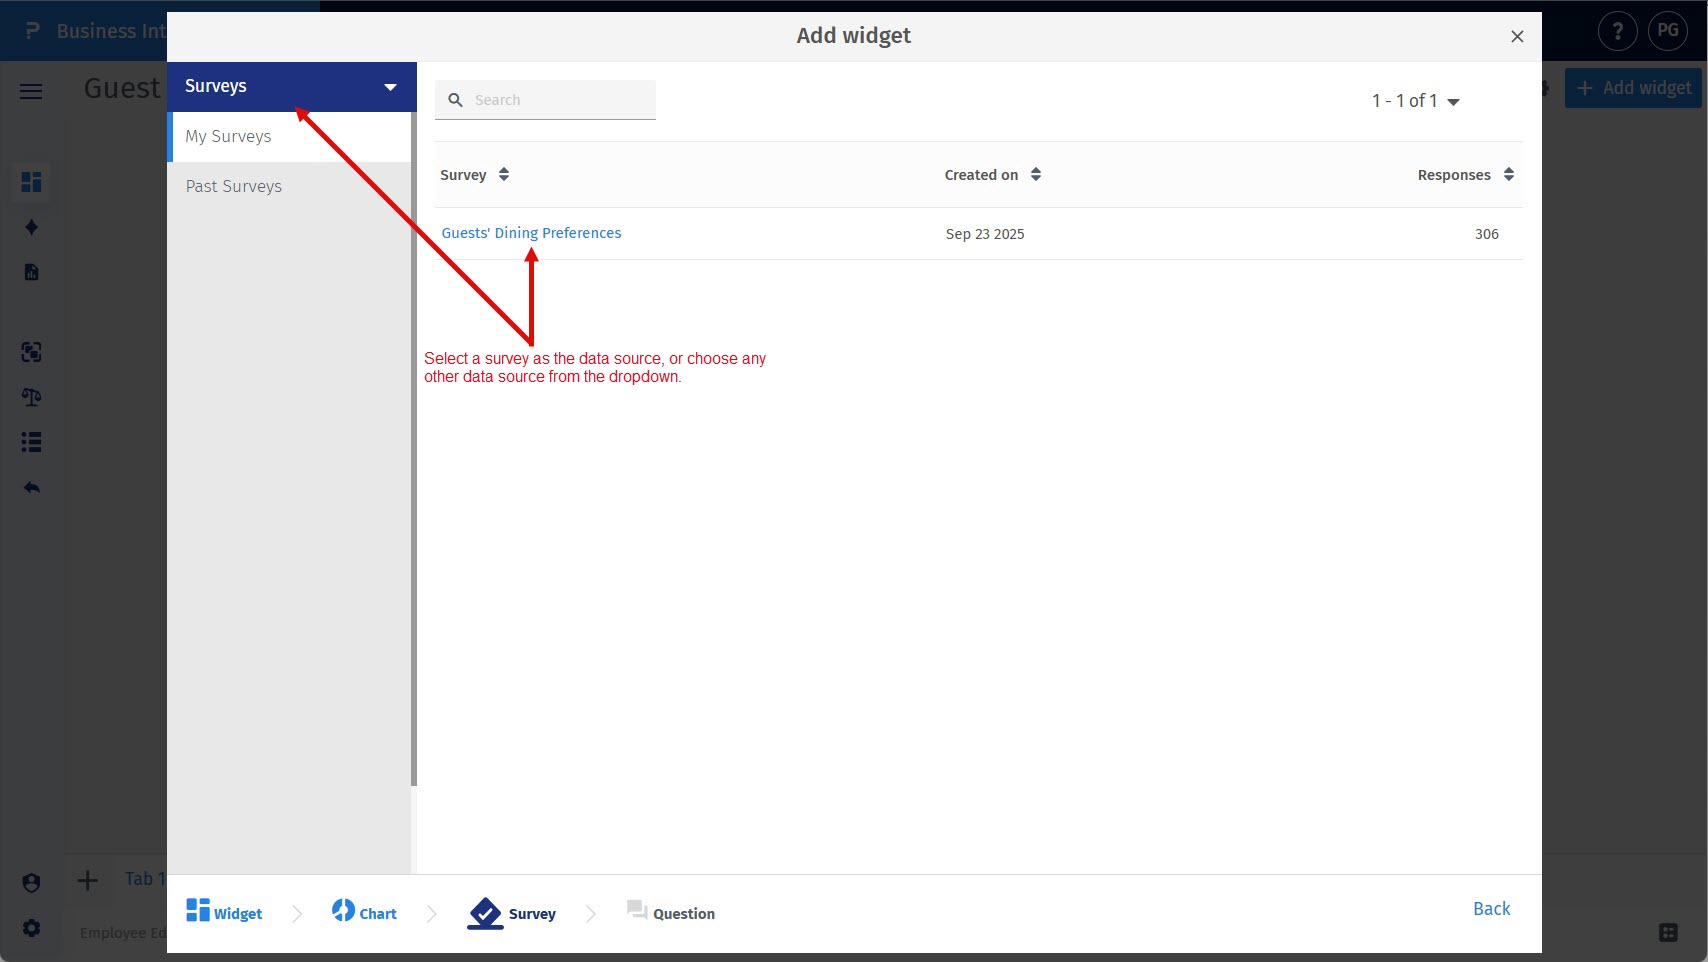
Step 4: Select the data source.
Choose the data source for which you want to create the Stat Highlight widget.
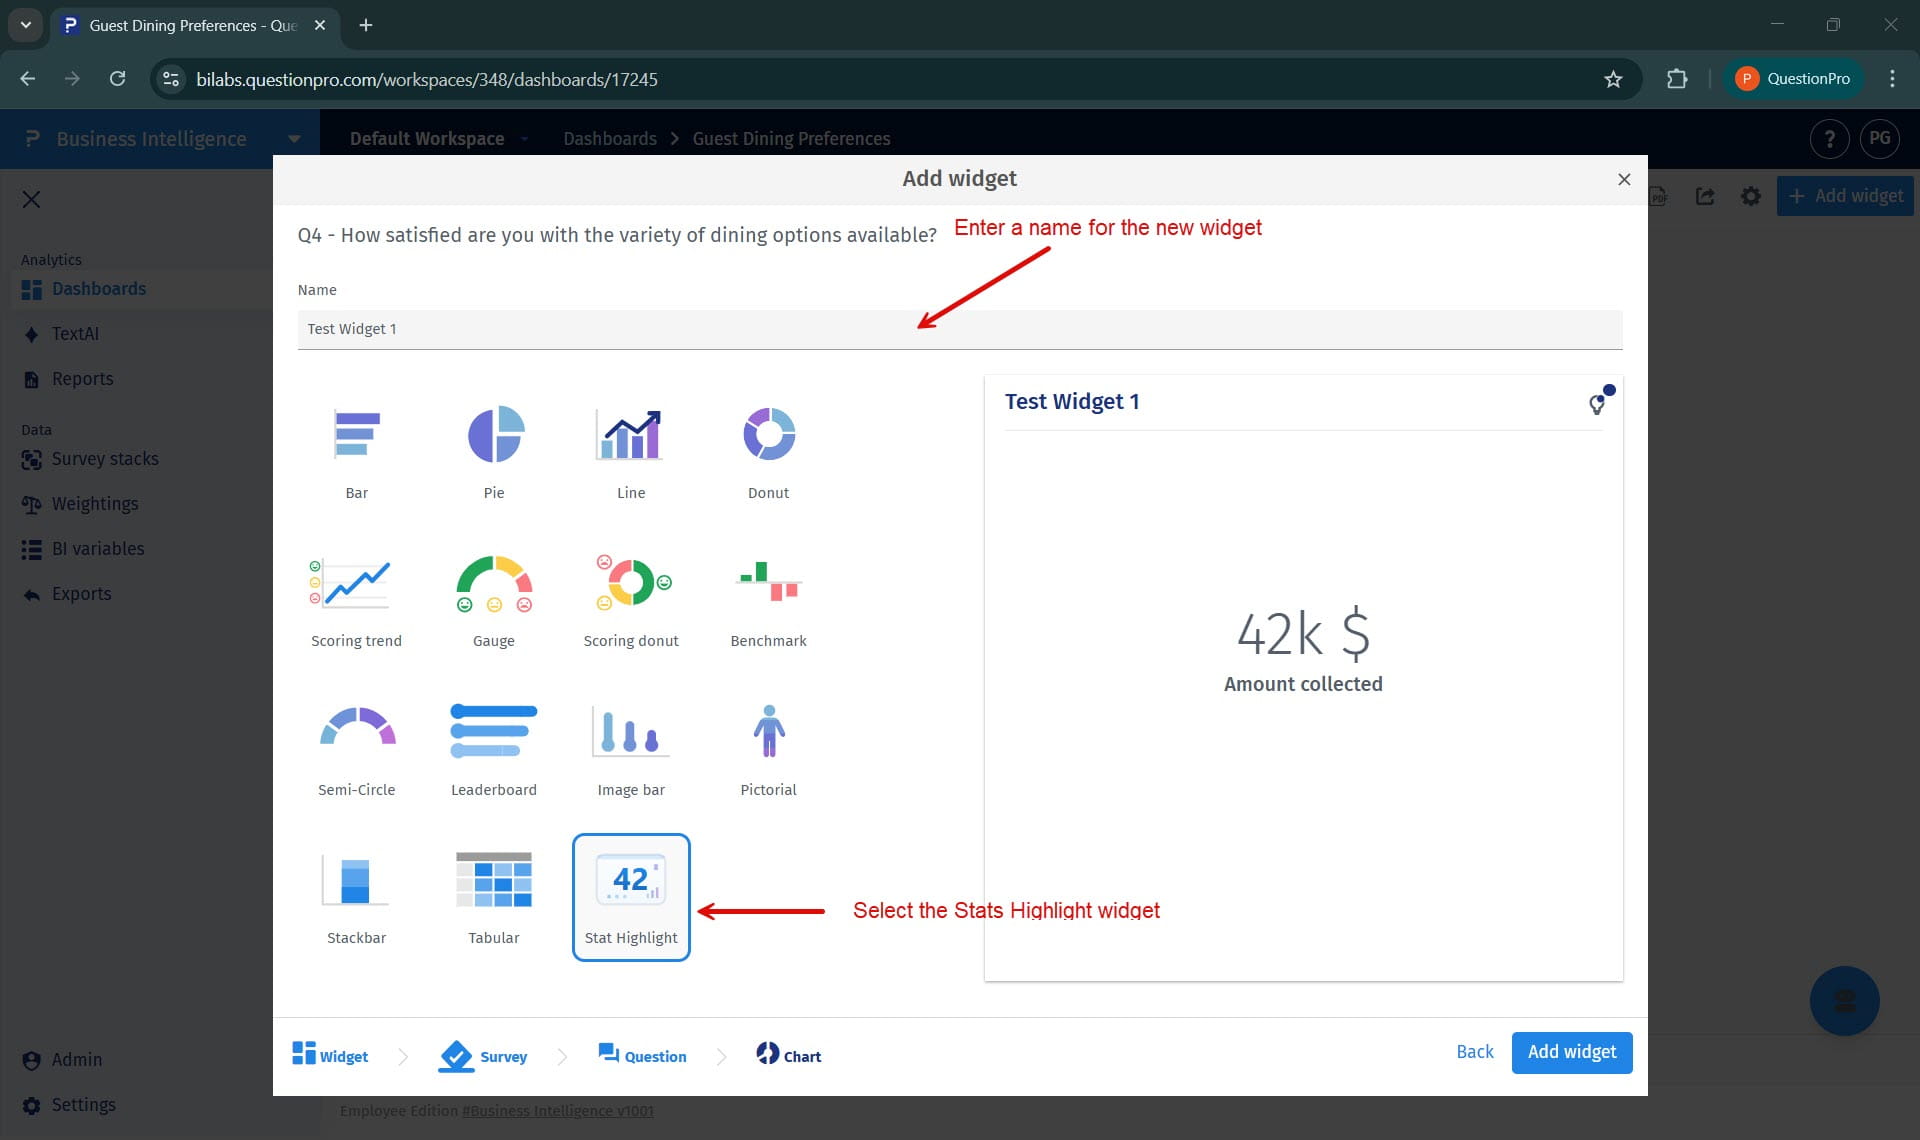
Step 5: Select Stat Highlight and provide a widget name.
From the widget list, select Stat Highlight and enter a name for the widget in the provided name field.
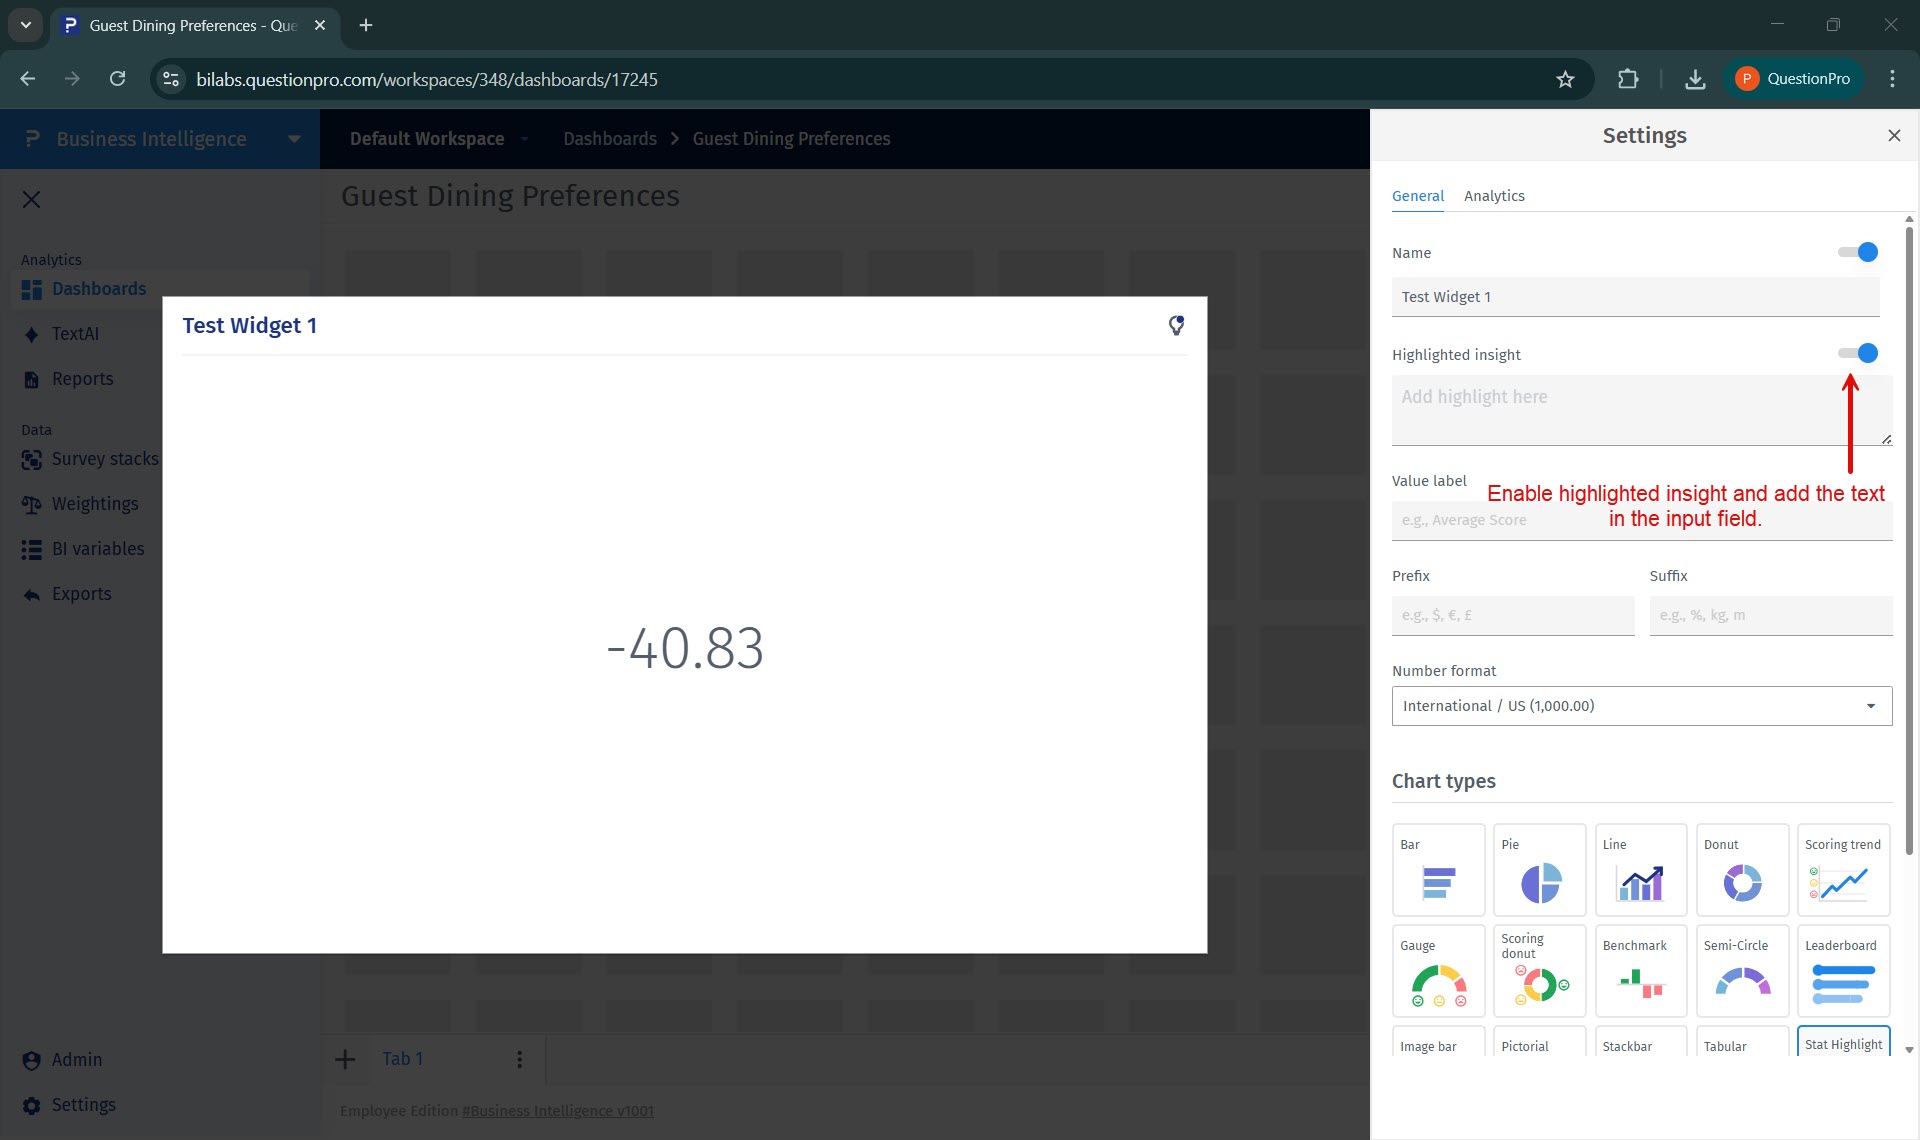
How to add a highlighted insight to the Stat Highlight widget?
Enable the highlighted insight option in the General tab and enter your message in the provided input field to display a short explanatory text above the value.
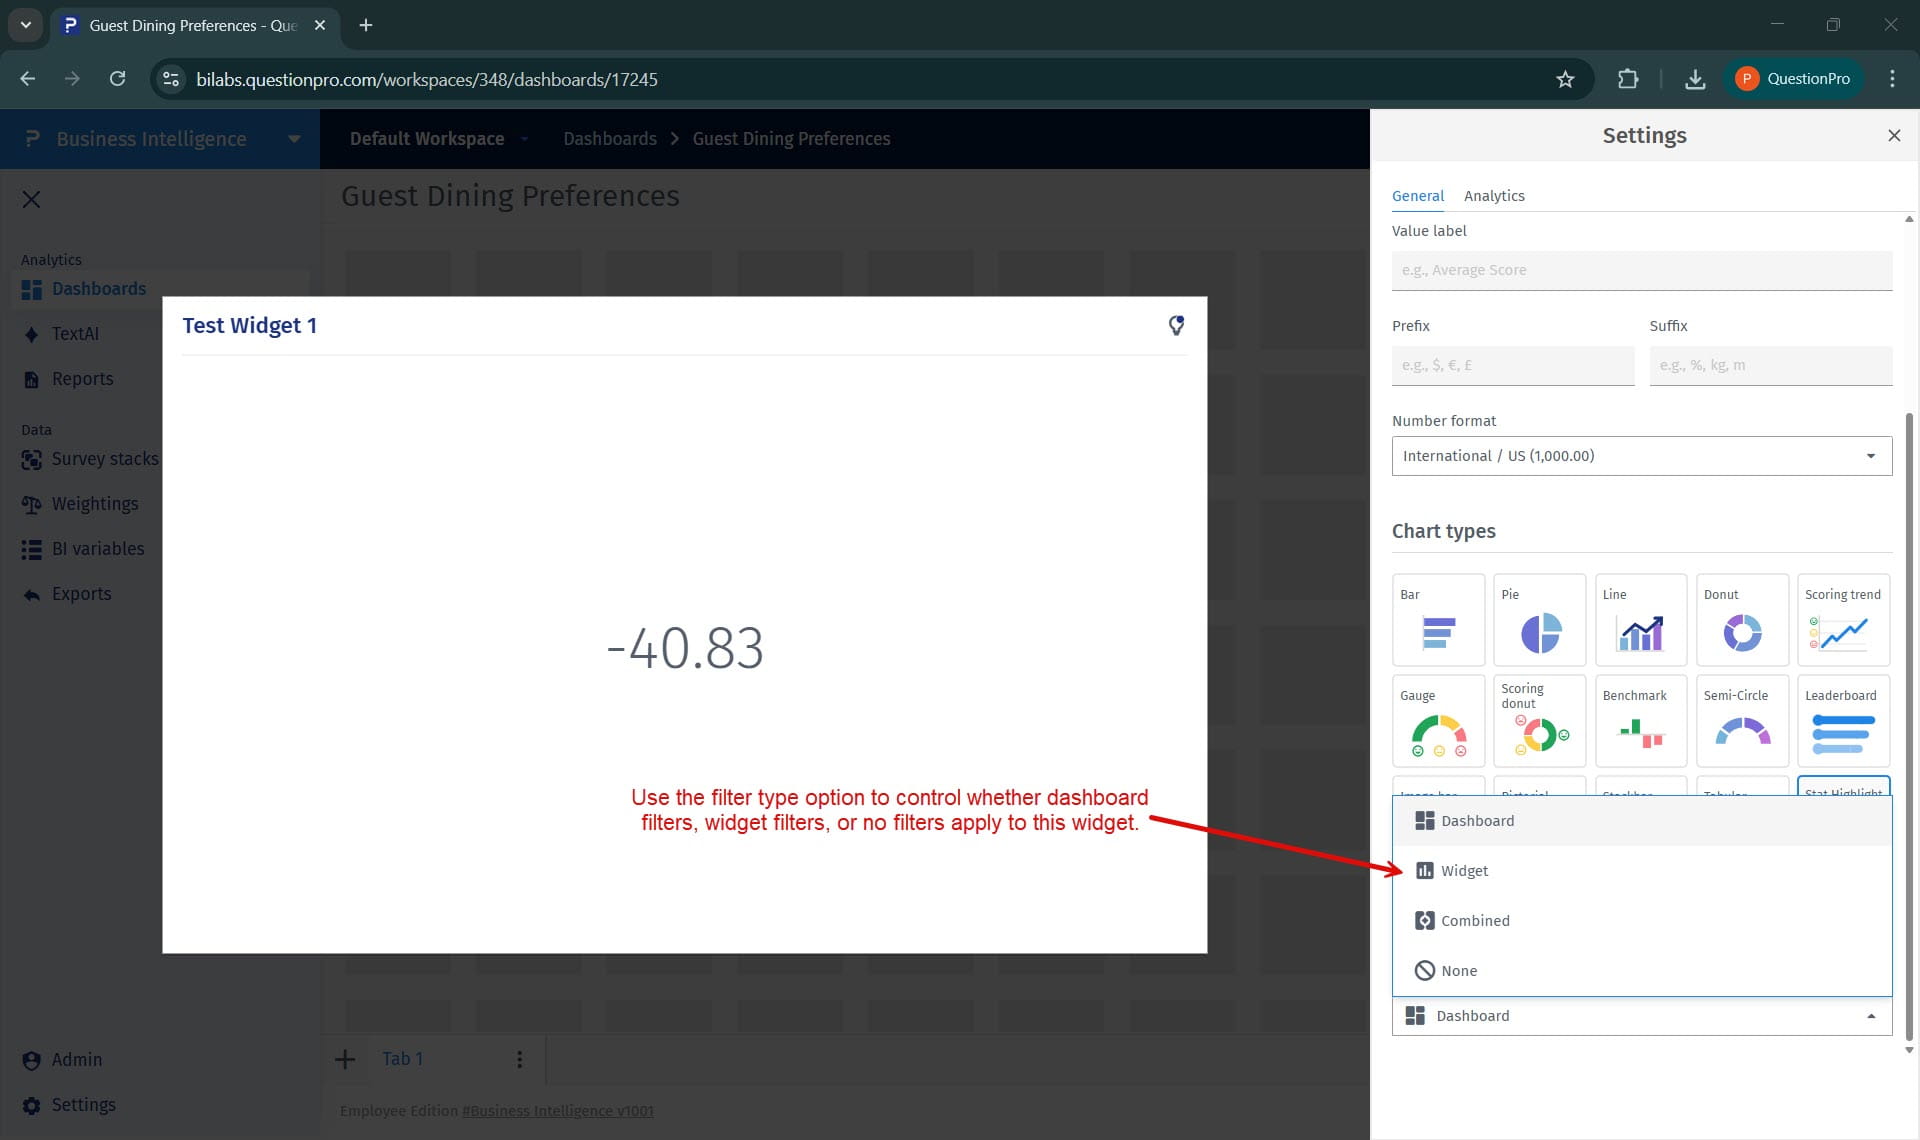
How to control how filters apply to the Stat Highlight widget?
Use the filter options in the General tab to decide whether dashboard filters, widget filters, or no filters should apply.
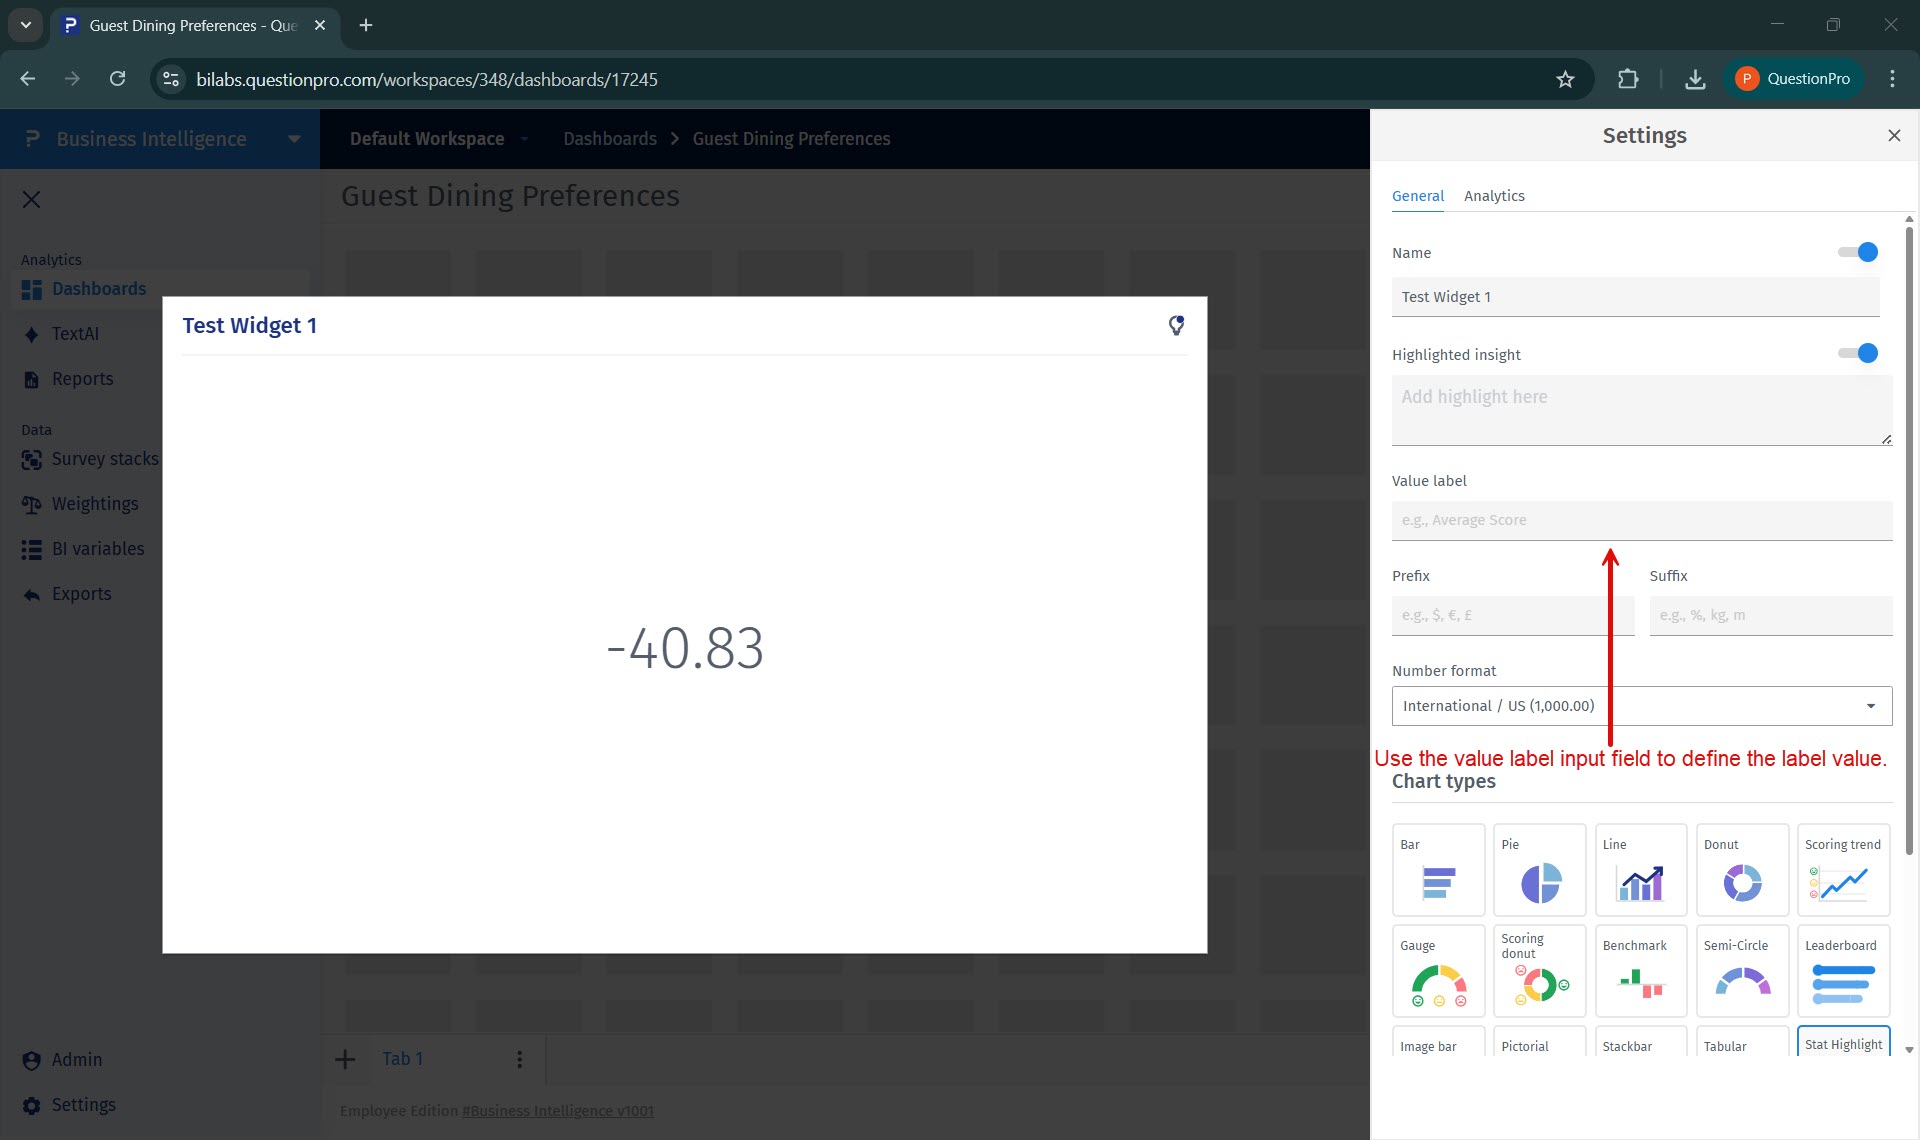
How to apply a value label to the Stat Highlight widget?
Use the value label field in the General tab to define a label displayed below the metric value.
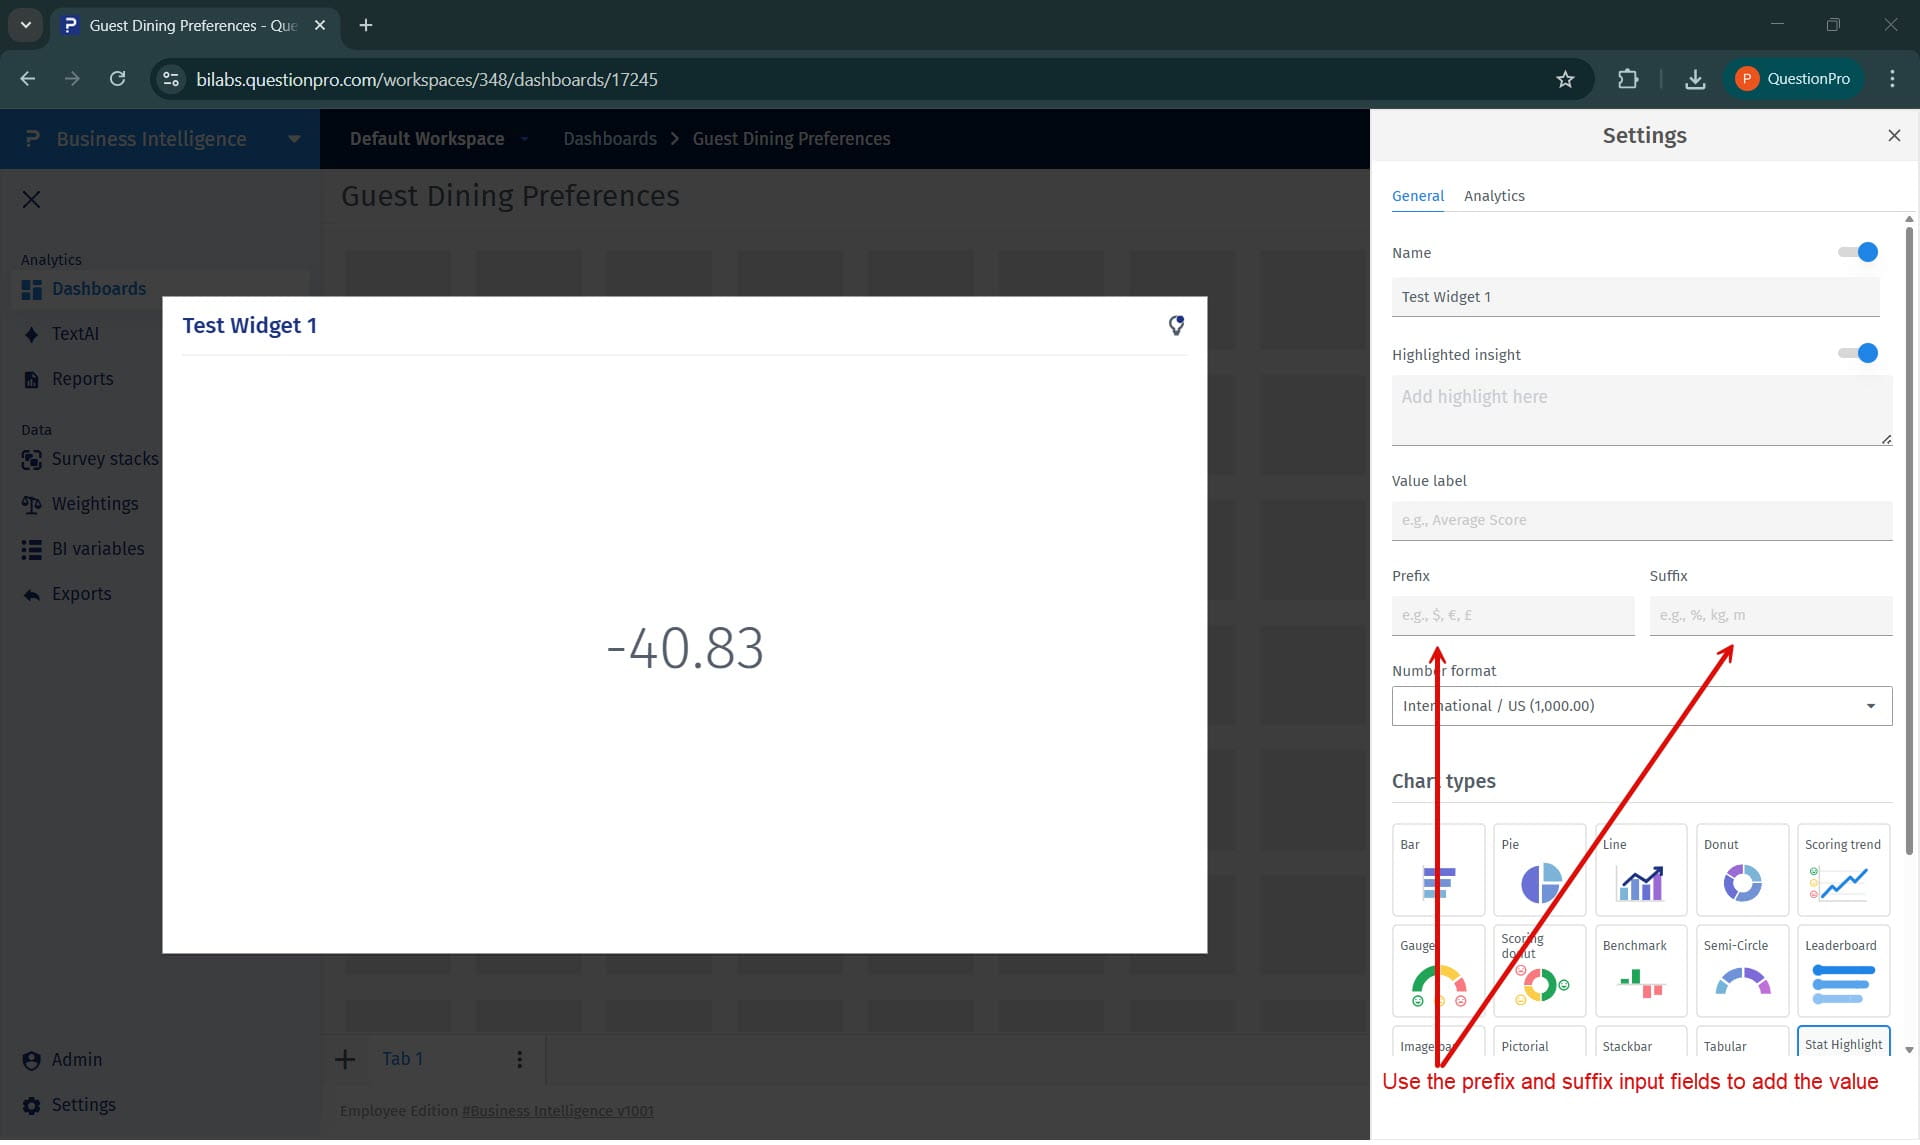
How to add a prefix or suffix?
Use the Prefix and Suffix fields in the General tab to add contextual symbols or text to the displayed value.
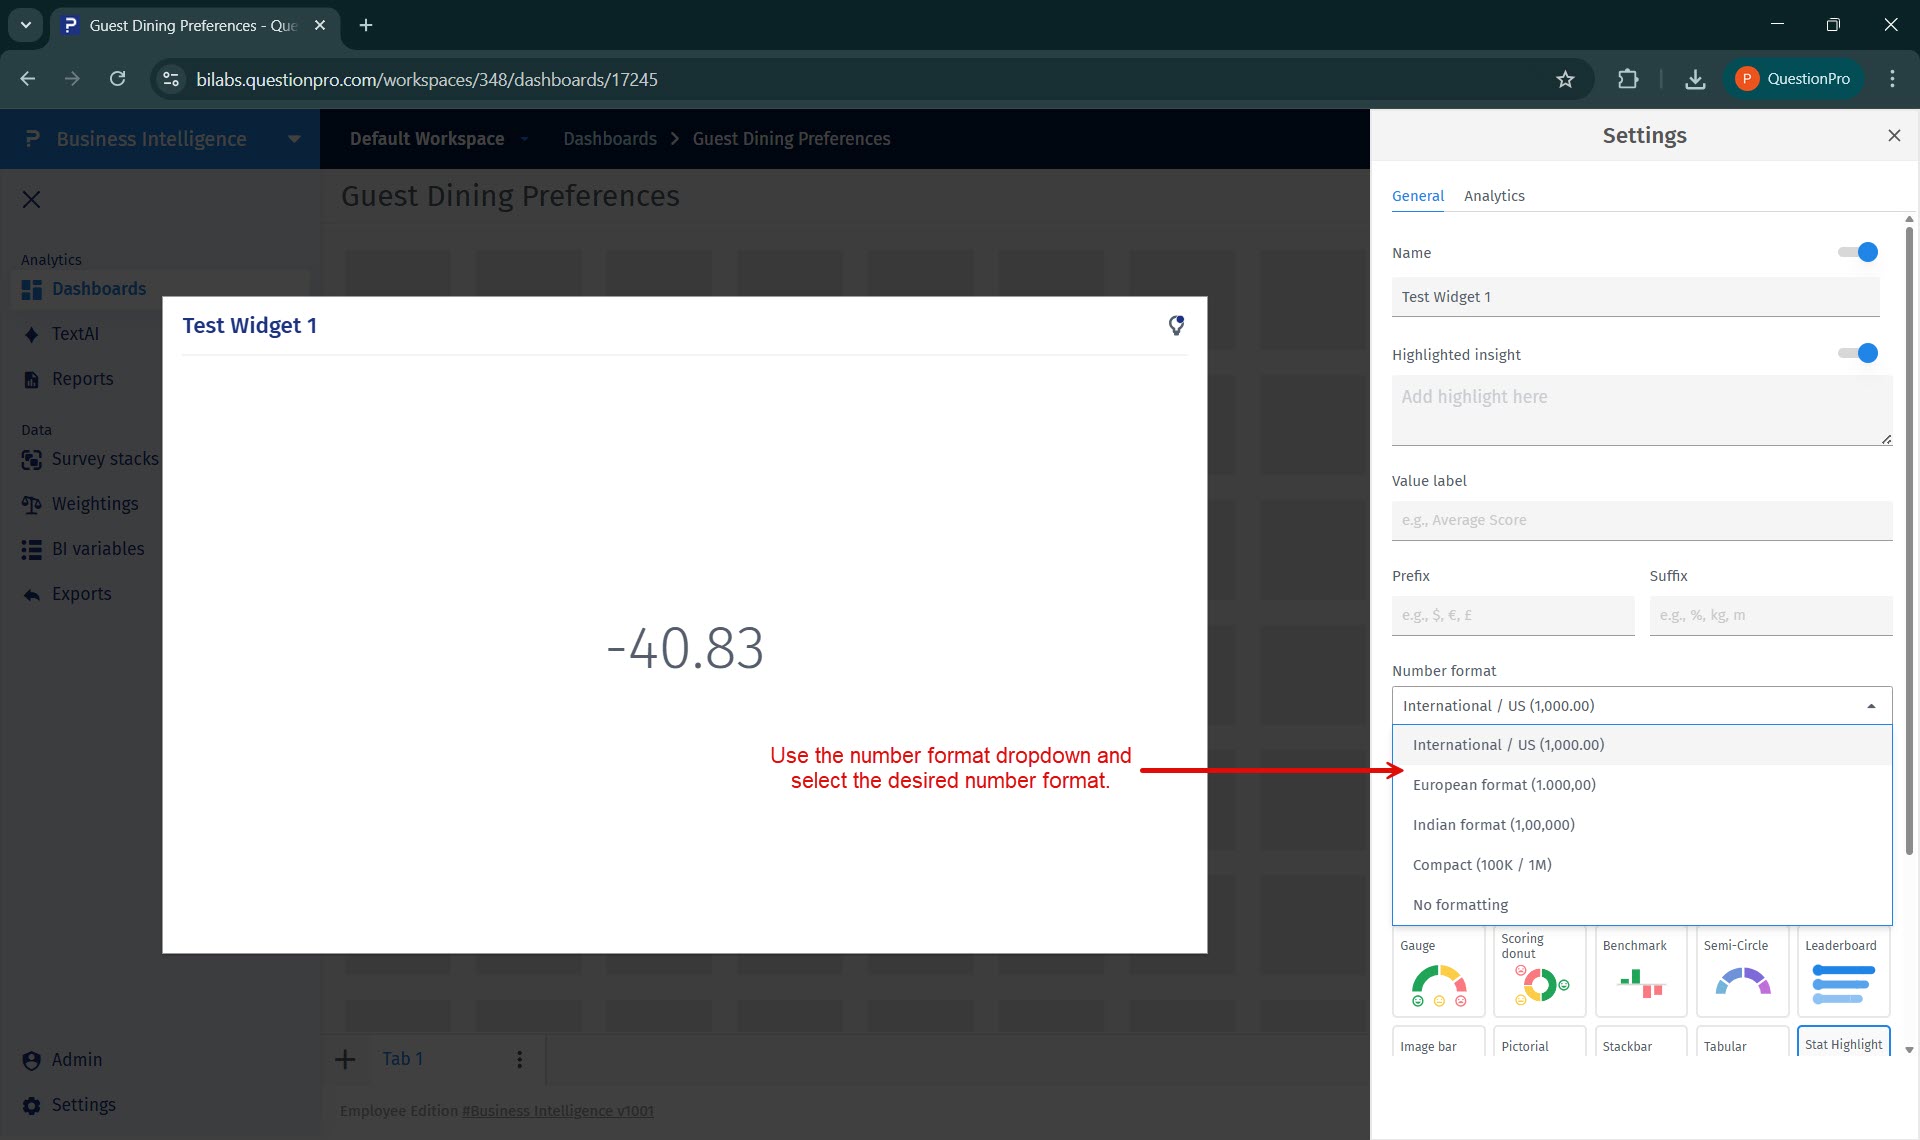
How to change the number format?
Select the desired number format from the Number format dropdown, such as International, European, Indian, Compact, or No formatting.
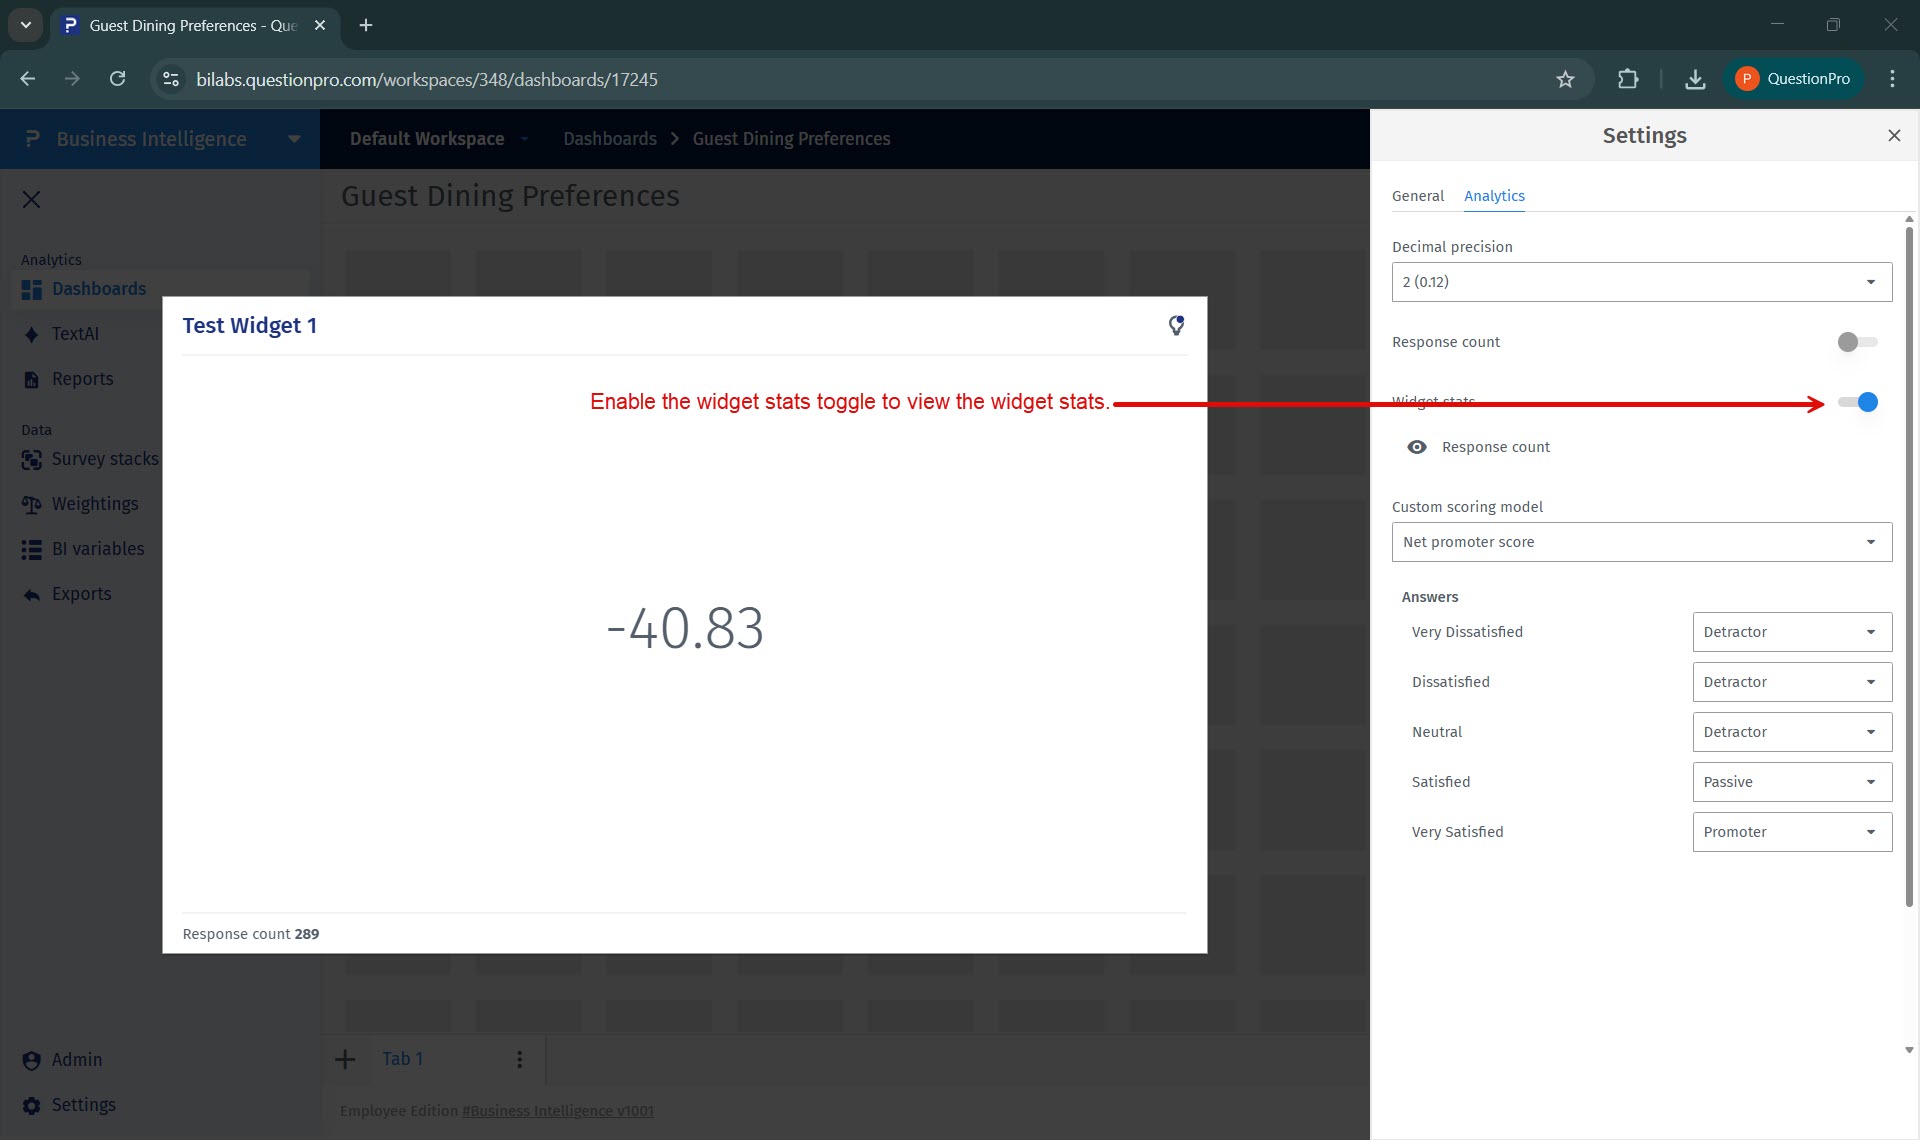
How to enable widget stats?
From the Analytics tab, enable the Widget stats toggle to display additional information such as response count.
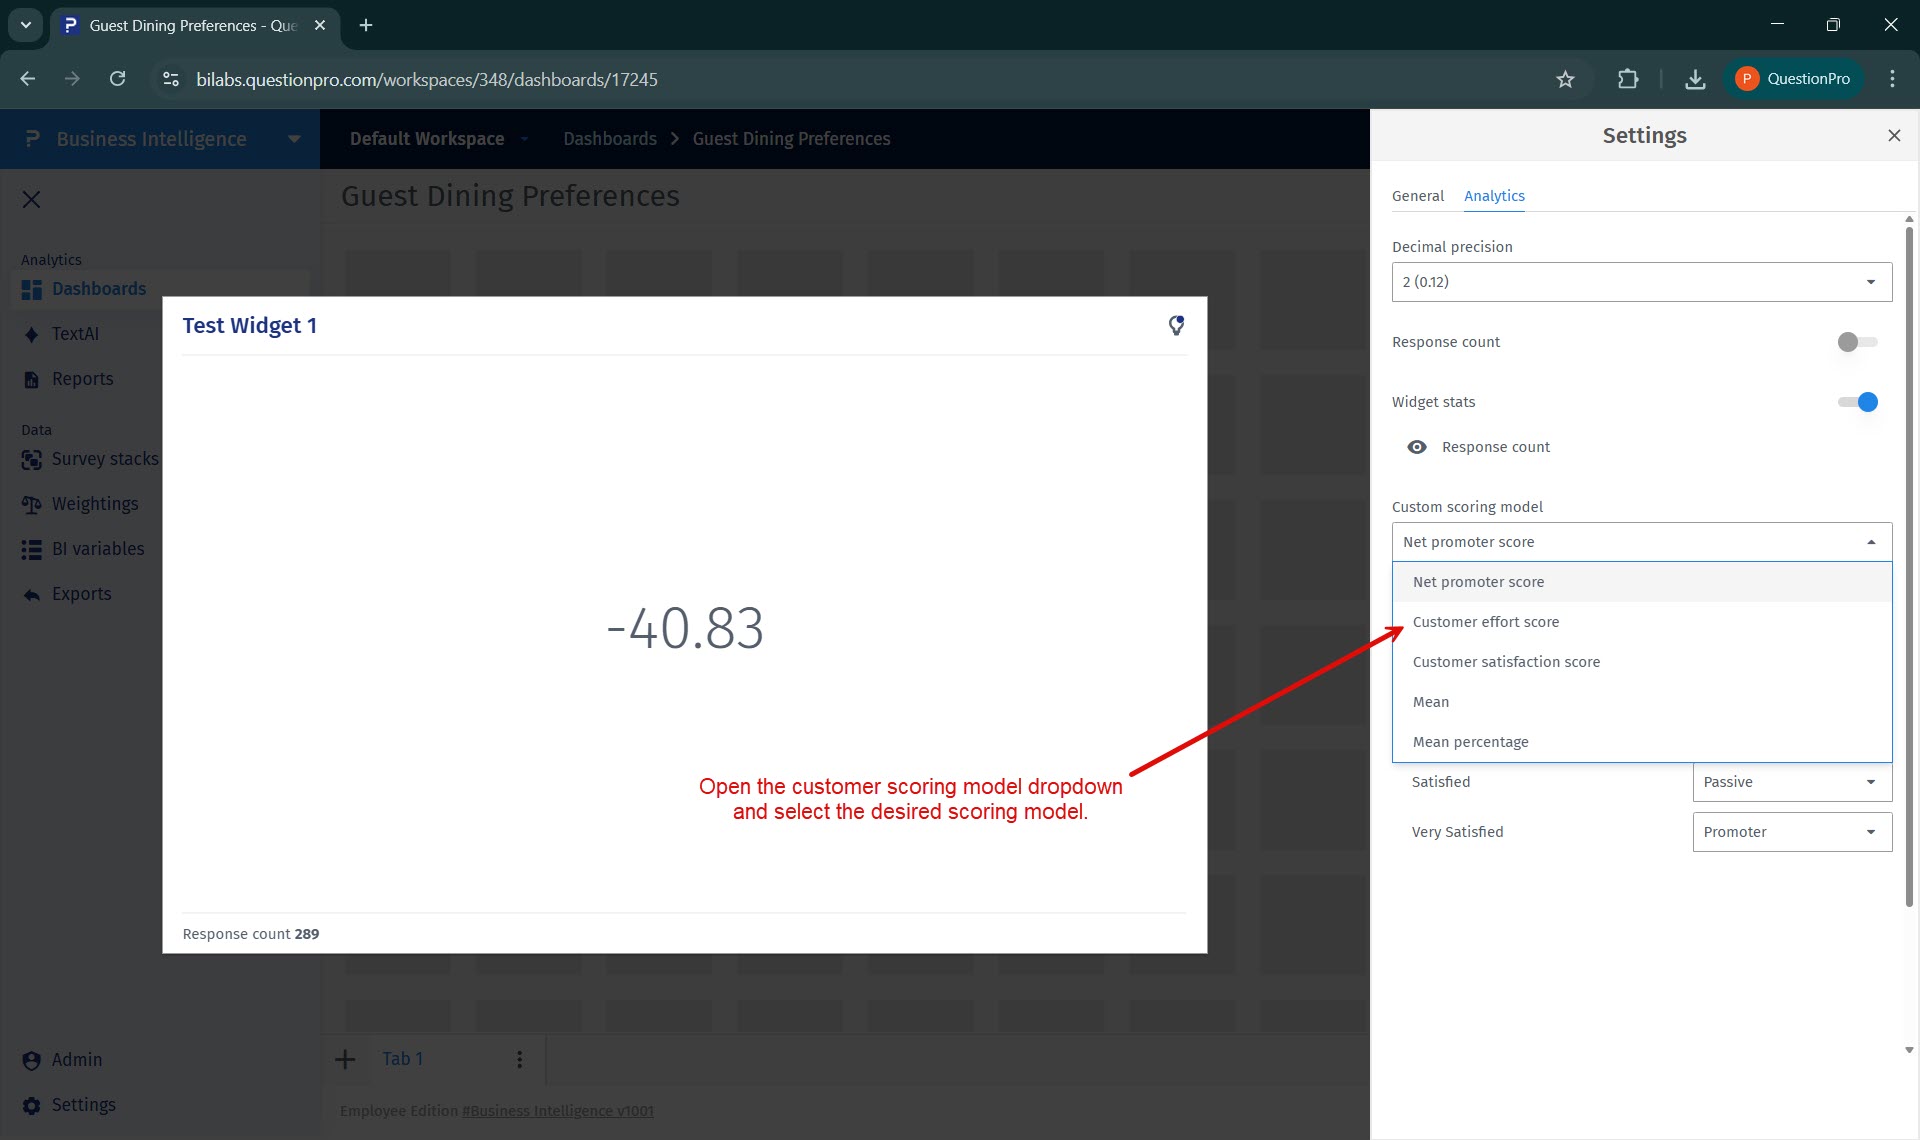
How to change the customer scoring model?
Use the Customer scoring model dropdown in the Analytics tab and select the desired scoring model for the widget.
- Stat Highlight Widget: A BI dashboard widget that displays a single calculated statistic derived from survey responses.
- Customer Scoring Model: A predefined calculation logic used to derive metrics such as NPS, CES, or CSAT by mapping responses to scoring categories.
- Widget Stats: Additional contextual information, such as response count, displayed alongside the primary metric.
- Number Format: A display option that controls how numeric values are formatted and presented in the widget.
- Highlighted Insight: A short explanatory message shown above the widget value to provide context or interpretation.
This feature is available with the following licenses :
Team Edition Research Edition Communities Customer Experience Employee Experience