


Sentiment Stackbar Help File
The Sentiment Stackbar visualizes the sentiment distribution across responses to an open-ended survey question.
It helps users understand the overall emotional tone expressed in text comments by showing the proportion of each sentiment—ranging from very negative to very positive—in a single stacked bar.
The Sentiment Stackbar provides a proportional visual breakdown of sentiments detected in text responses for a selected question.
- Very Negative
- Negative
- Neutral
- Positive
- Very Positive
- No Sentiment
Each sentiment is represented as a color-coded segment of a single horizontal bar, where the total length equals 100% of responses. It provides quick insight into emotional trends in your data.
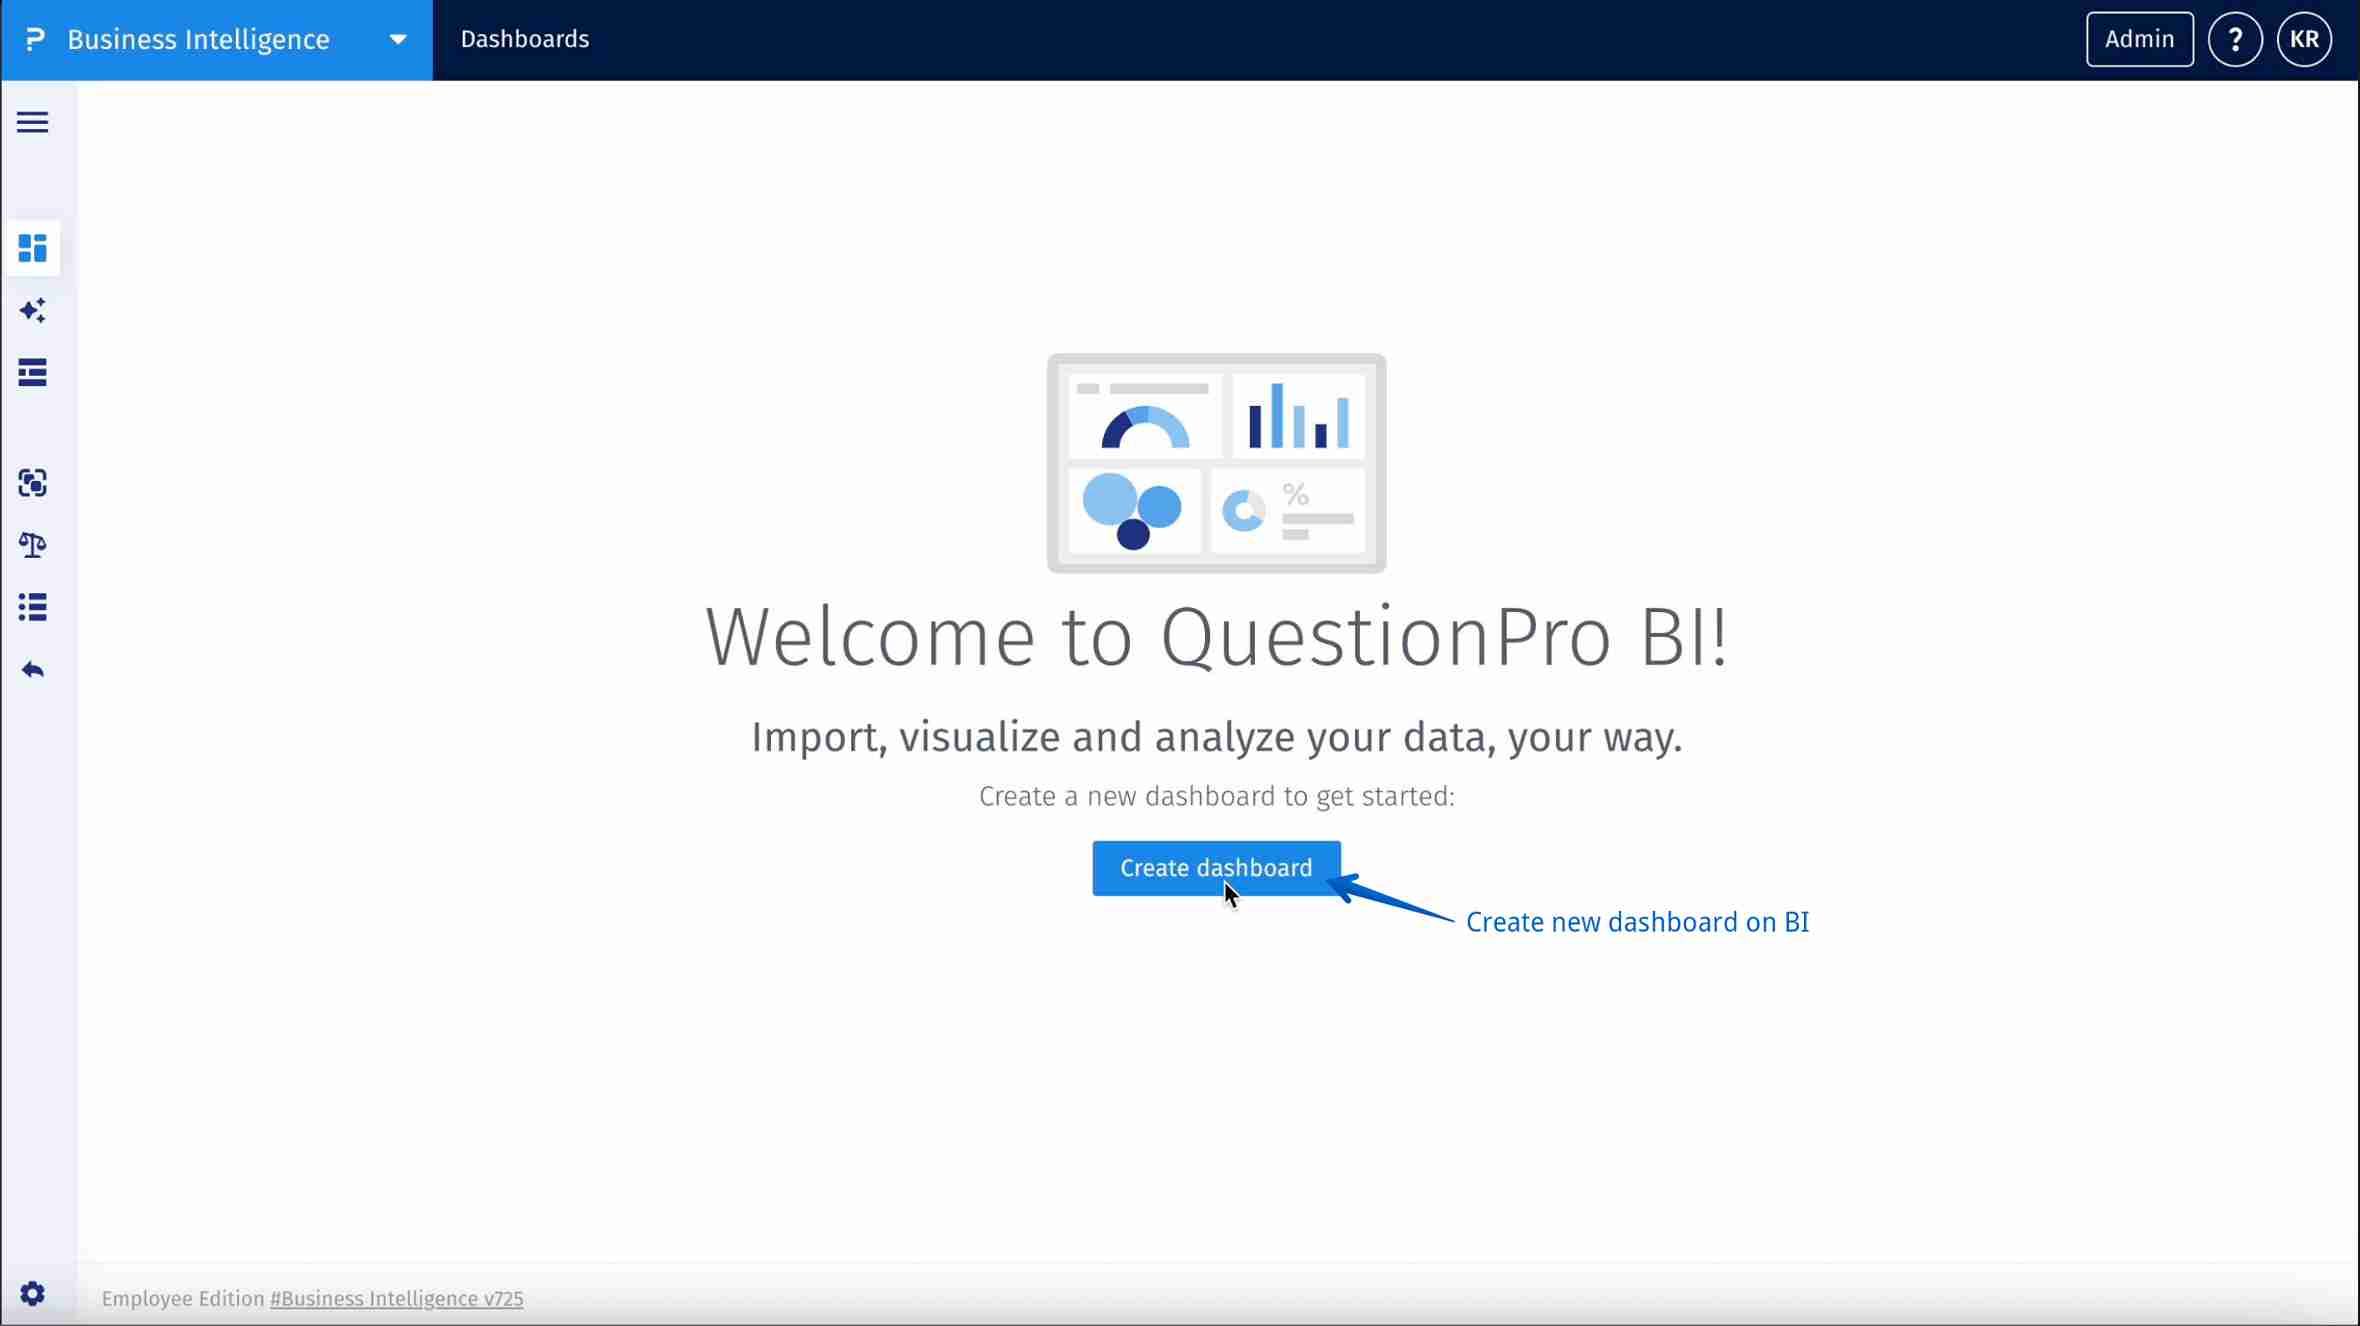
- Step 1: Create dashboard – To create sentiment stackbar response widget create a new dashboard or in an existing go to Step 6.
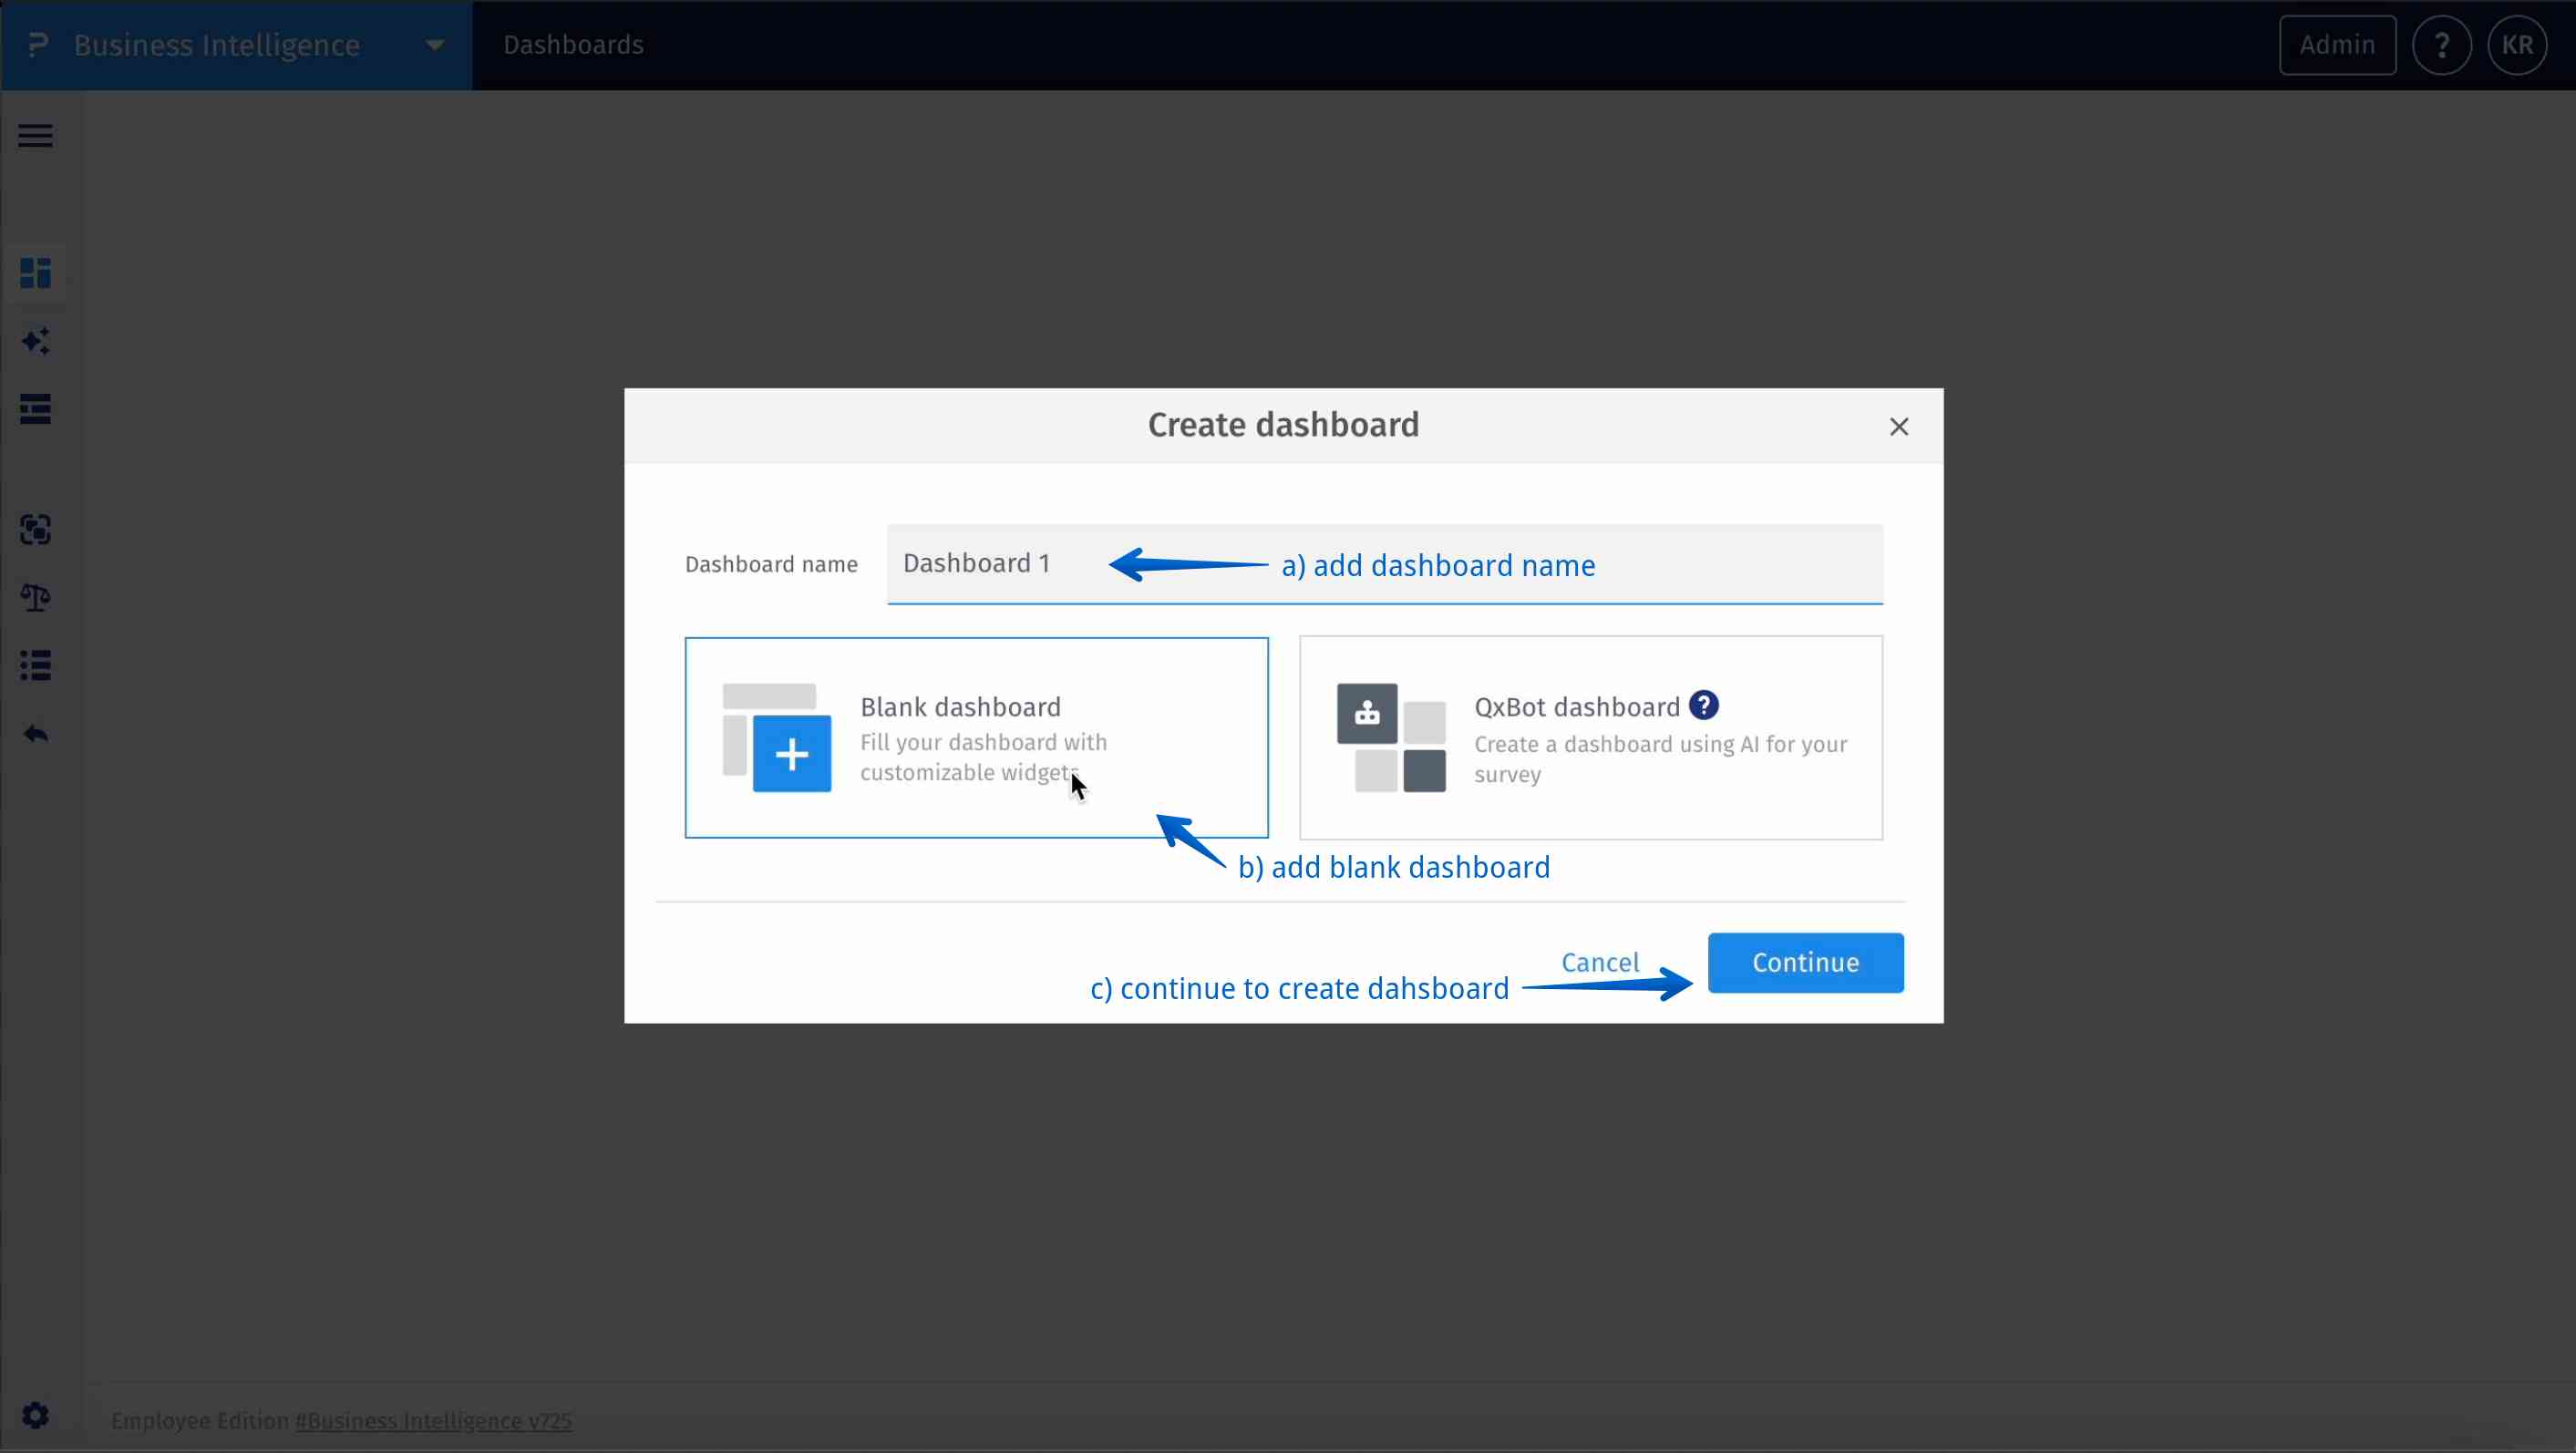
- Step 2: Select blank dashboard – Choose a blank dashboard layout as the starting point for adding your sentiment stackbar widget or in an existing go to Step 6.
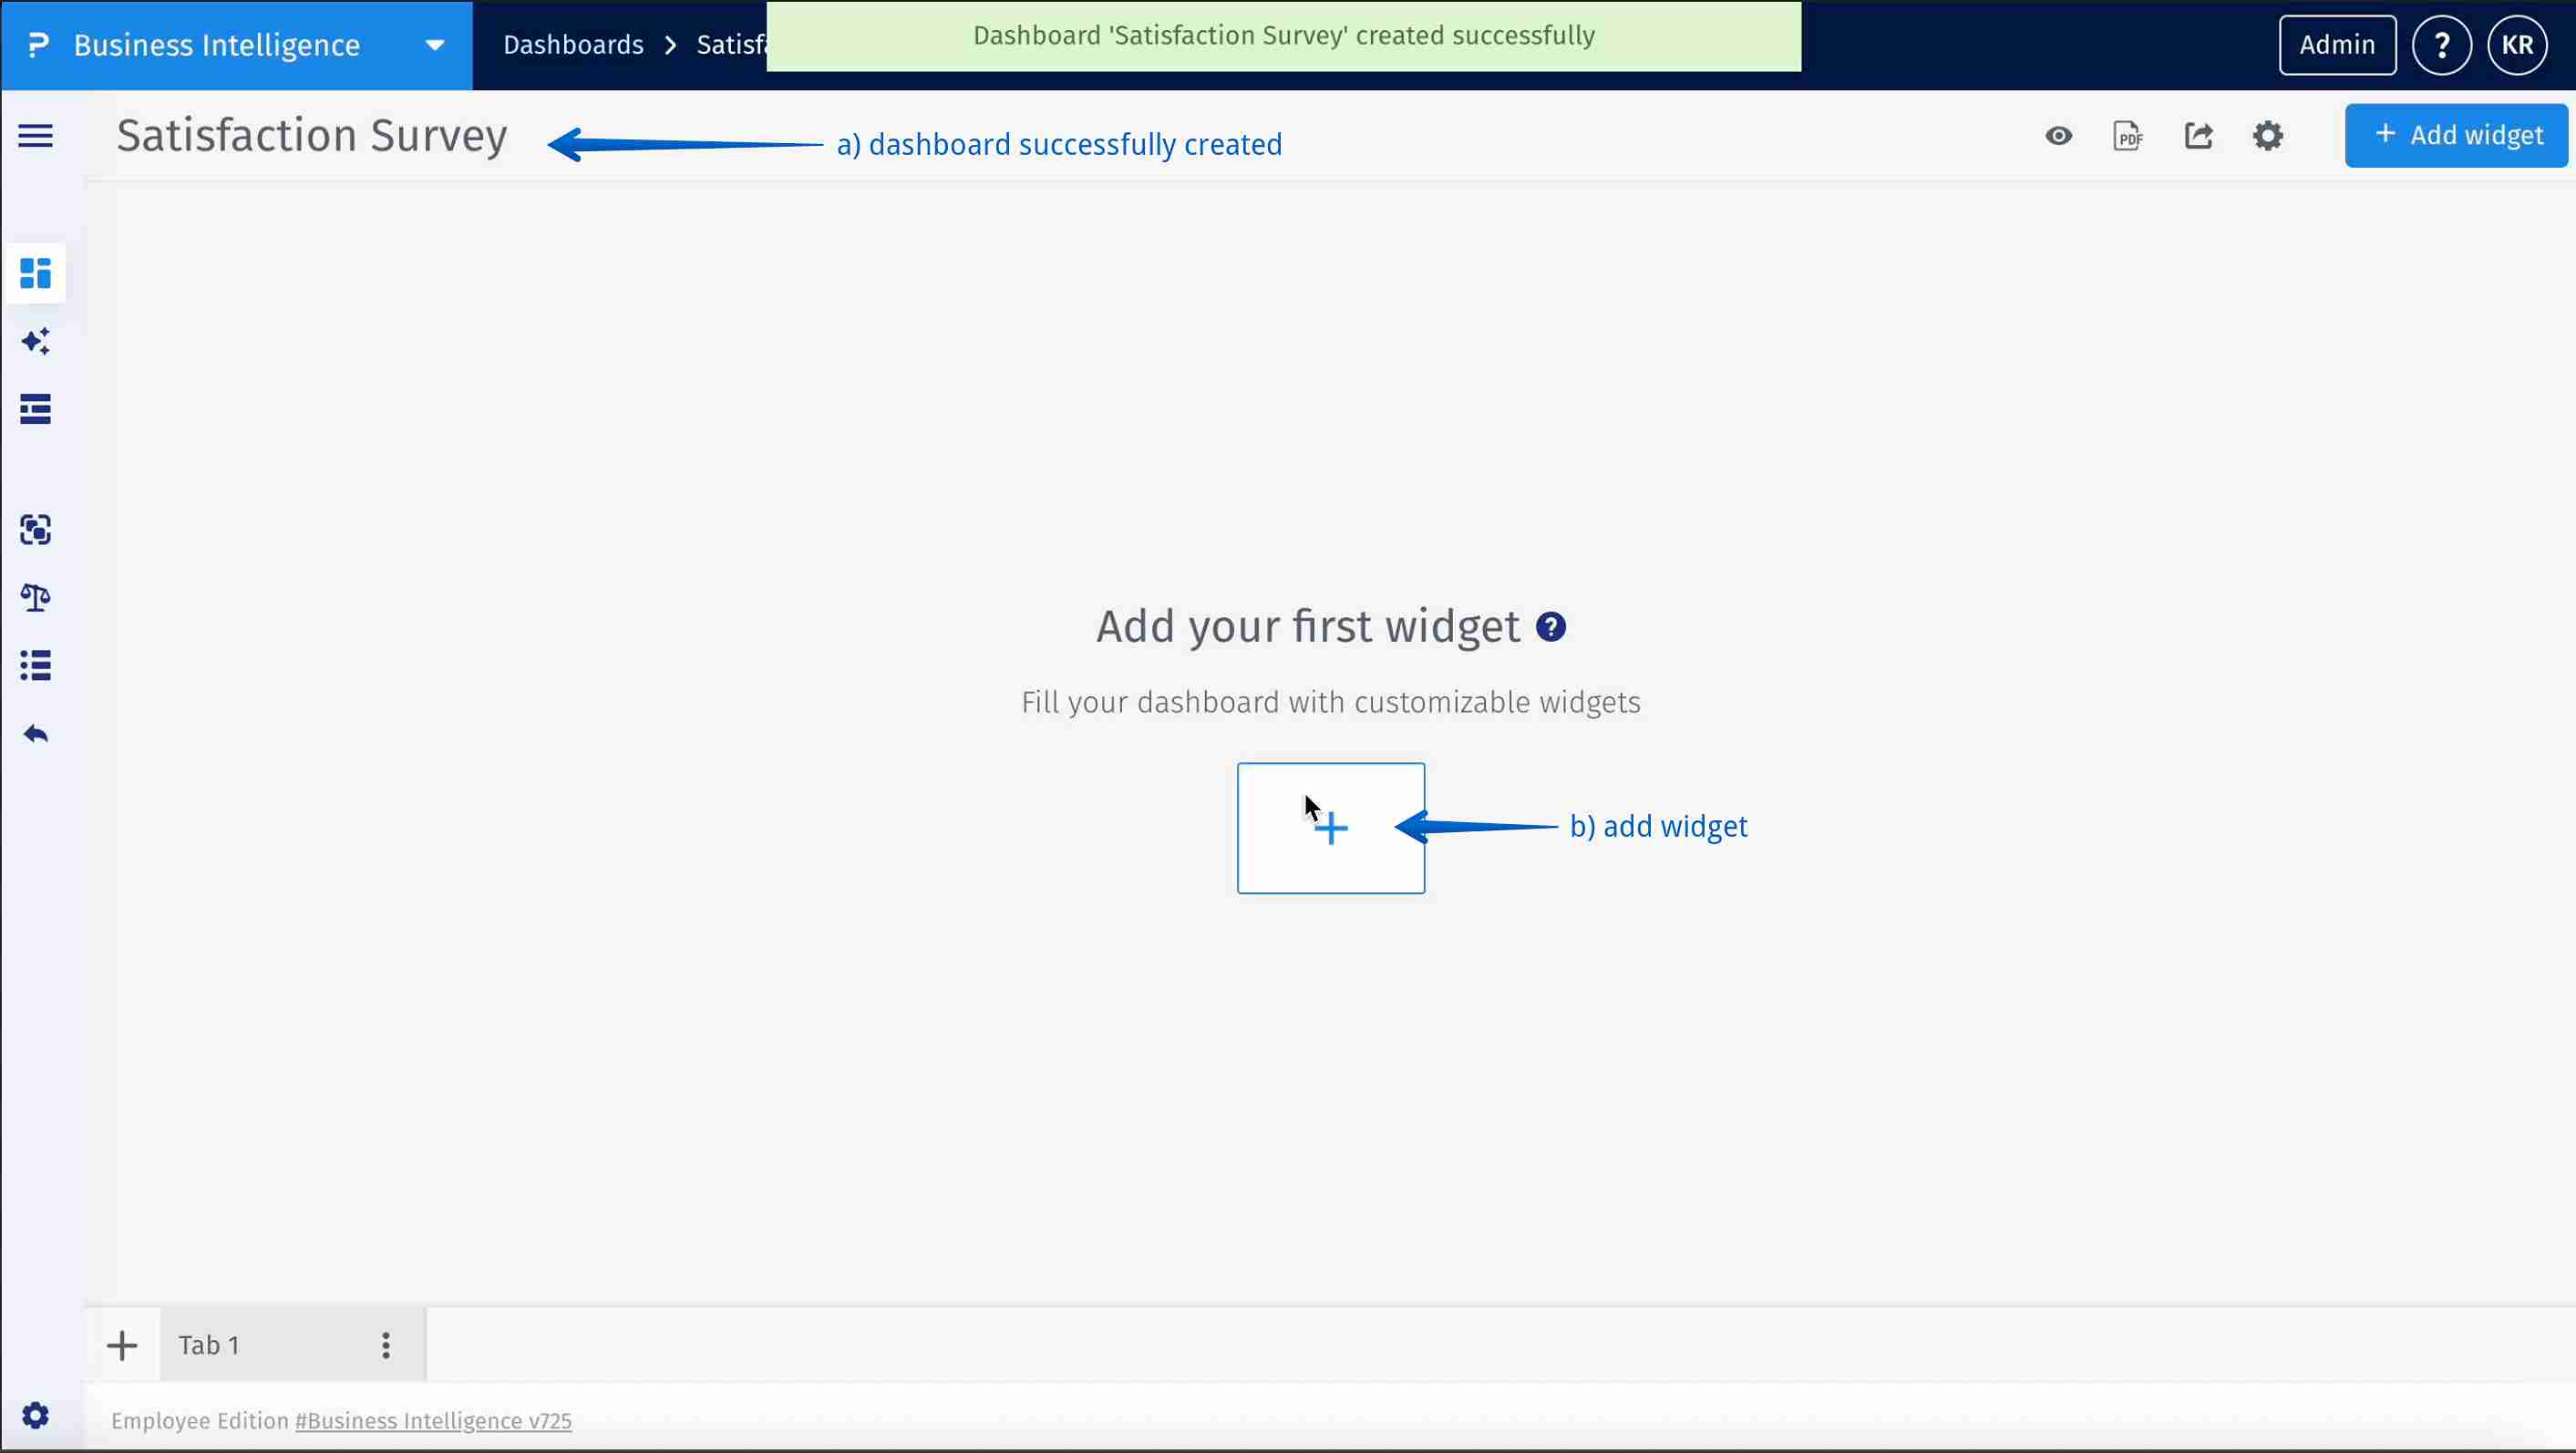
- Step 3: Add widget – Click on “Add Widget” to begin inserting visual elements, into your dashboard
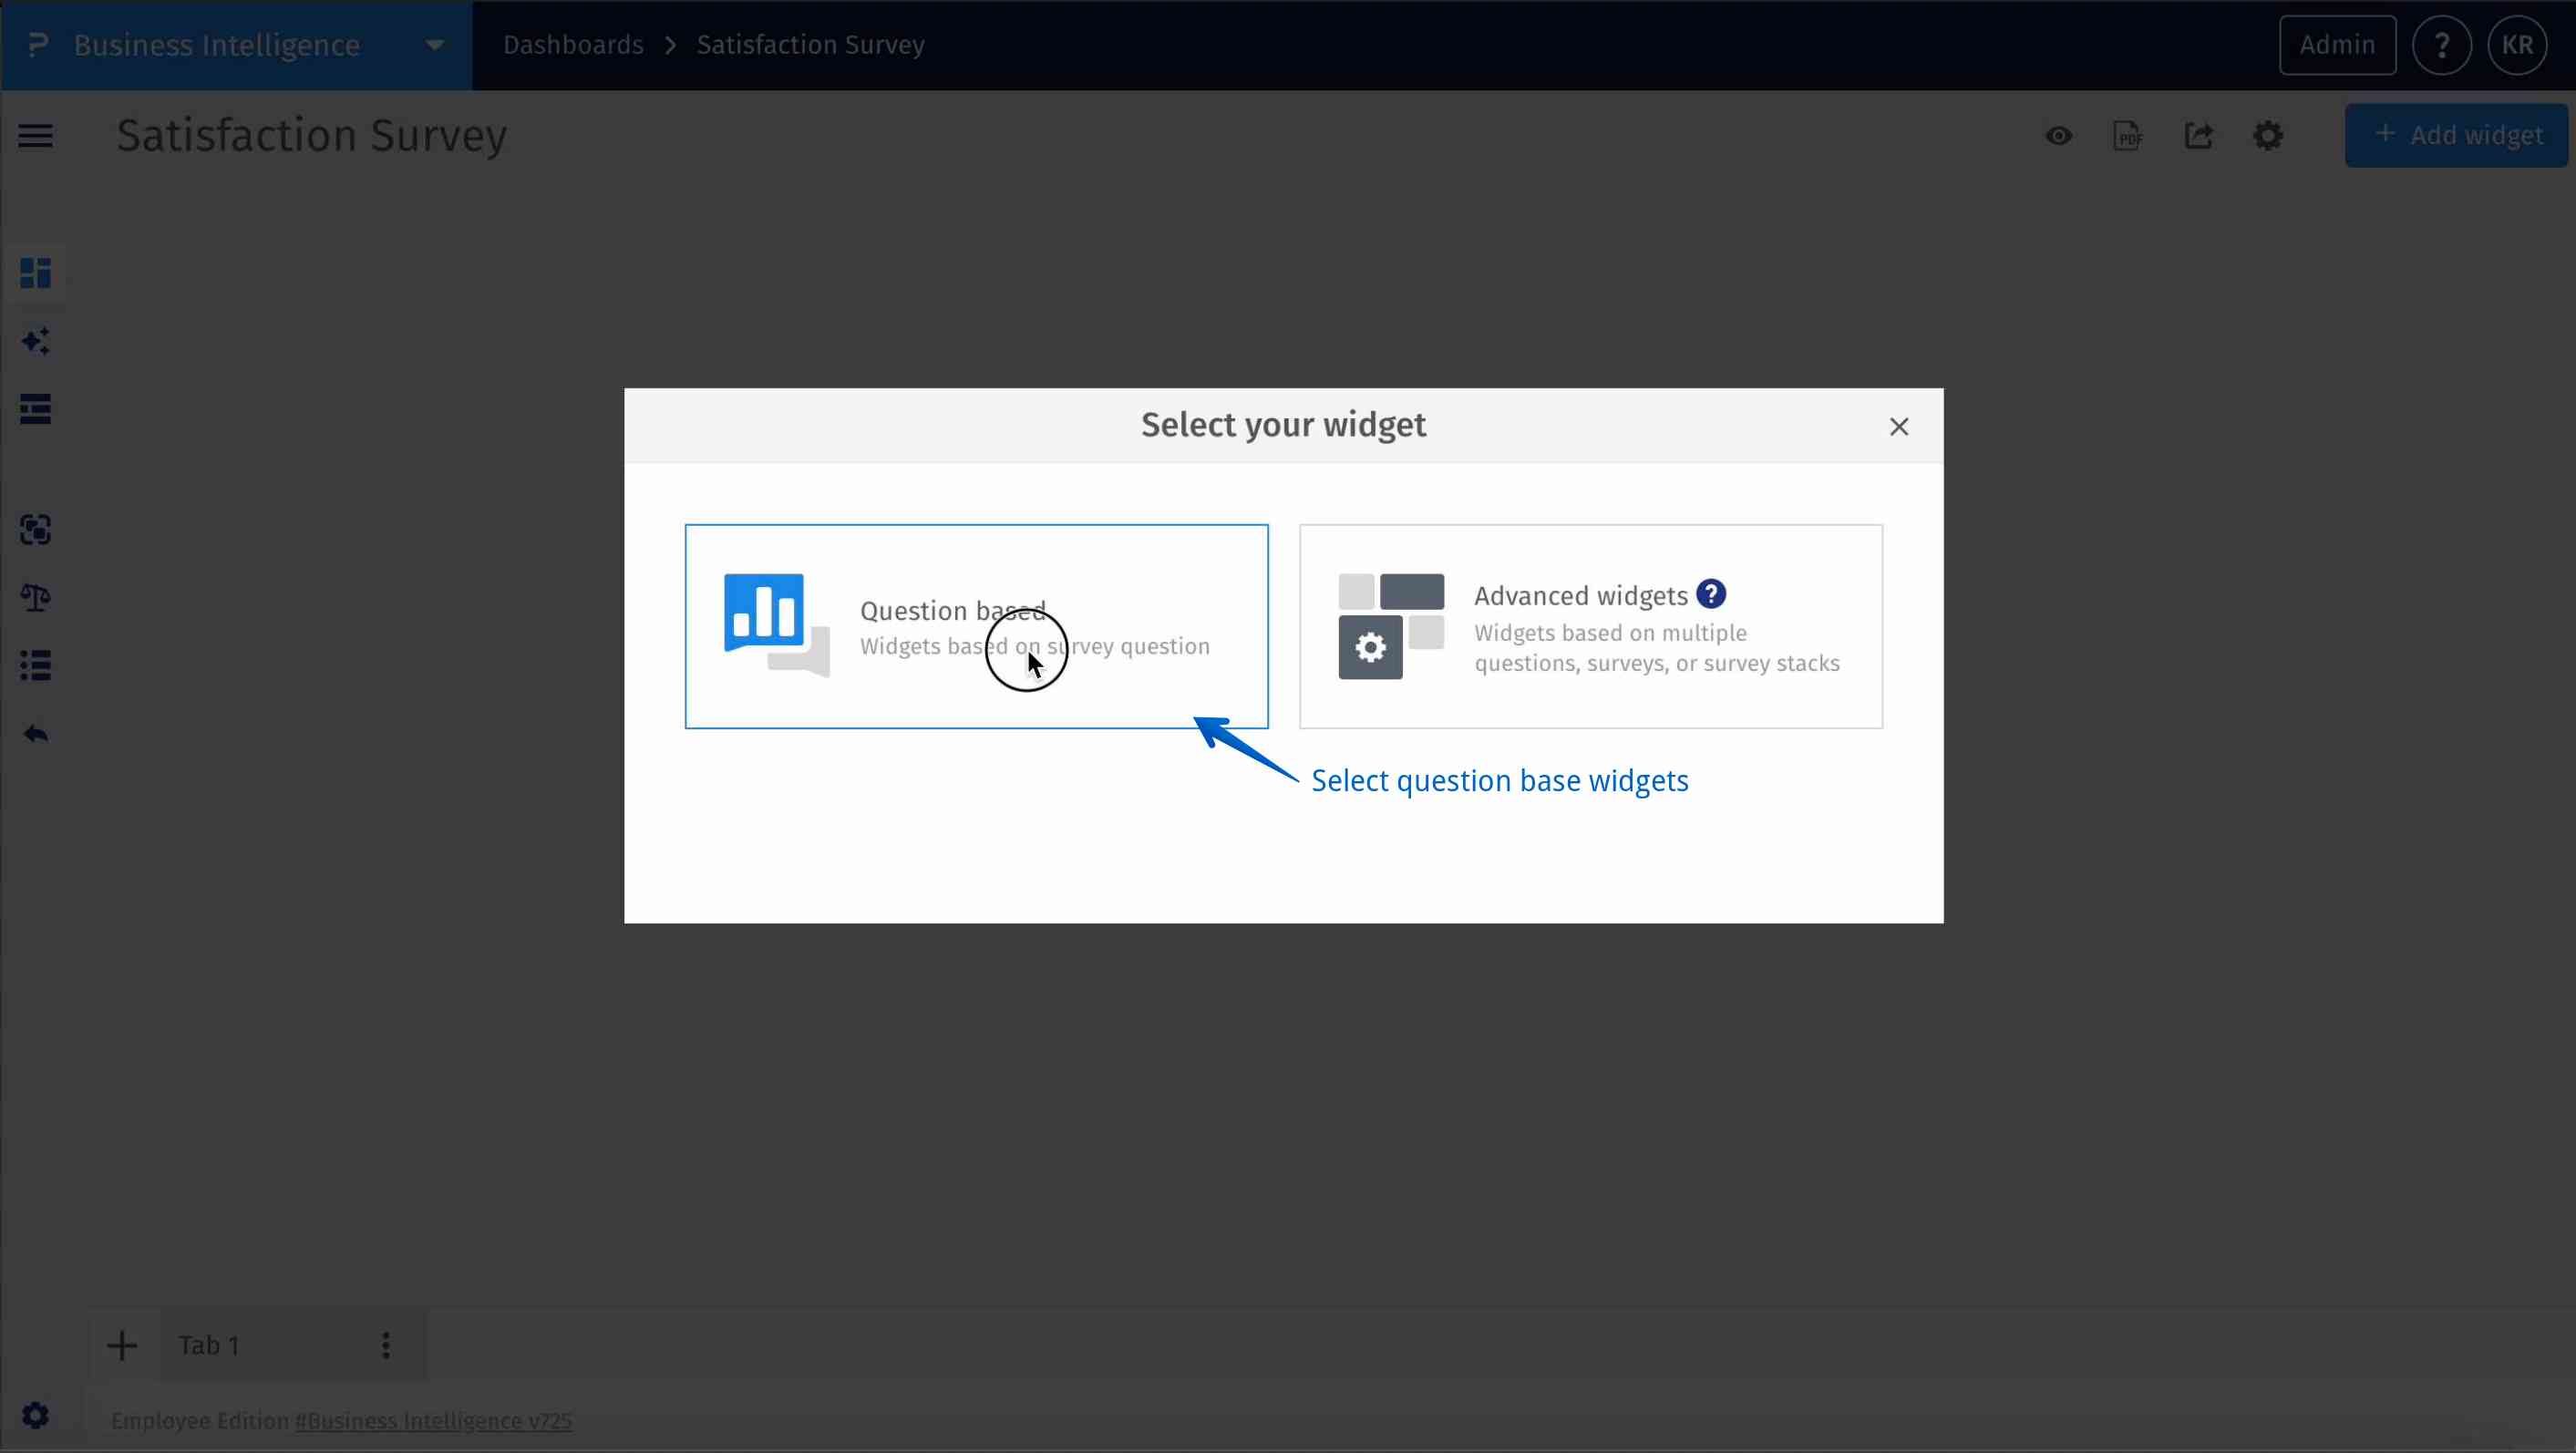
- Step 4: Select your widget – Choose the sentiment stackbar widget and link it to a specific open-ended survey question to visualize sentiment proportion from each respondent in the survey.
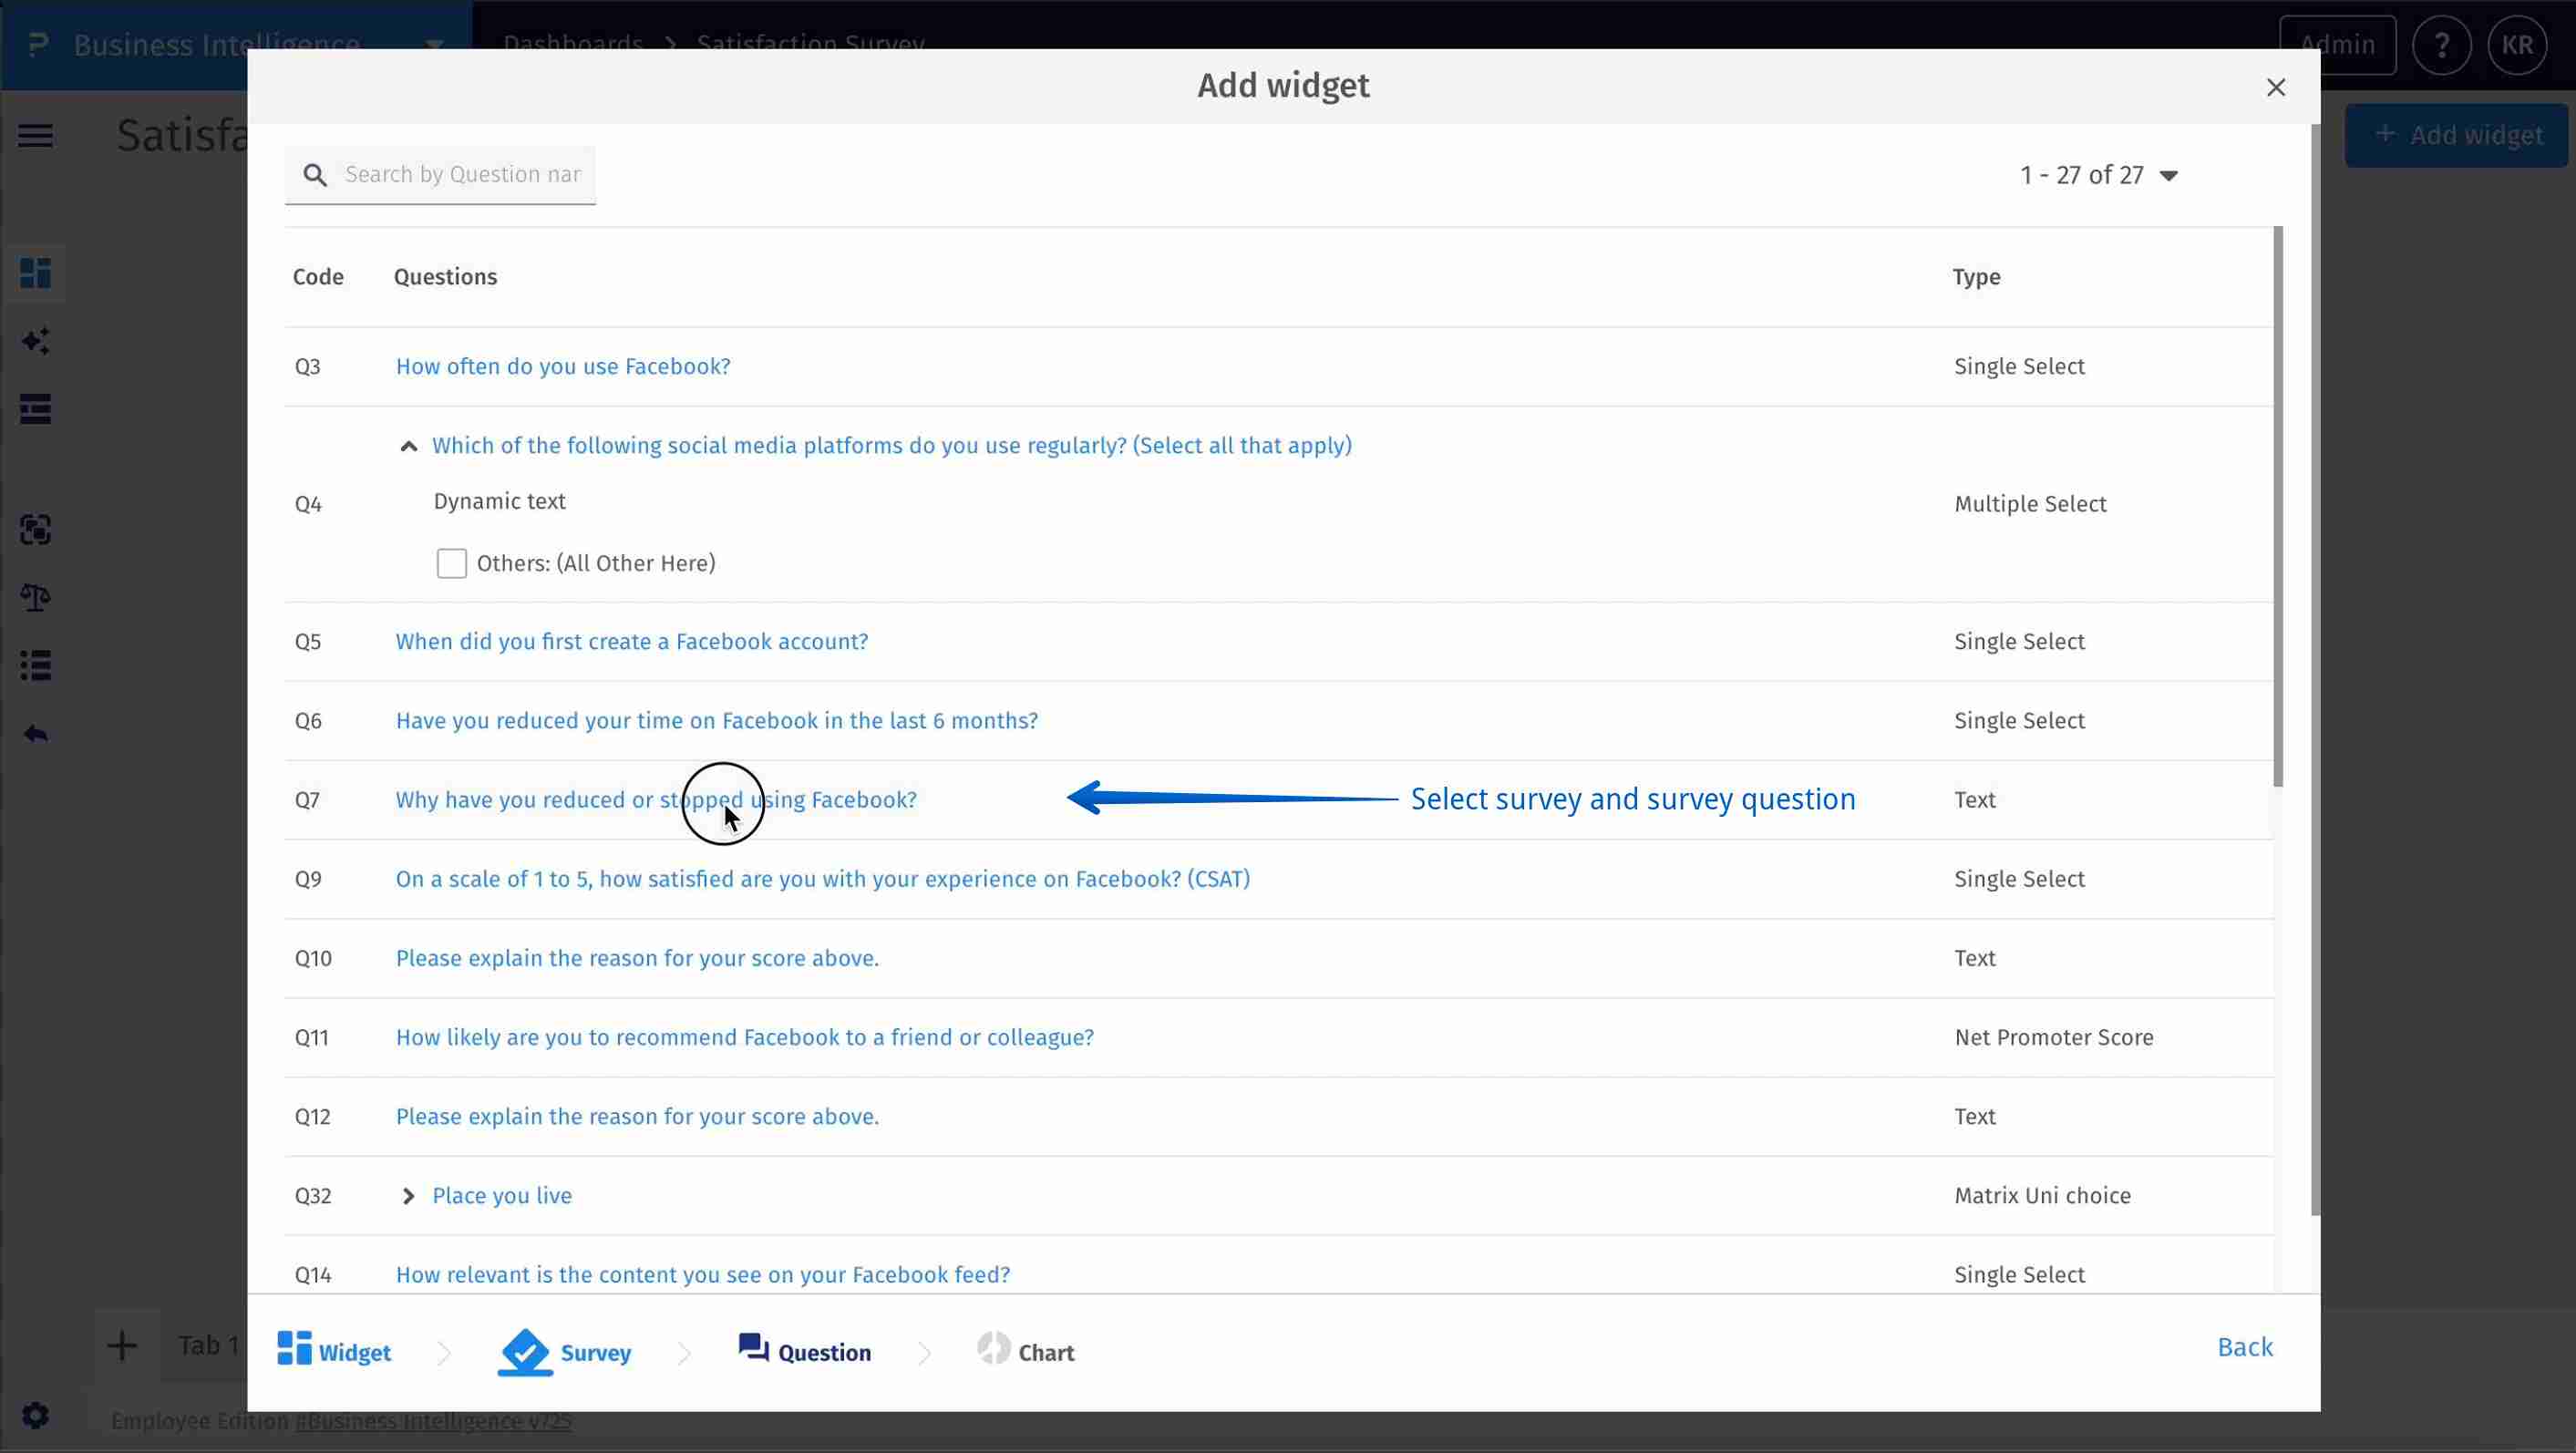
- Step 5: Select survey and survey question – Select the relevant survey and then choose a text-based (open-ended) question. The sentiment stackbar widget supports only text question types to display proportion of sentiments for a specific survey question.
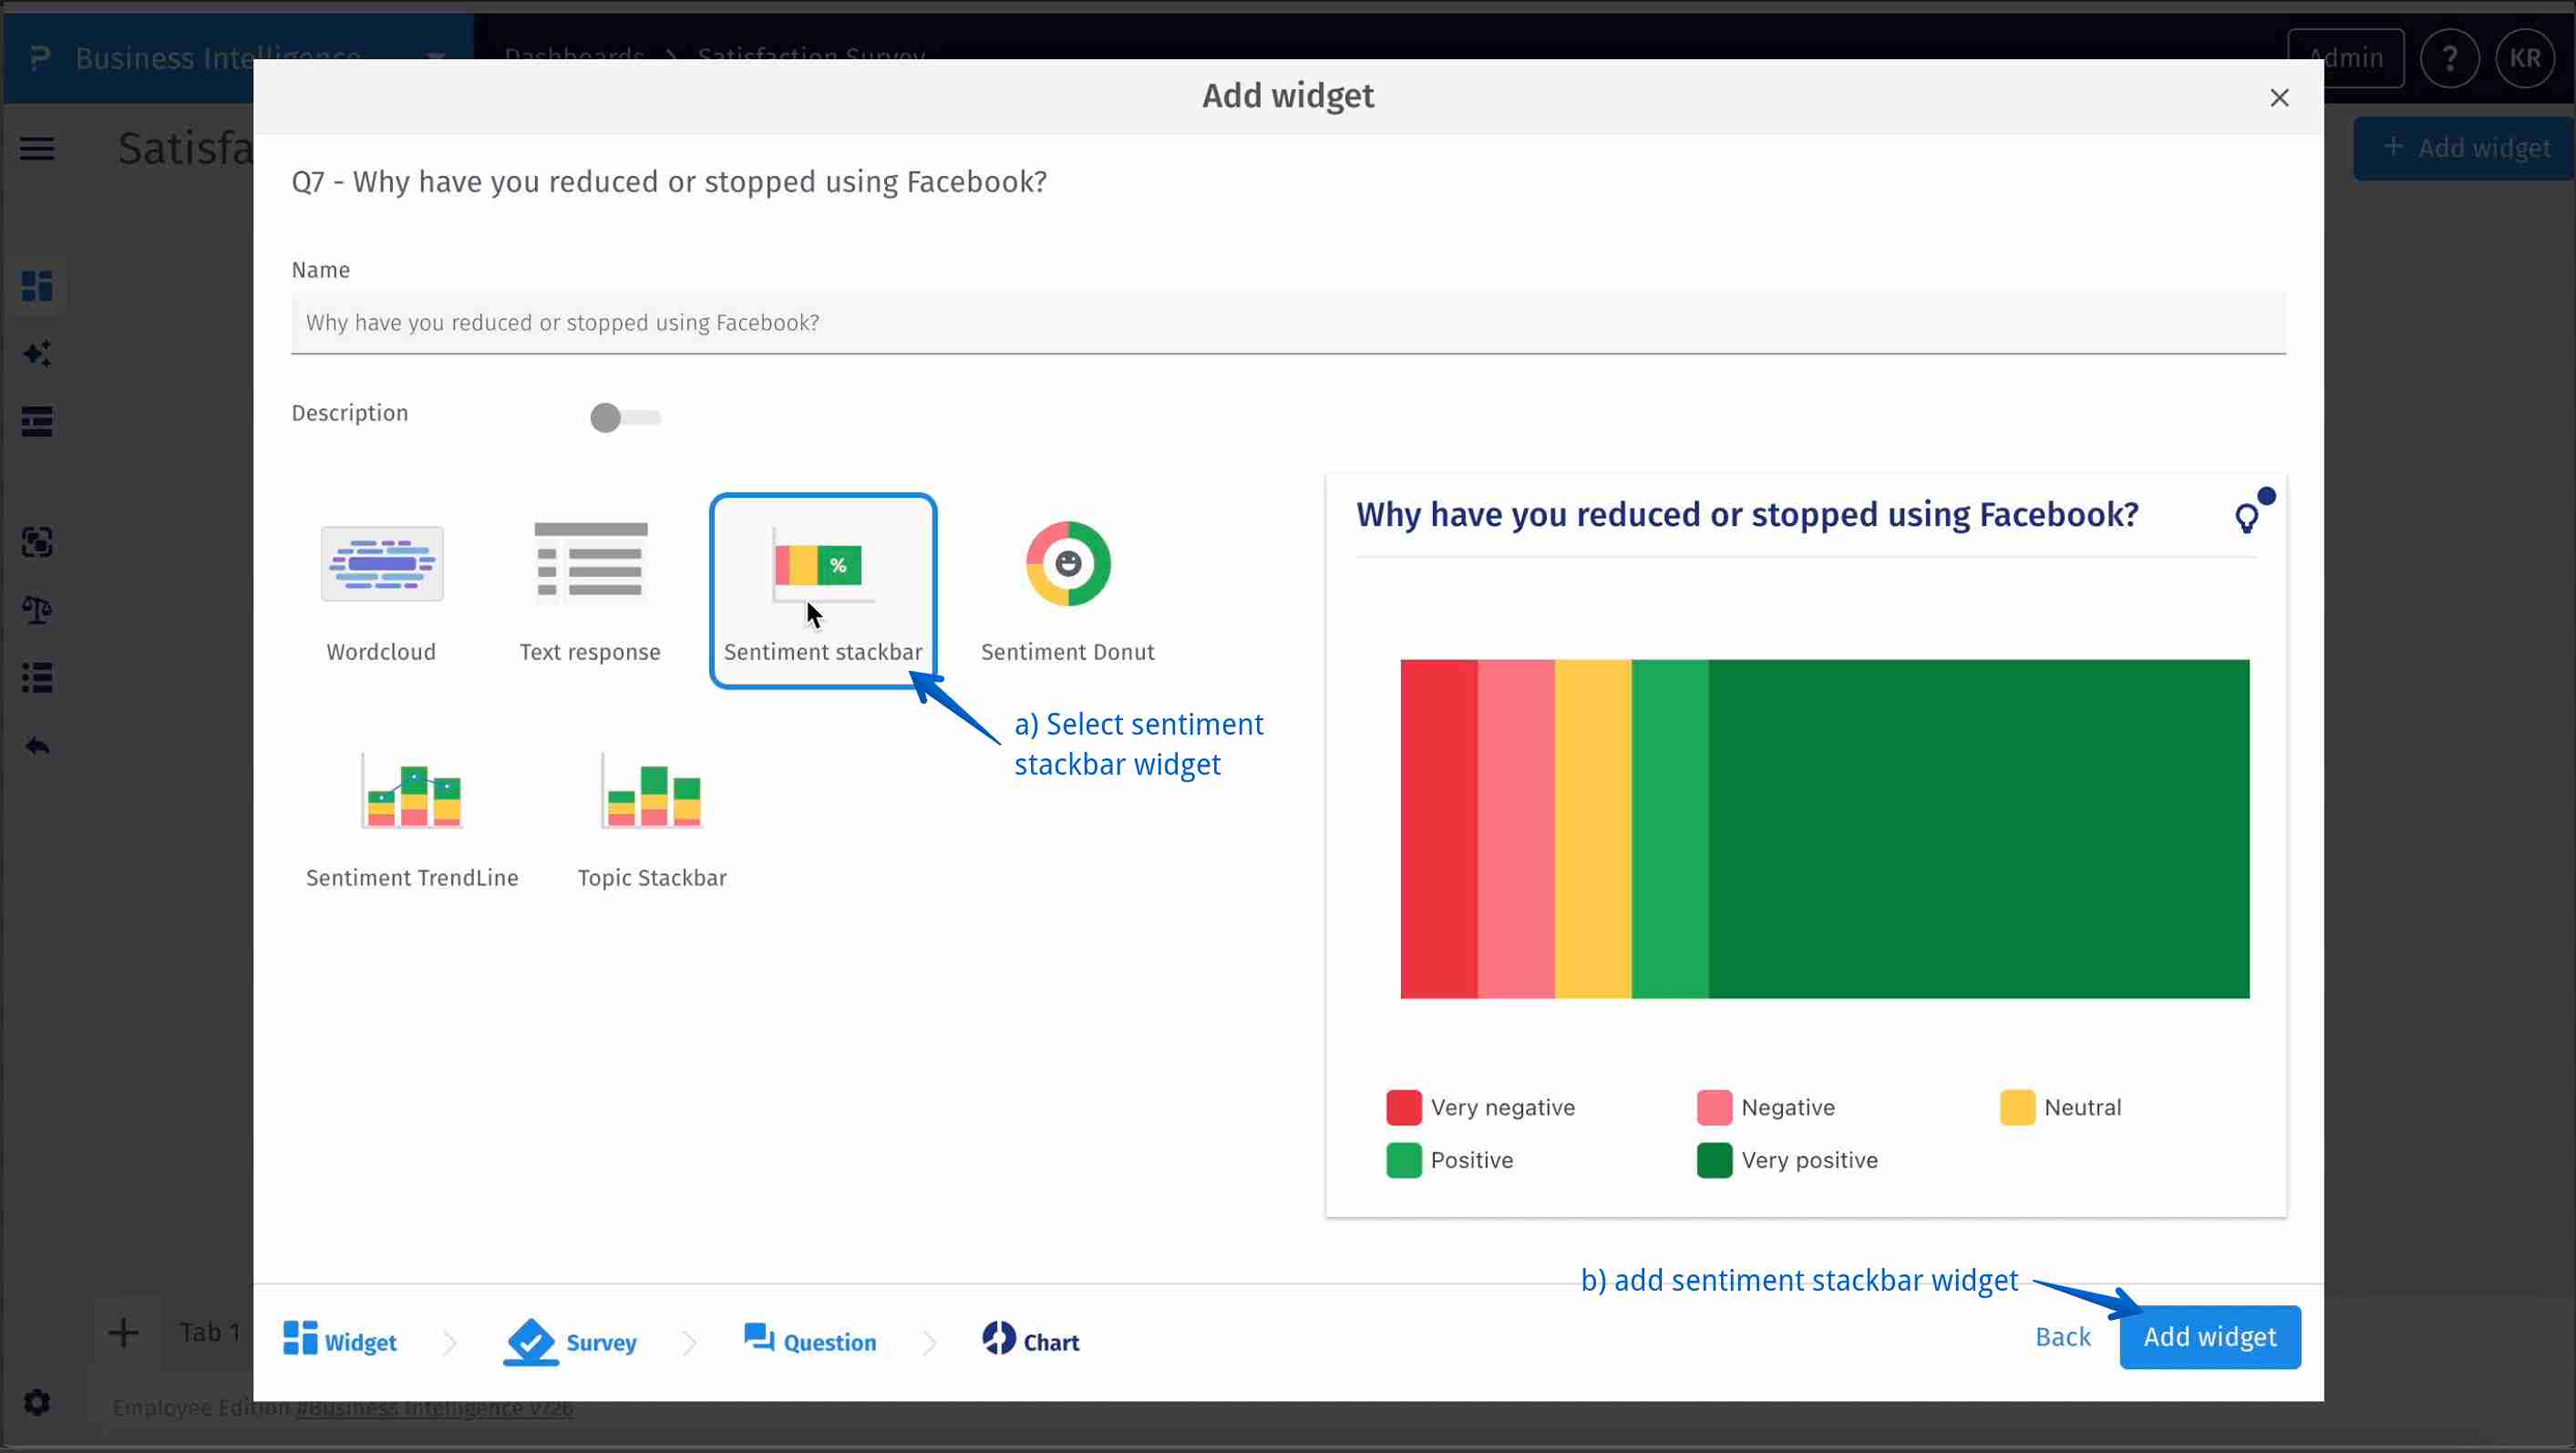
- Step 6: Select sentiment stackbar – Select the relevant survey and then choose a text-based (open-ended) question. The sentiment stackbar widget supports only text question types to display proportion of sentiment for a specific survey question.
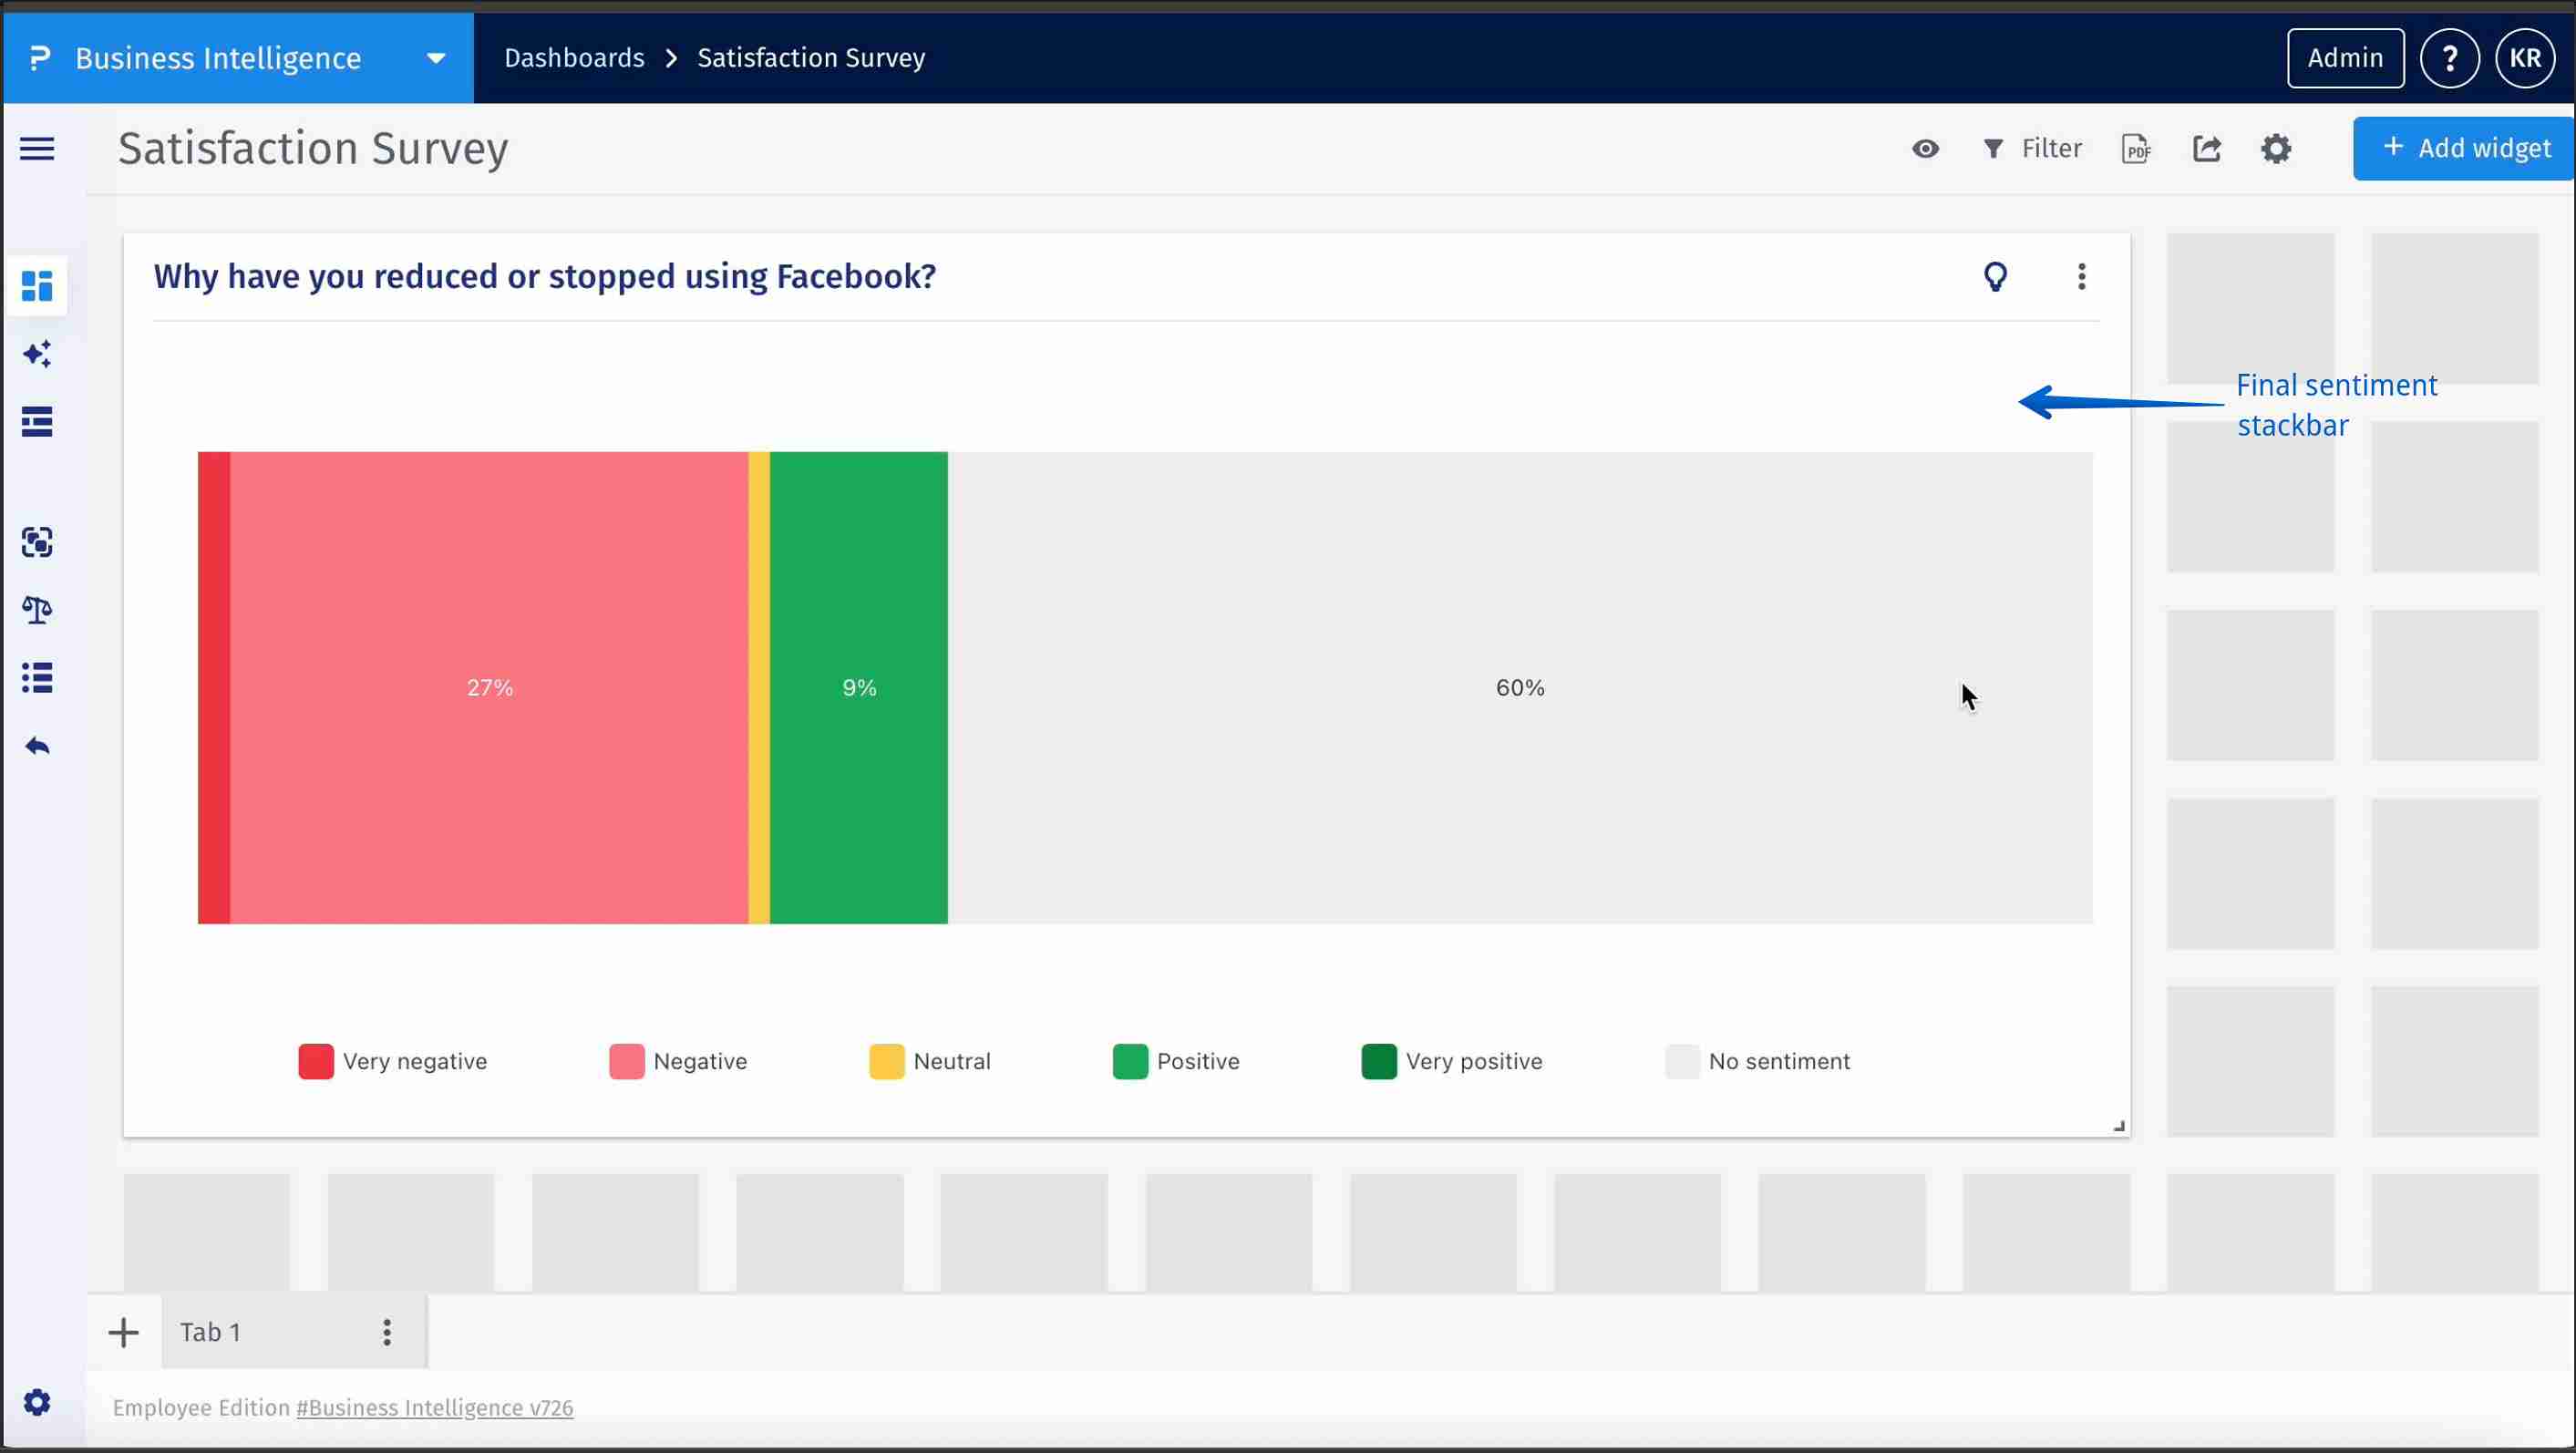
- Step 7: Final sentiment stackbar widget – The sentiment stackbar widget is now added to the dashboard, displaying the proportion of sentiments—very negative, negative, neutral, positive, very positive, or no sentiment—for the selected question. This visual summary helps users quickly interpret the emotional tone of responses at a glance.
- Sentiment Analysis: An NLP technique used to identify the emotional tone in textual data.
- Stacked Bar Chart: A chart where different segments represent different parts of a whole.
- No Sentiment: Indicates that no clear sentiment could be detected in the response.