


Semi-Circle Chart for your widget
Semi-Circle charts, also known as half-doughnut charts, are similar to doughnut charts but only display a half circle.
Go to: Login » Select dashboard » Add widget » Question based or continue using this survey » Select question or part of a question » Select the Semi-Circle chart type » Add Widget
 Step 2: Give a name to widget >> Select Semi-Circle Chart type >> Add Widge

You can customize the chart elements such as enable or disable Legends, highlight highest propertion and display data labels inside or outside the chart.
Click on the options of the widget: Click on settings:
 Once the general setting are shown, scroll down to access chart elements.

- Open the Semi-Circle widget’s three-dot menu and select Settings.
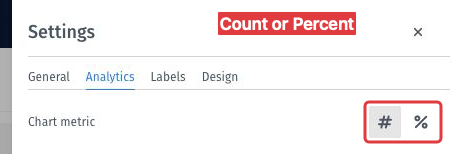
- Open Analytics and find Chart metric. Choose Count for the number of responses in each category or Percent for its share of the responses represented by the chart.
- Close Settings to view the chart. Reopen Analytics to review the selected metric.
For example, if 60 of 120 responses belong to Region A, the same category represents a count of 60 or a share of 50%. Use the same question and filter selections when comparing these values.
This feature is available with the following licenses :
Team Edition Research Edition Communities Customer Experience Employee Experience
