


Advanced Cross-Tabulation in QuestionPro BI
The Advanced Cross-Tabulation Report in QuestionPro BI is designed to help you uncover deeper insights from your survey data. With just a few clicks, you can run cross-tabulations across multiple questions or custom variables, apply advanced analytics like Chi-Square and proportion tests, and customize how results are displayed. Whether you’re preparing a quick snapshot or a detailed analysis, this feature makes it easy to explore relationships in your data and integrate reports seamlessly into your BI dashboards.
Click to download the videoTo add an advanced cross-tabulation report, follow these steps:
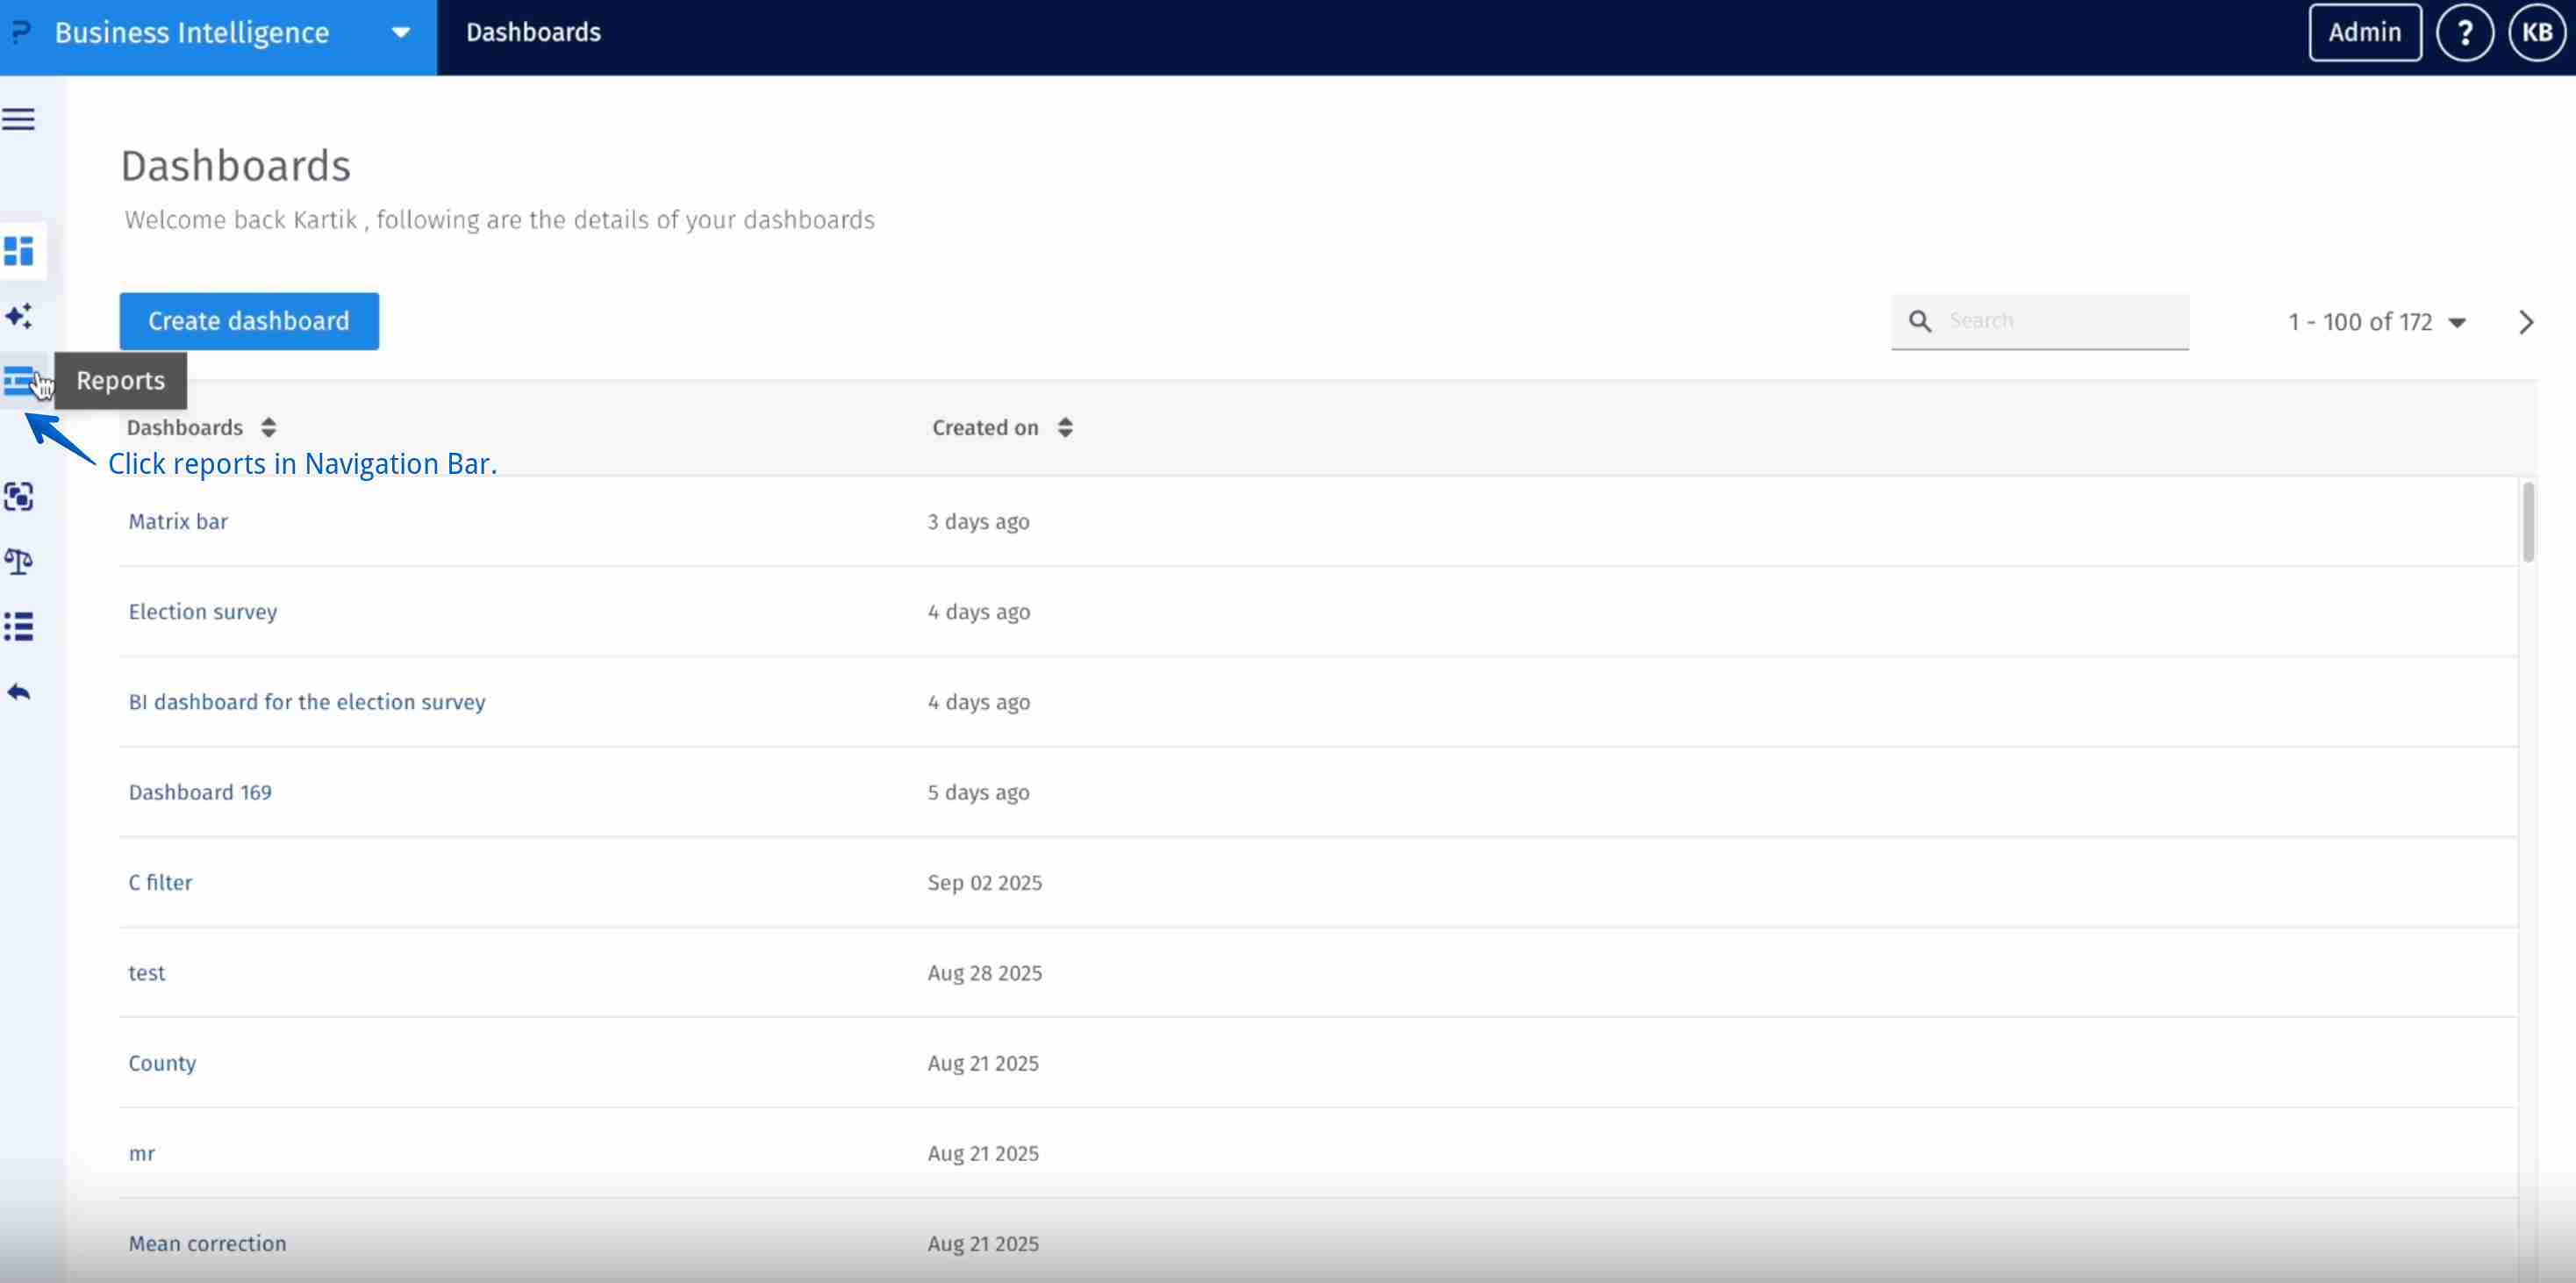
- Navigate to Reports.
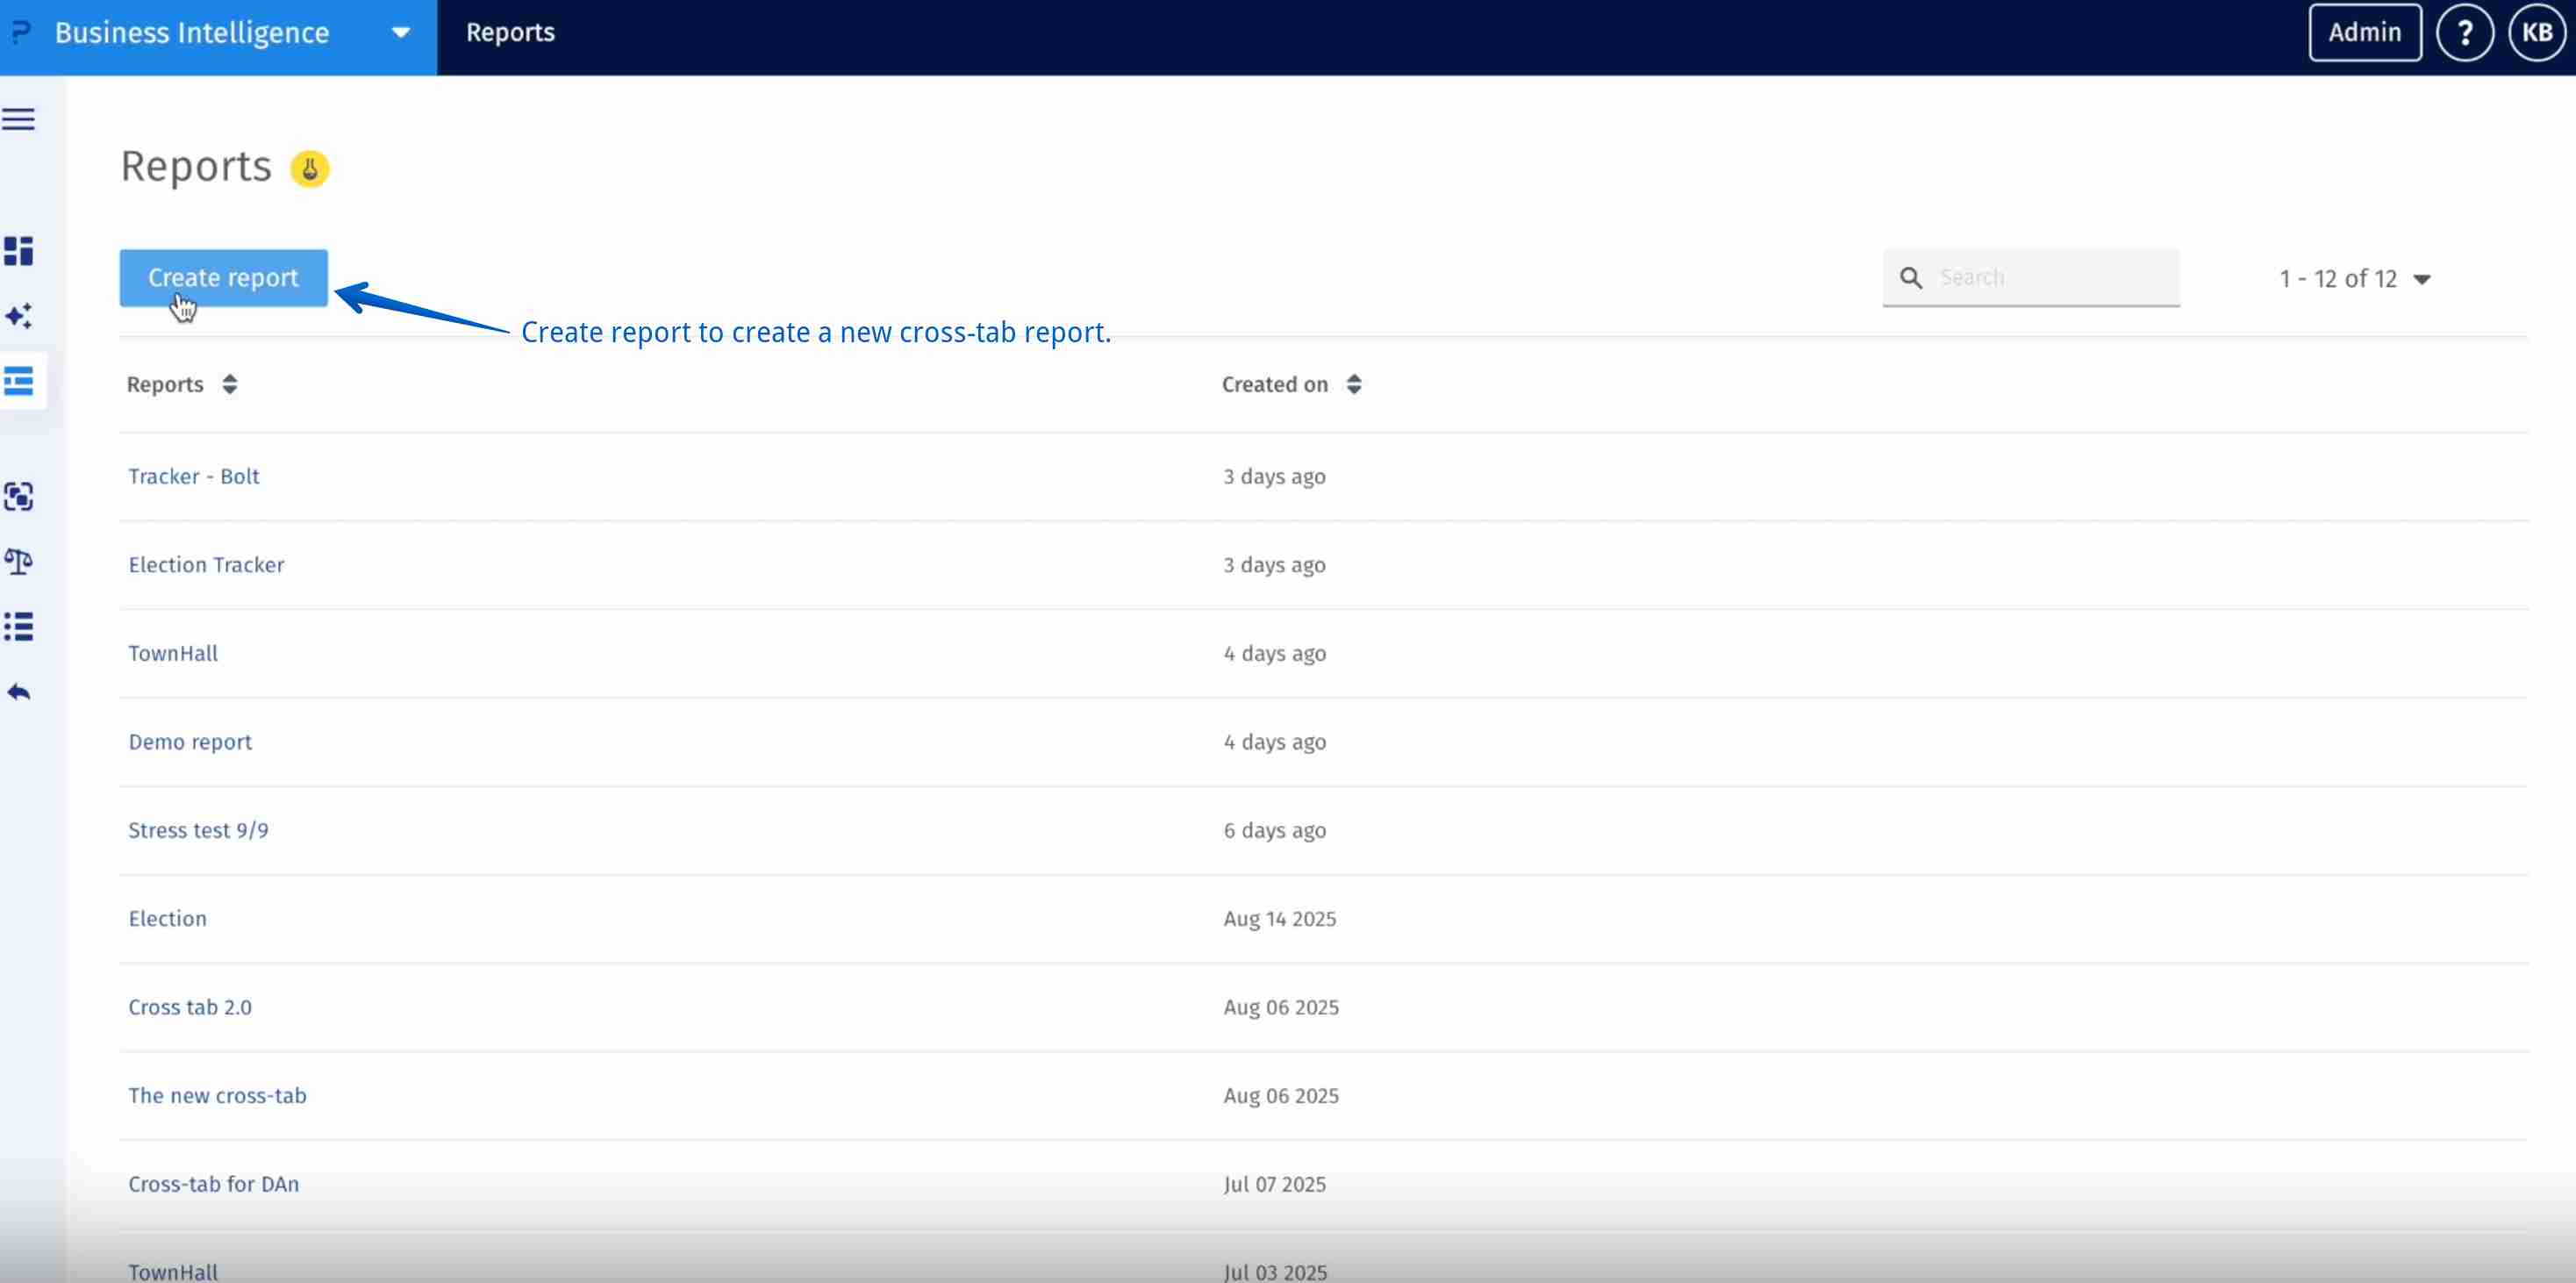
- Select Create report
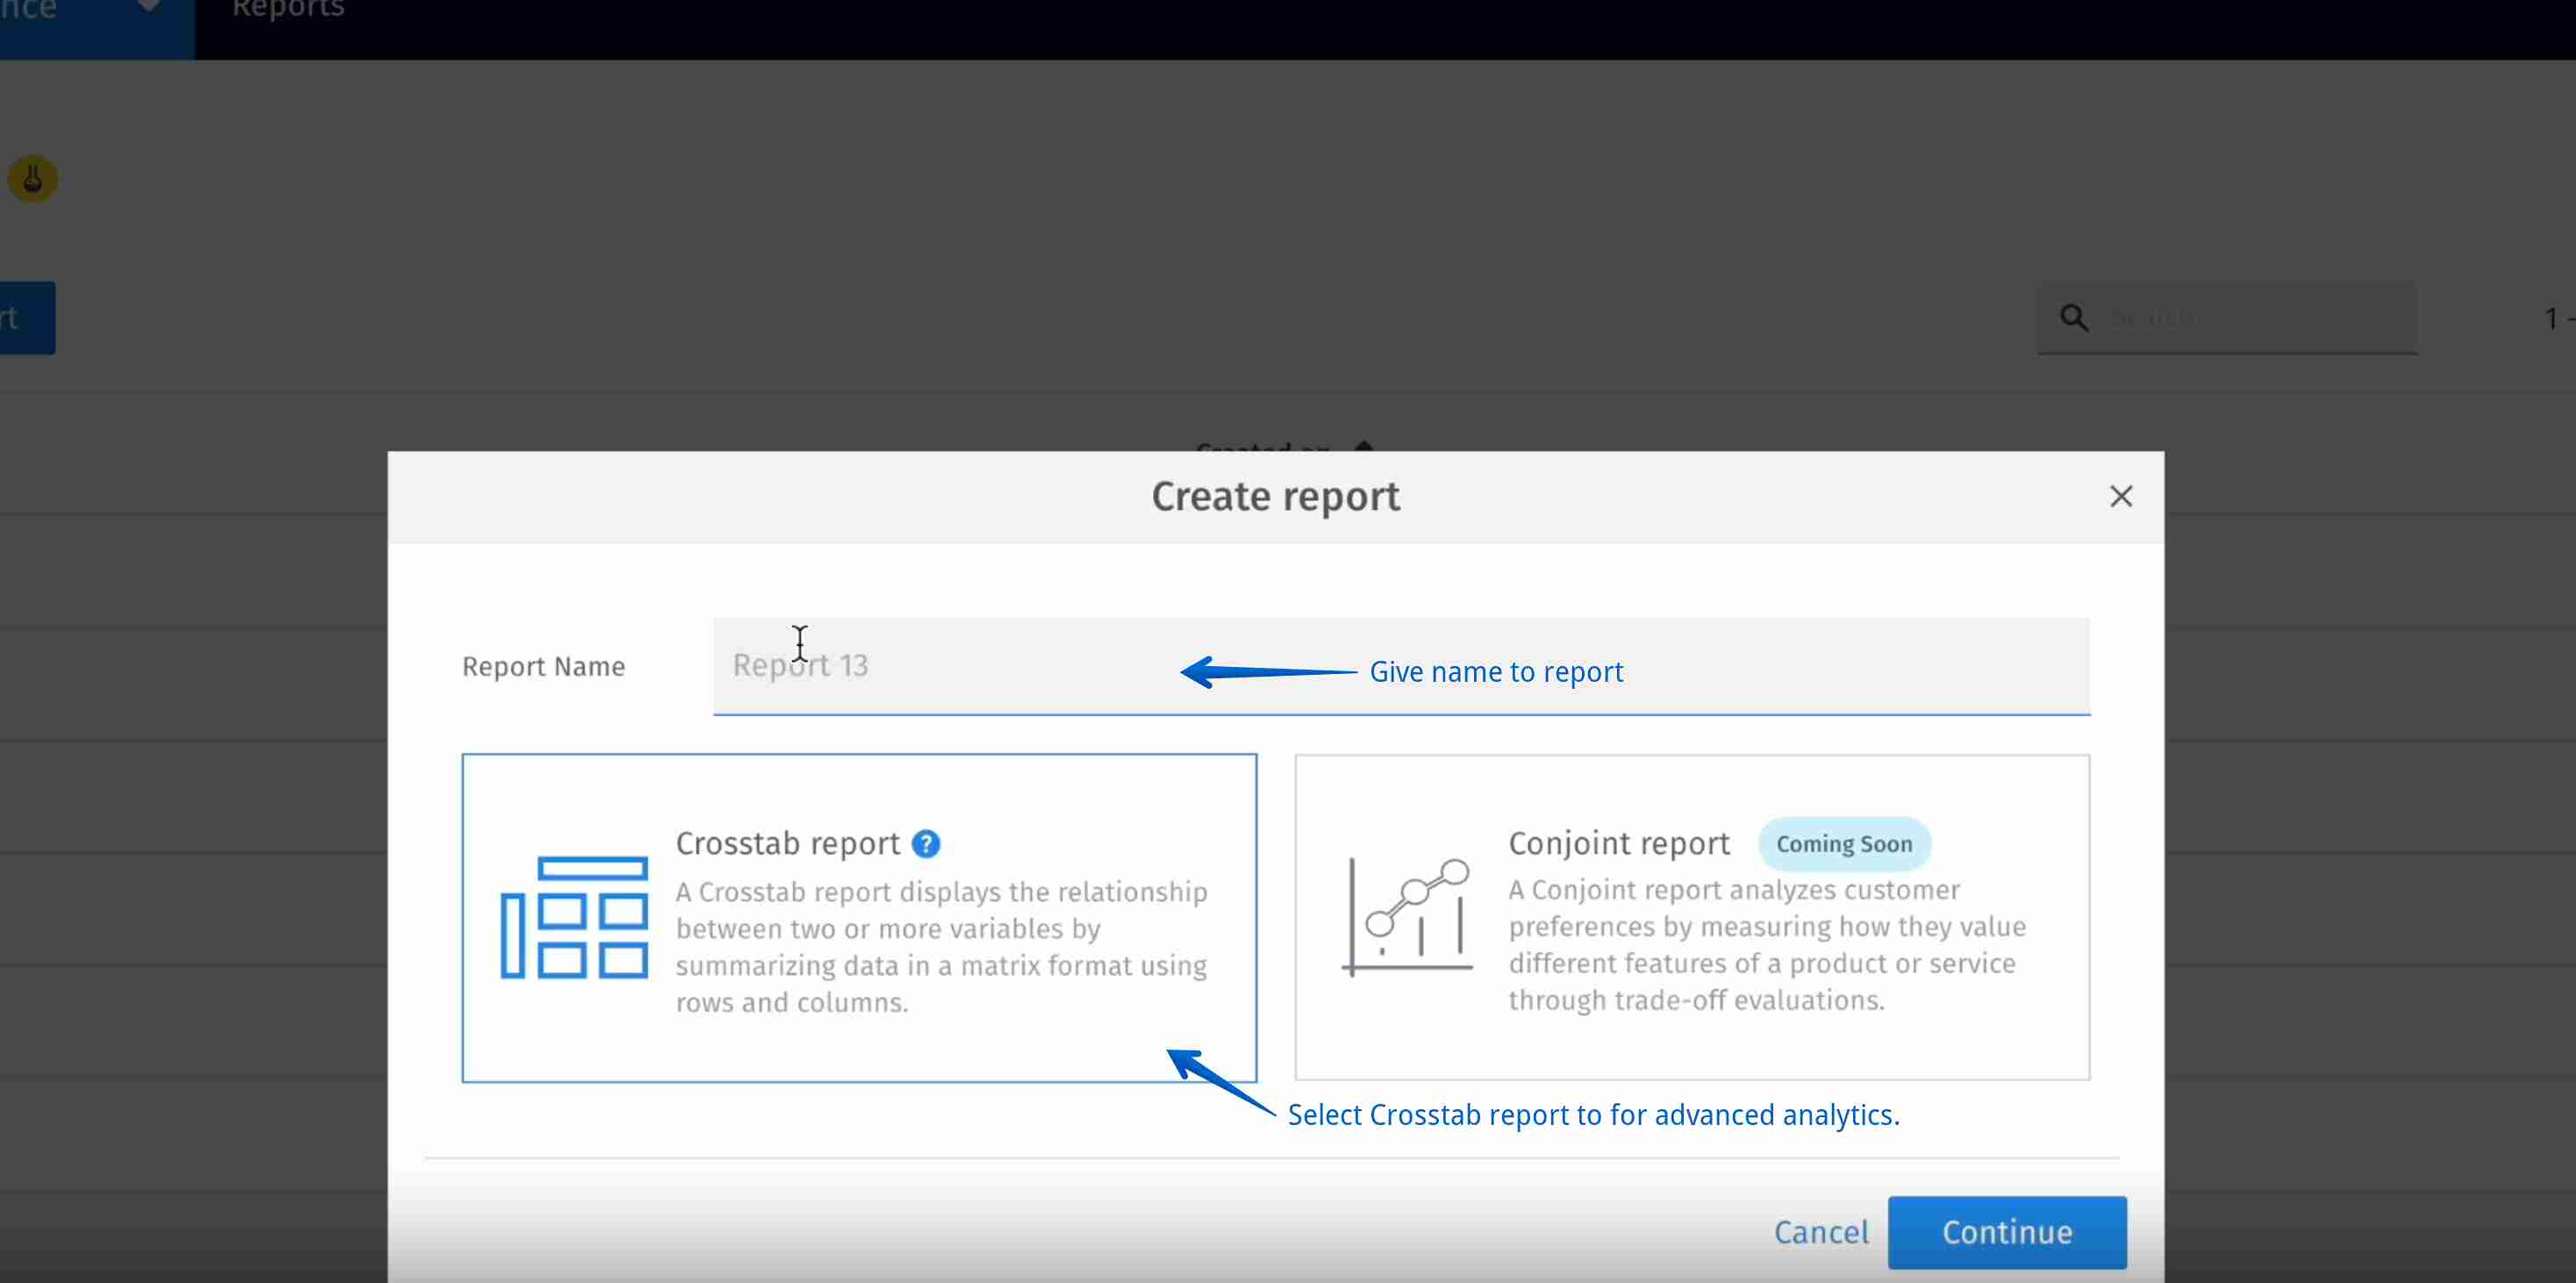
- Select crosstab report and give report name
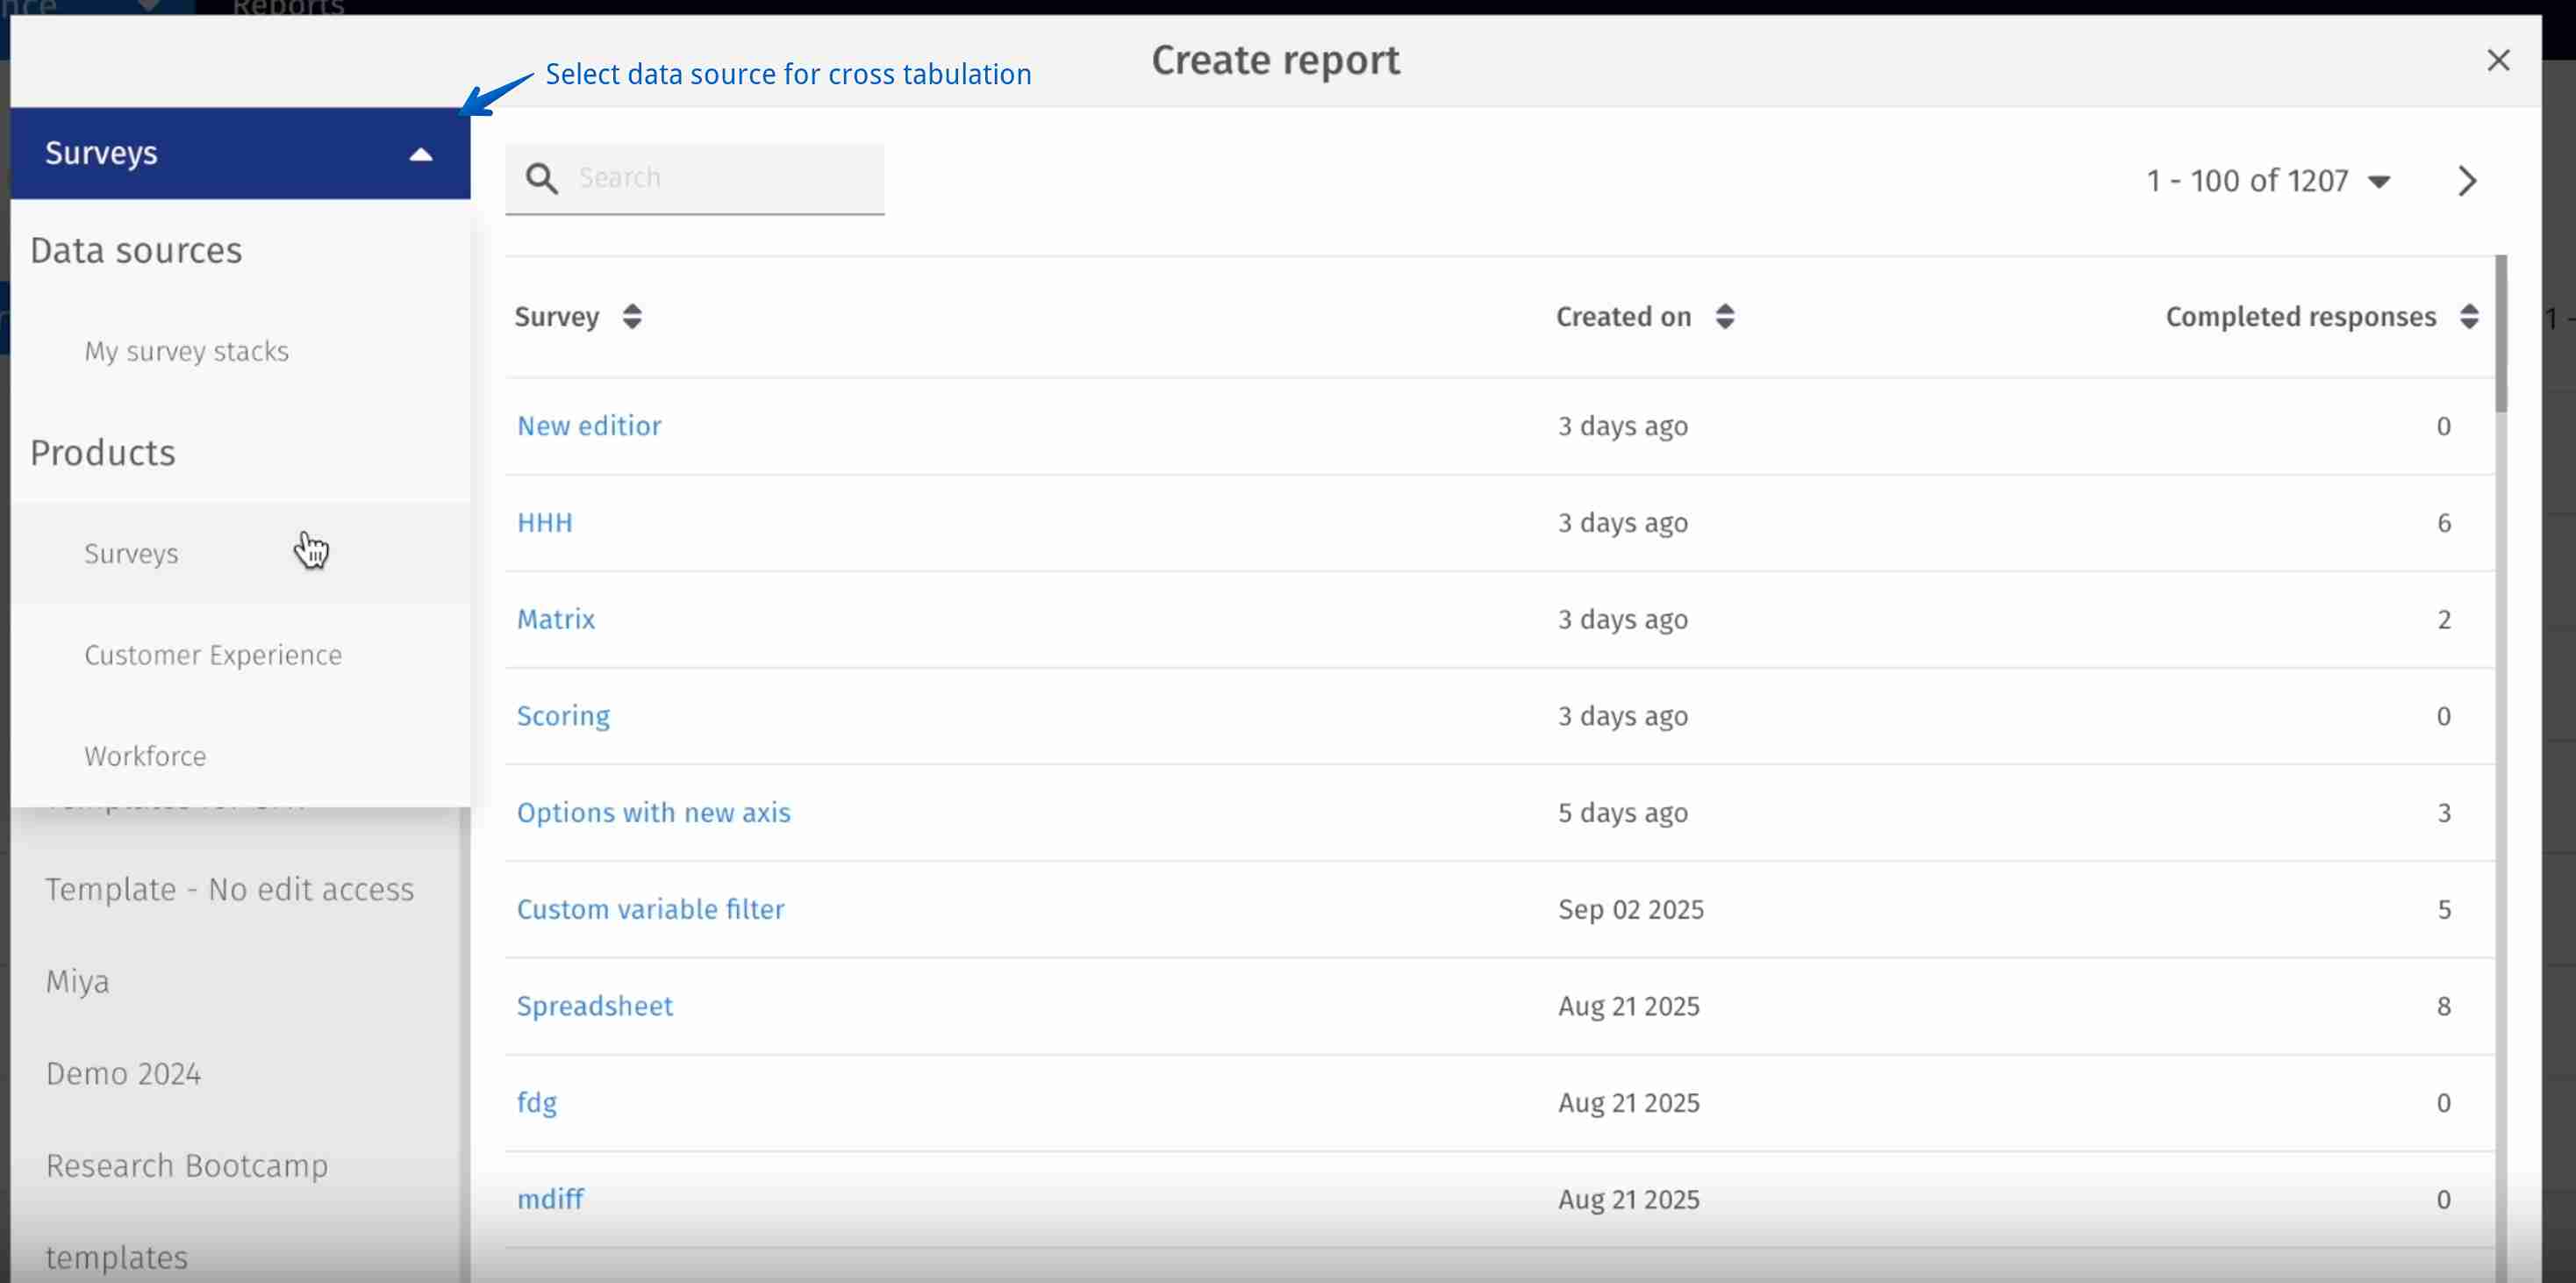
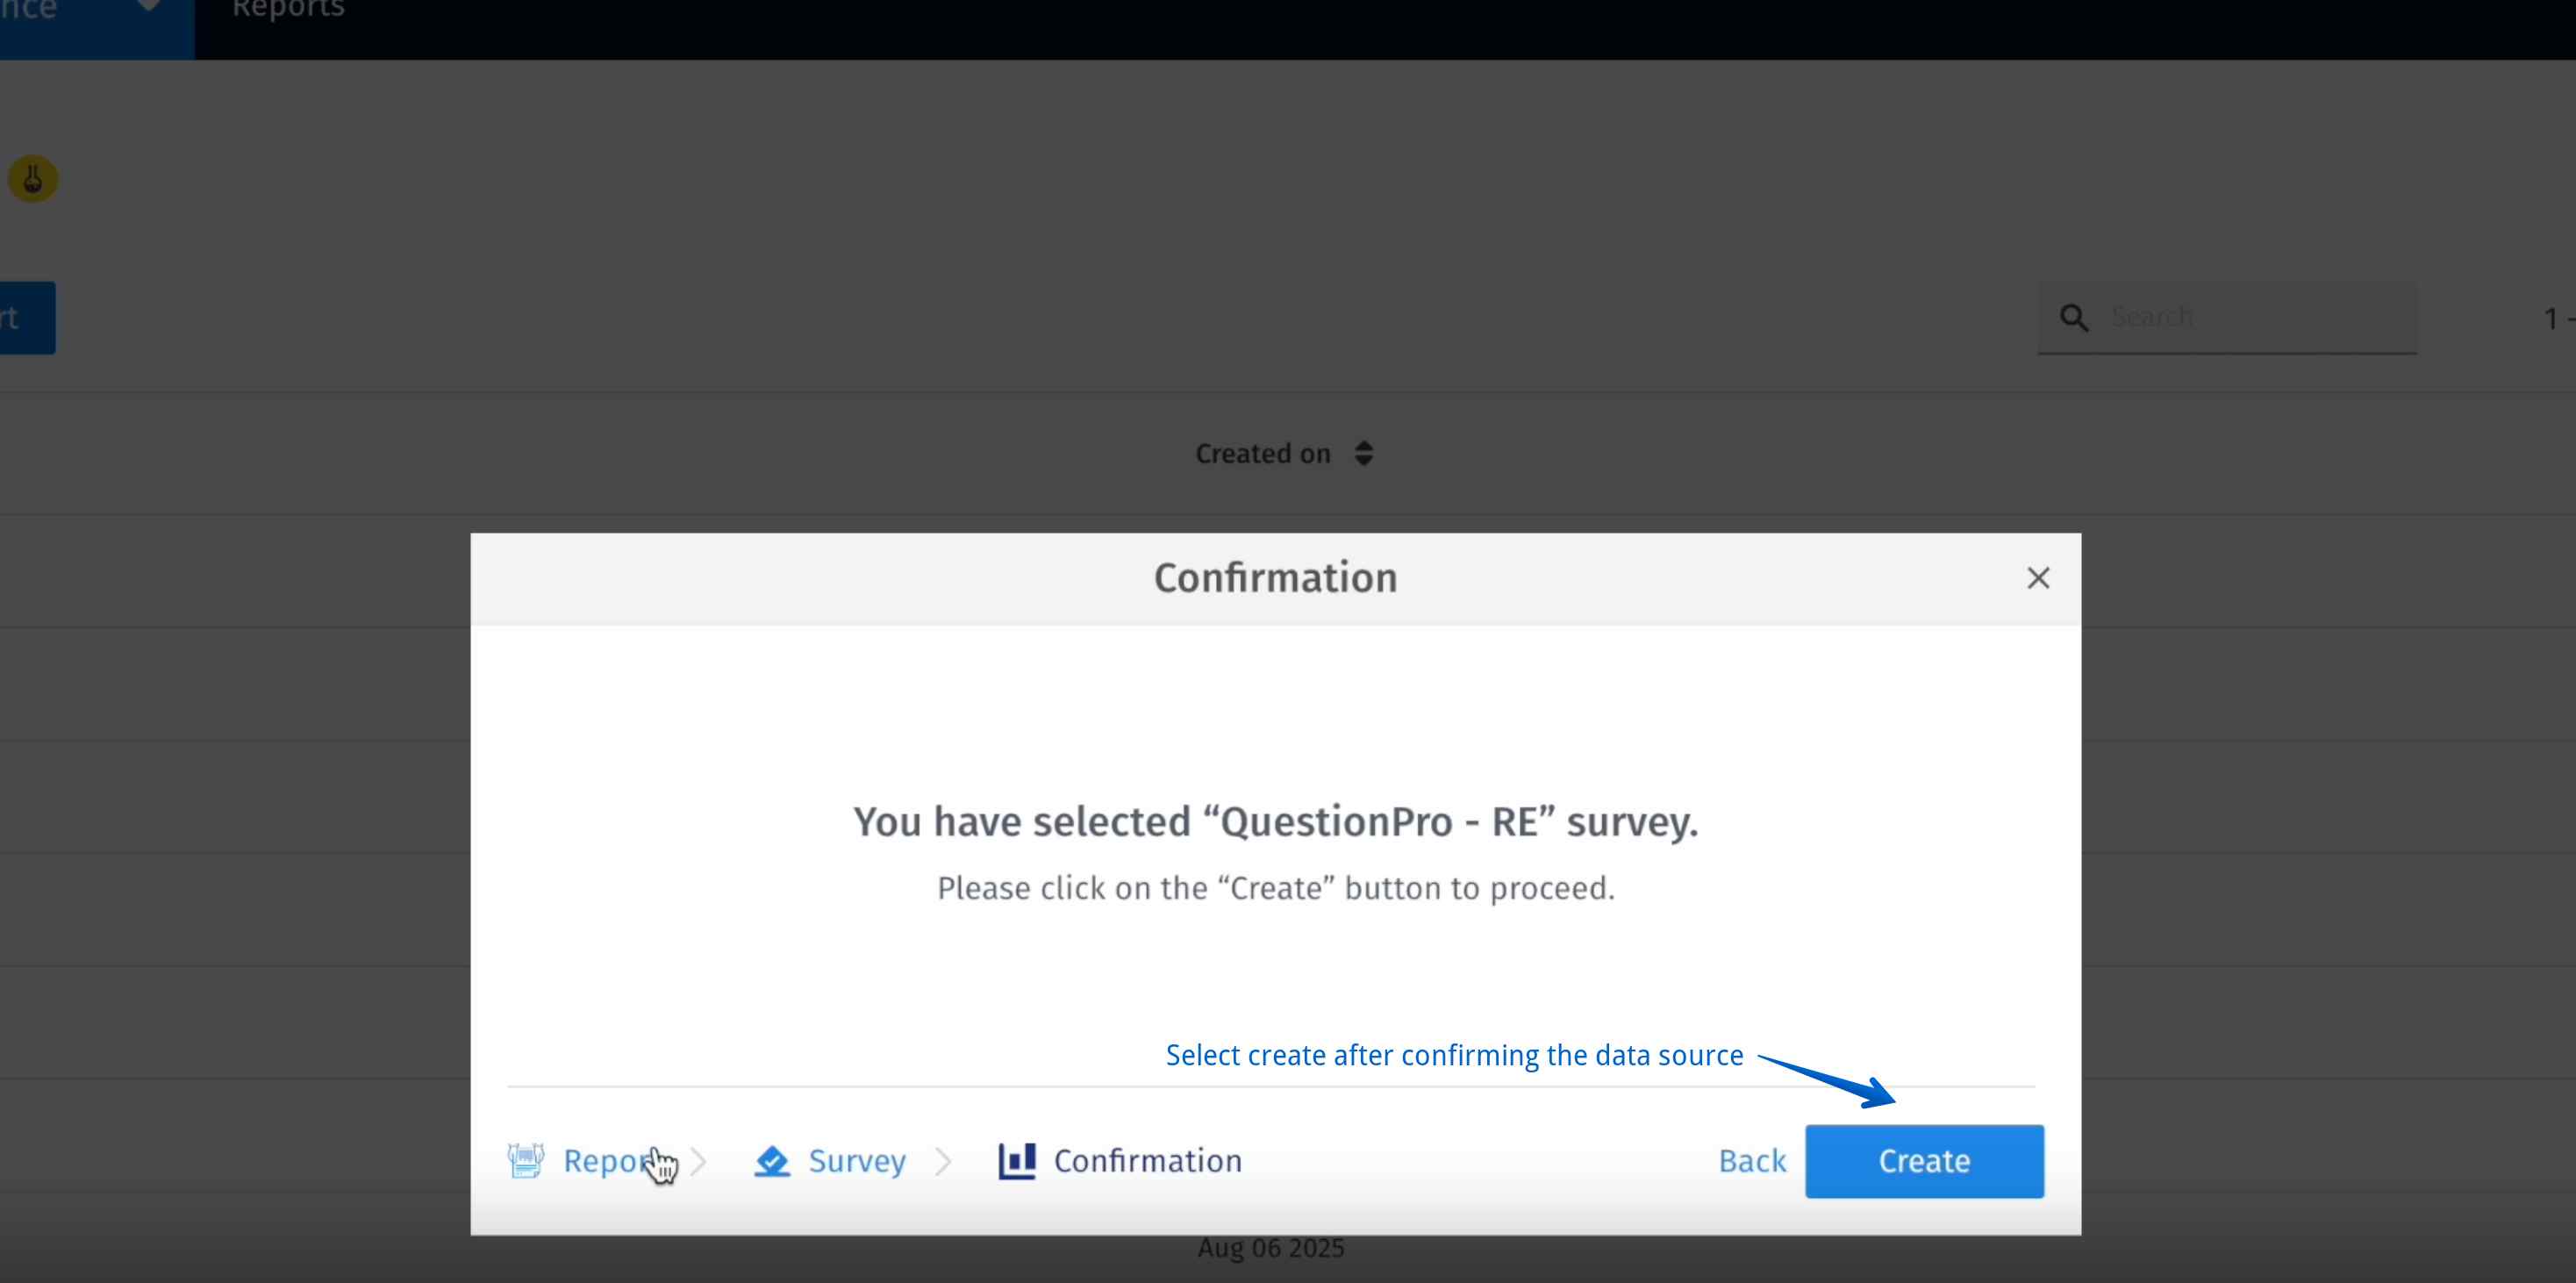
- Select a data source for the cross-tab
- Confirm data source » Create
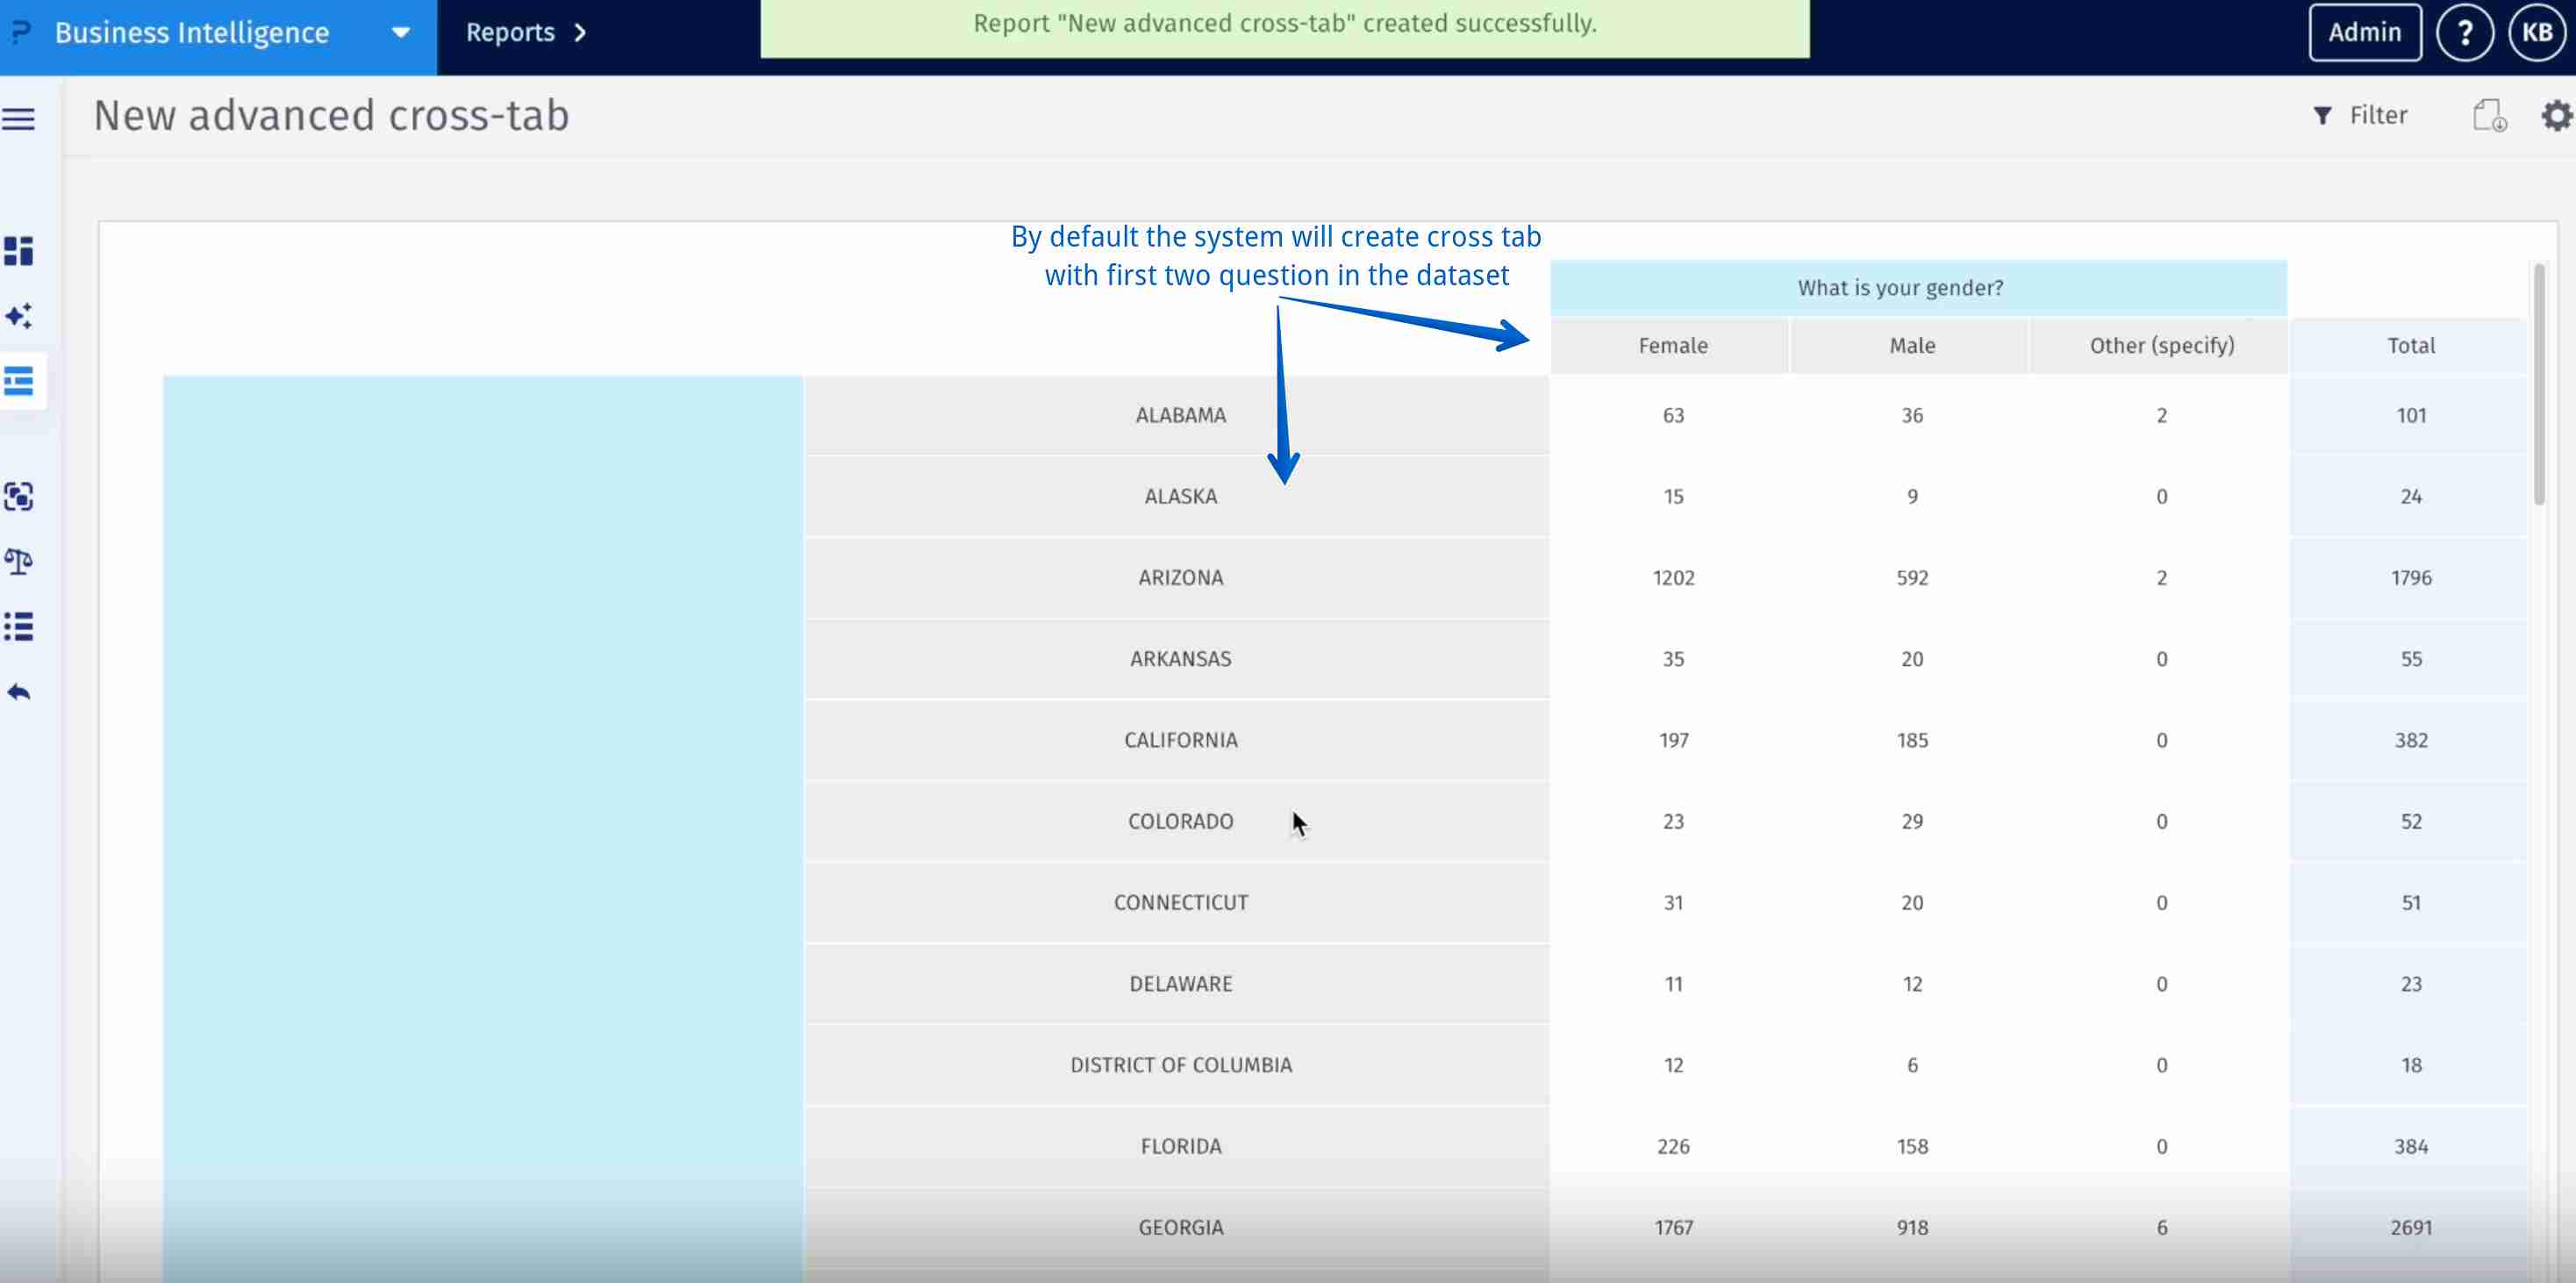
Once created, a default report will be genarated with first two variables from the selected dataset
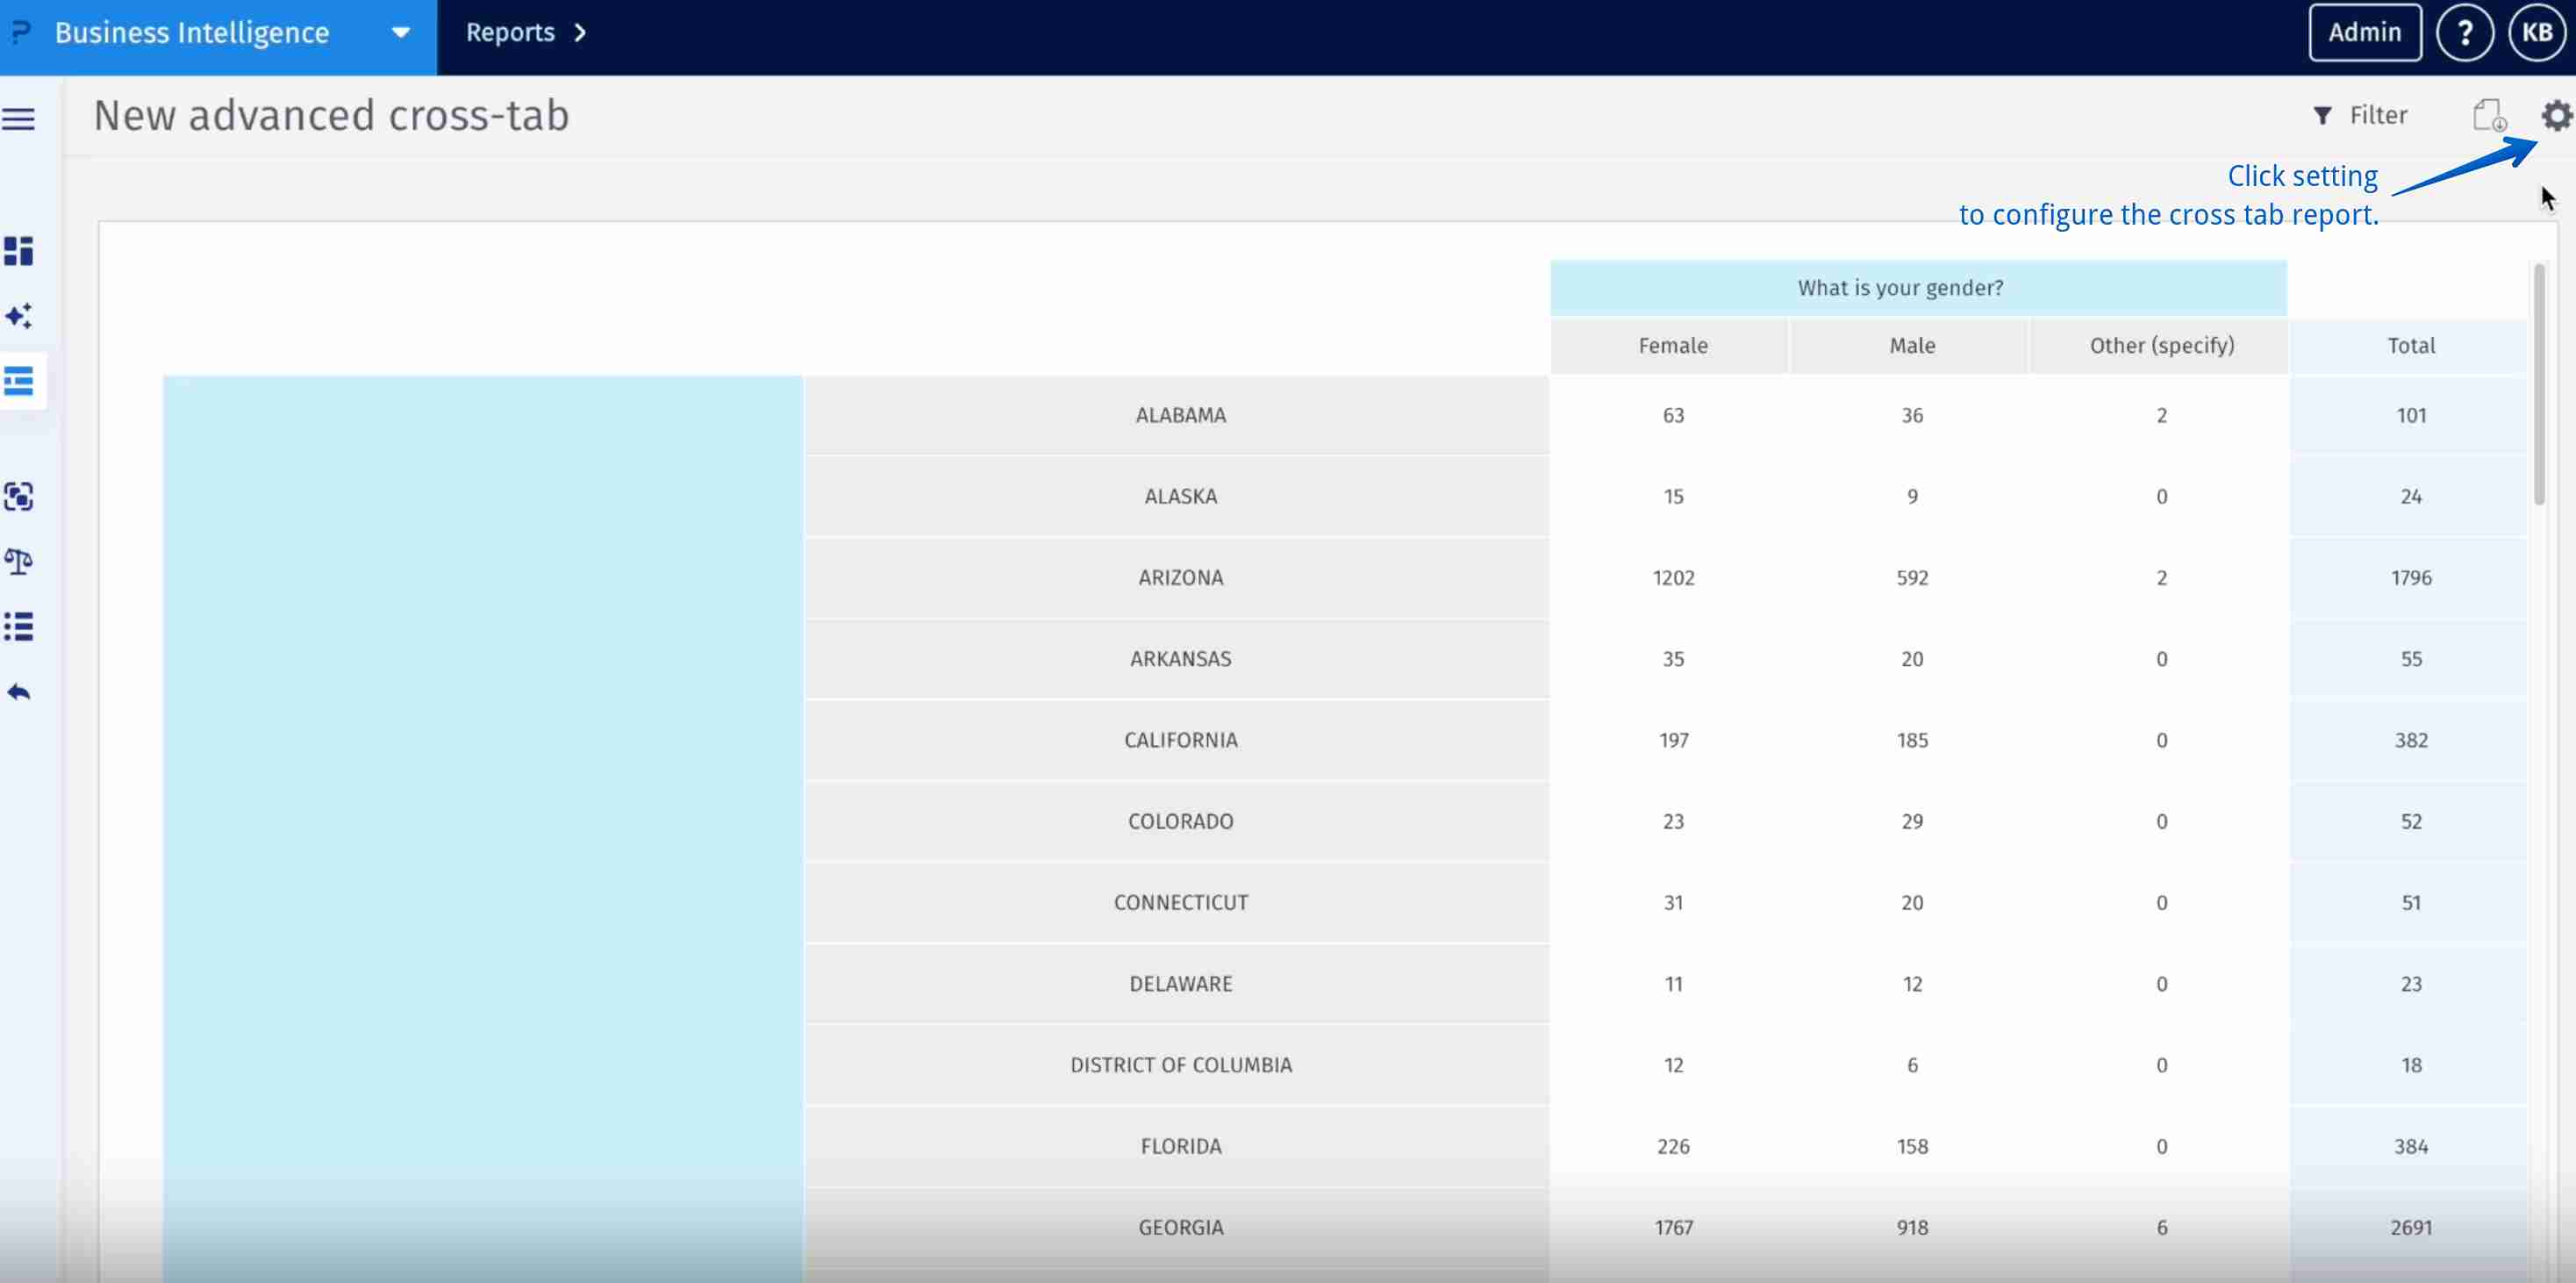
To configure the cross-tab:
- Select settings (top-right hand corner)
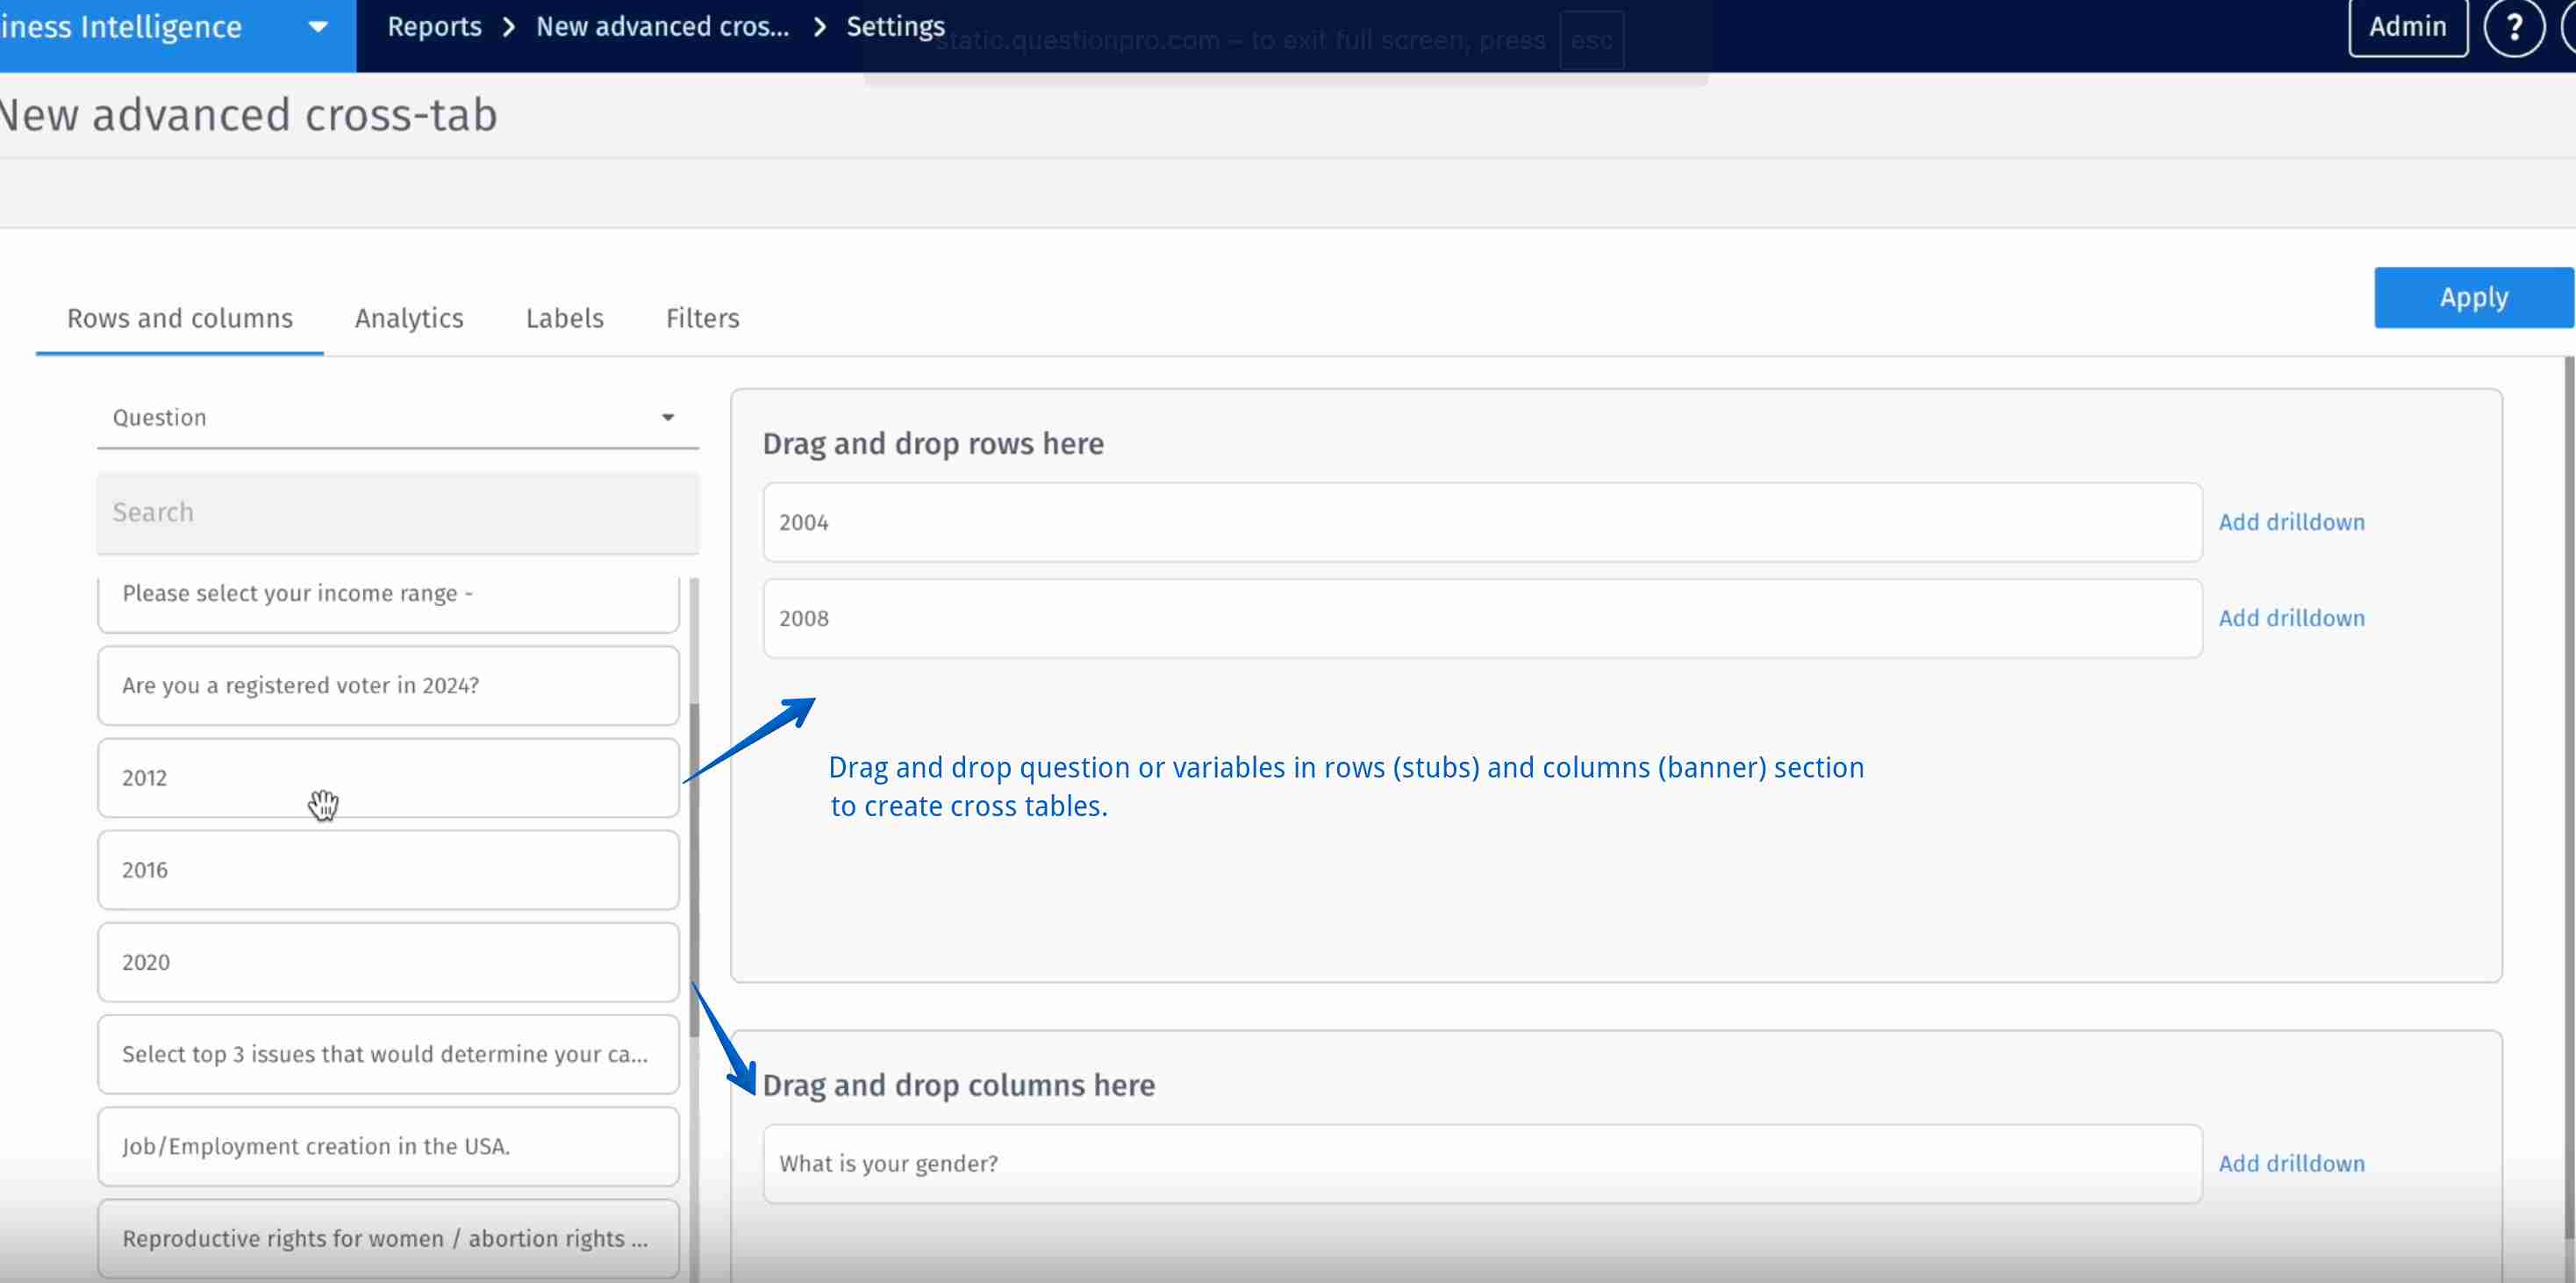
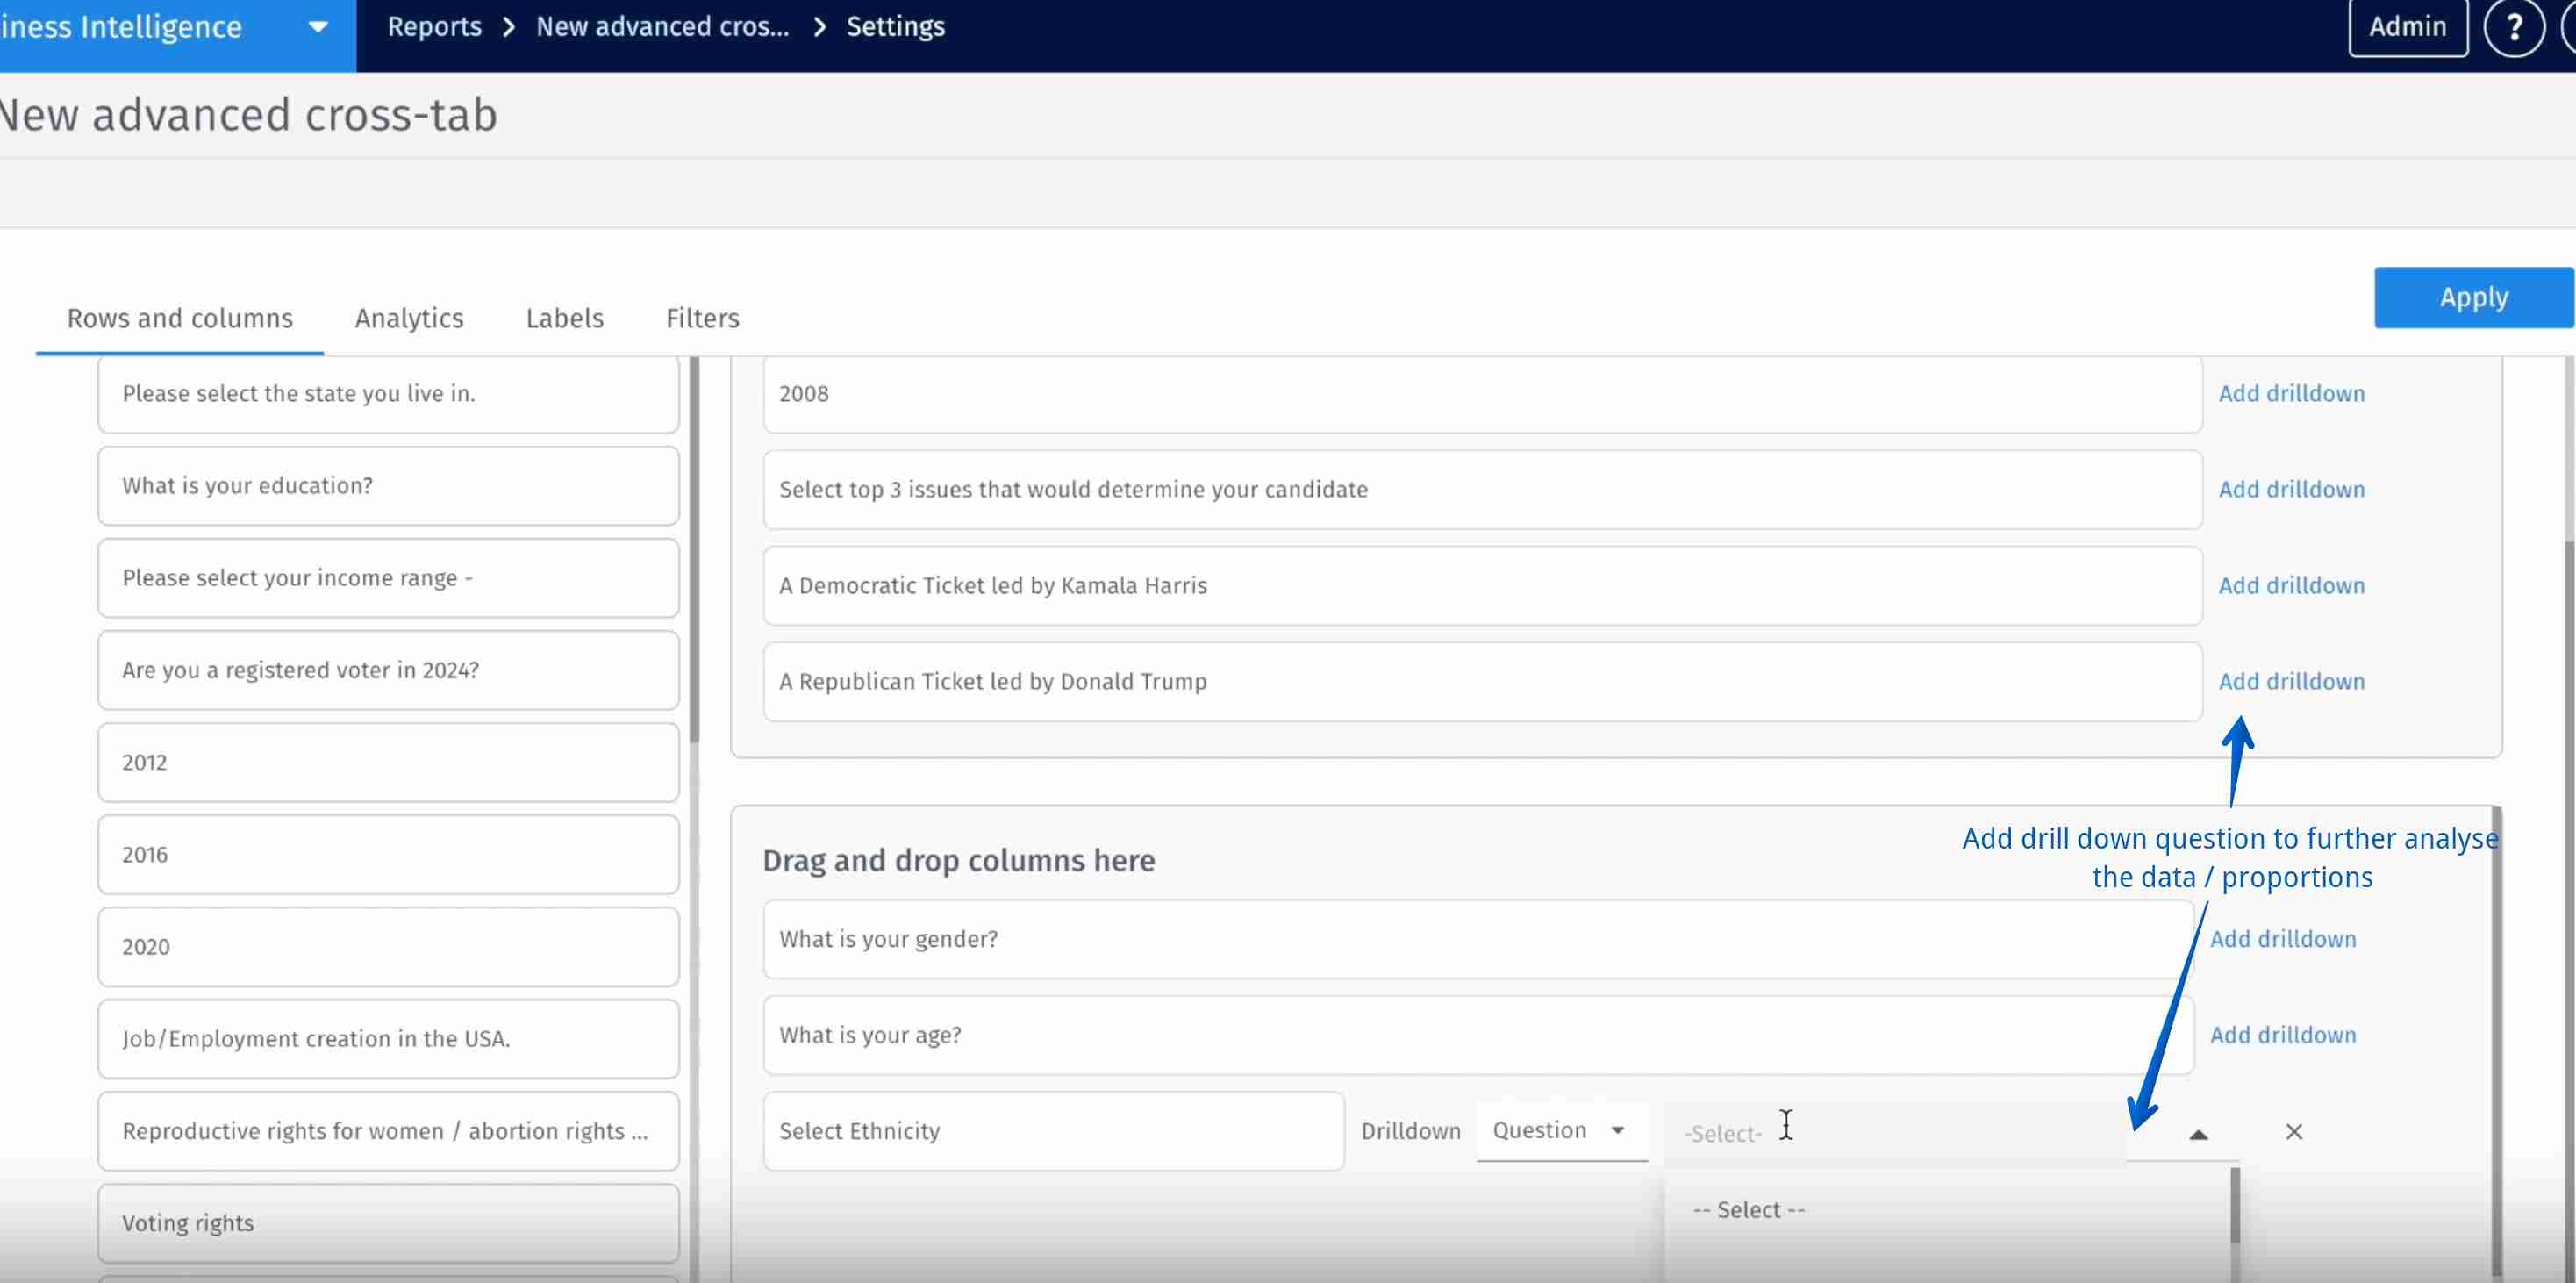
- Drag variables / questions from question list and drop them in rows (stubs) and columns (banner).
- Variables in cross-tab reports could be further drilled down by selecting questions or BI variables from the drop-down.
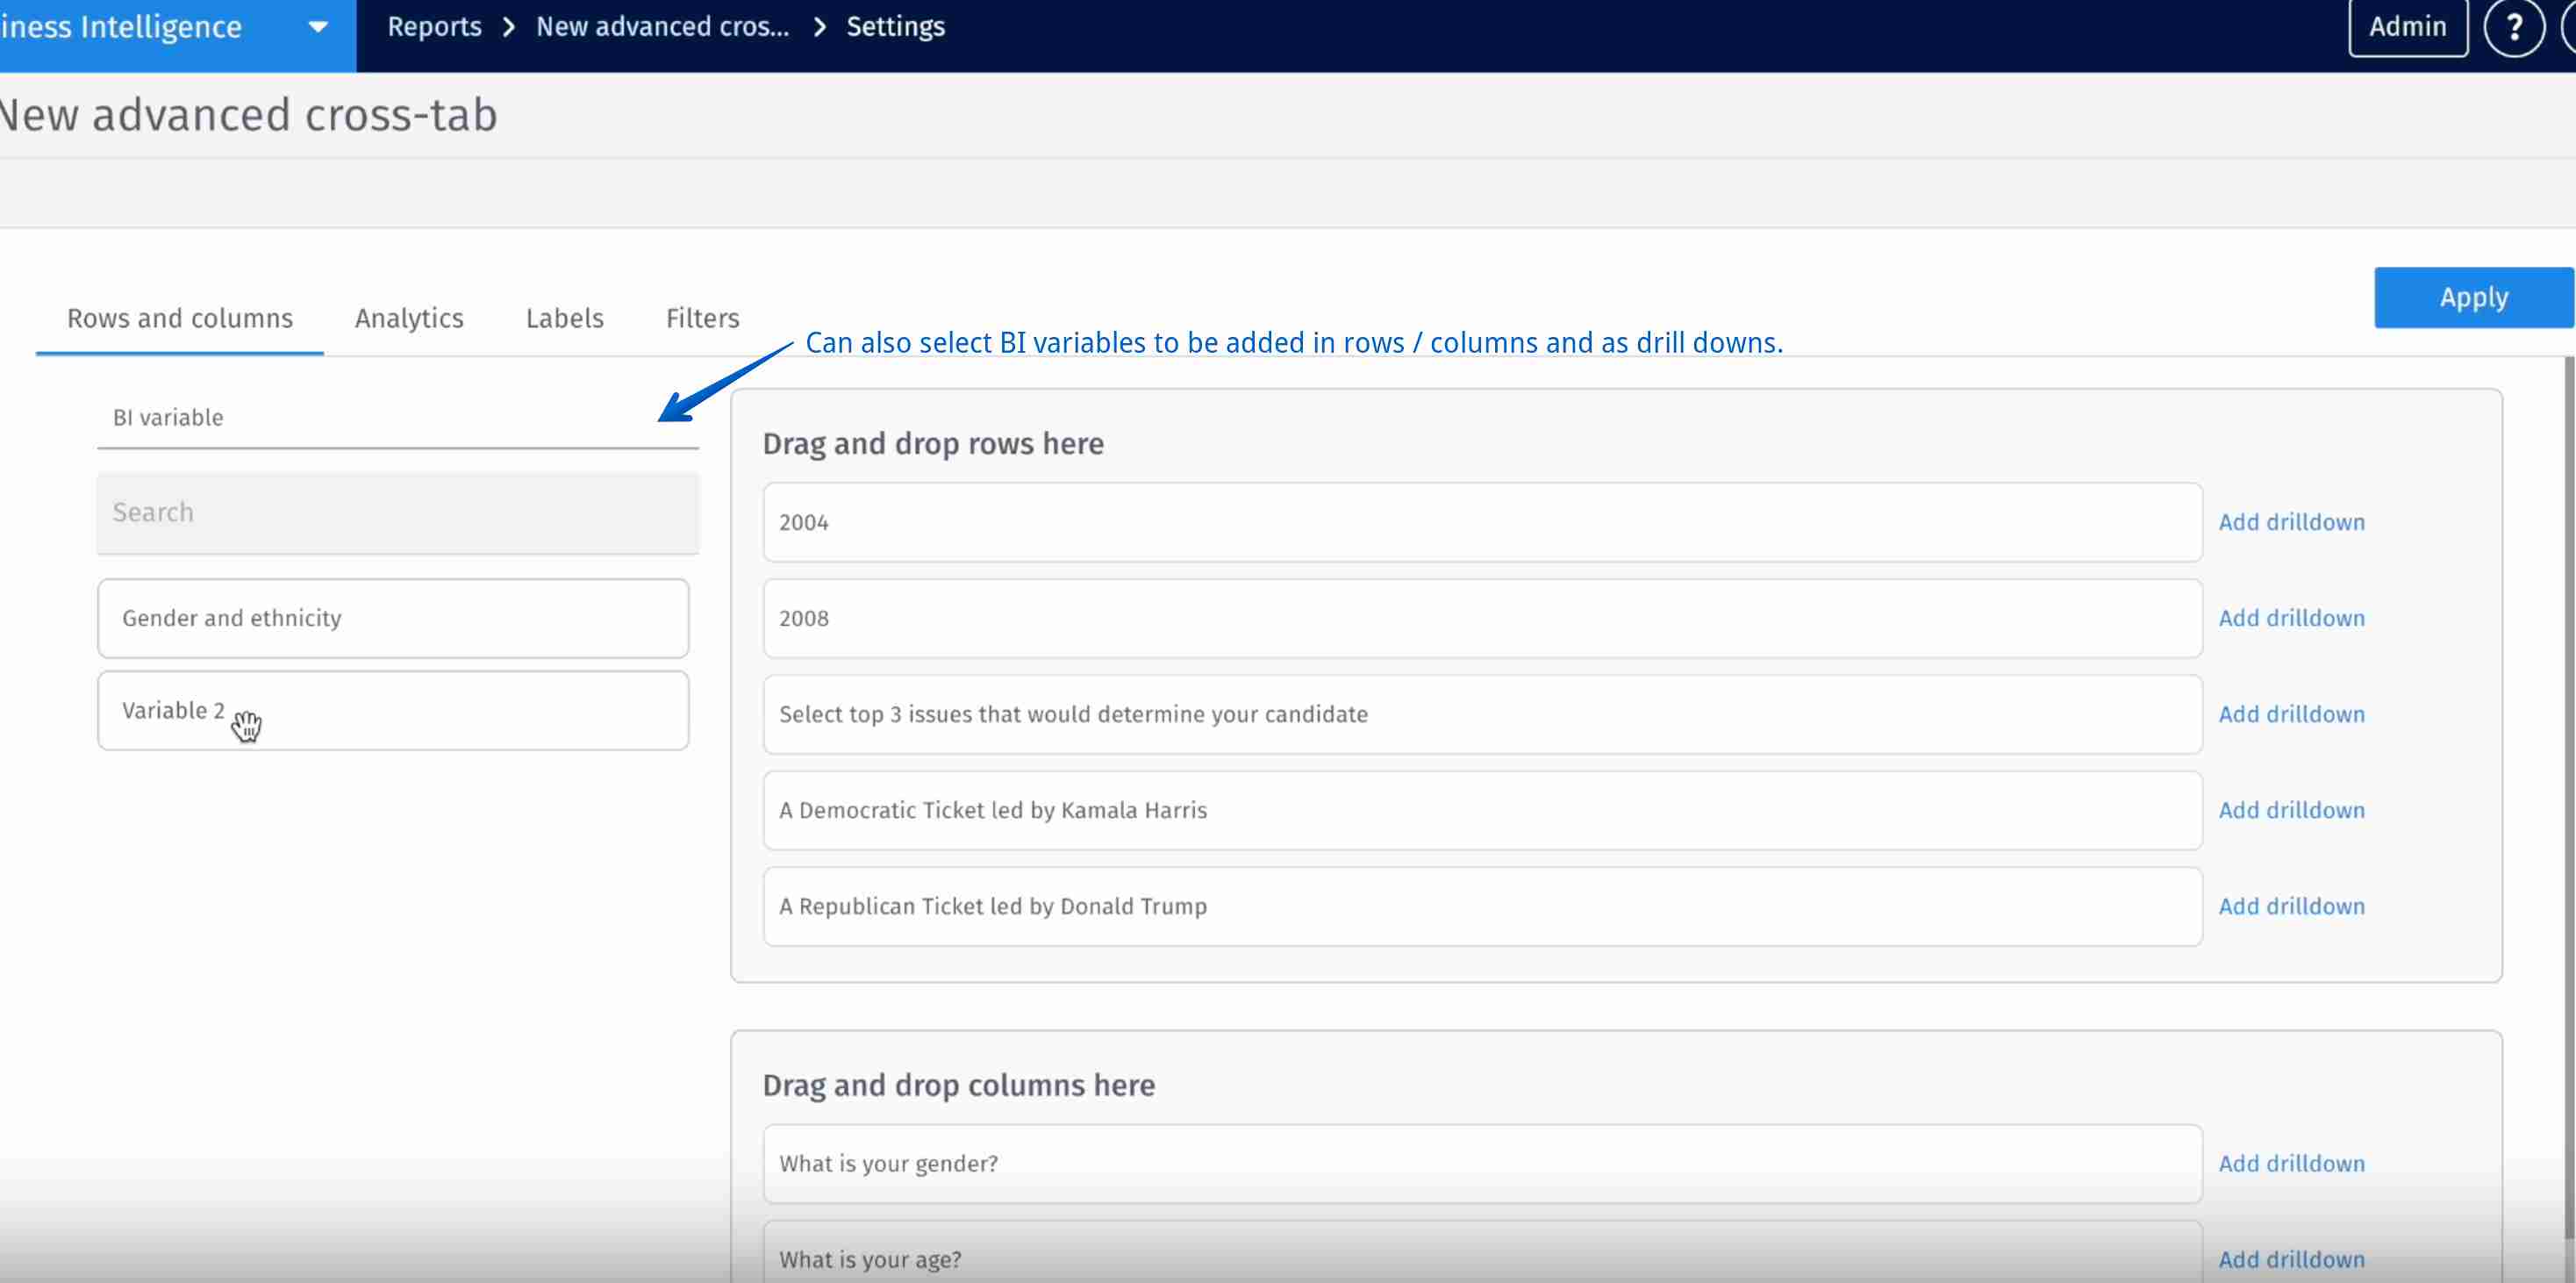
- BI variables could also be added to the cross-tab as Stubs (rows) or Banners (columns).
To add advanced analytics to the cross-tab:
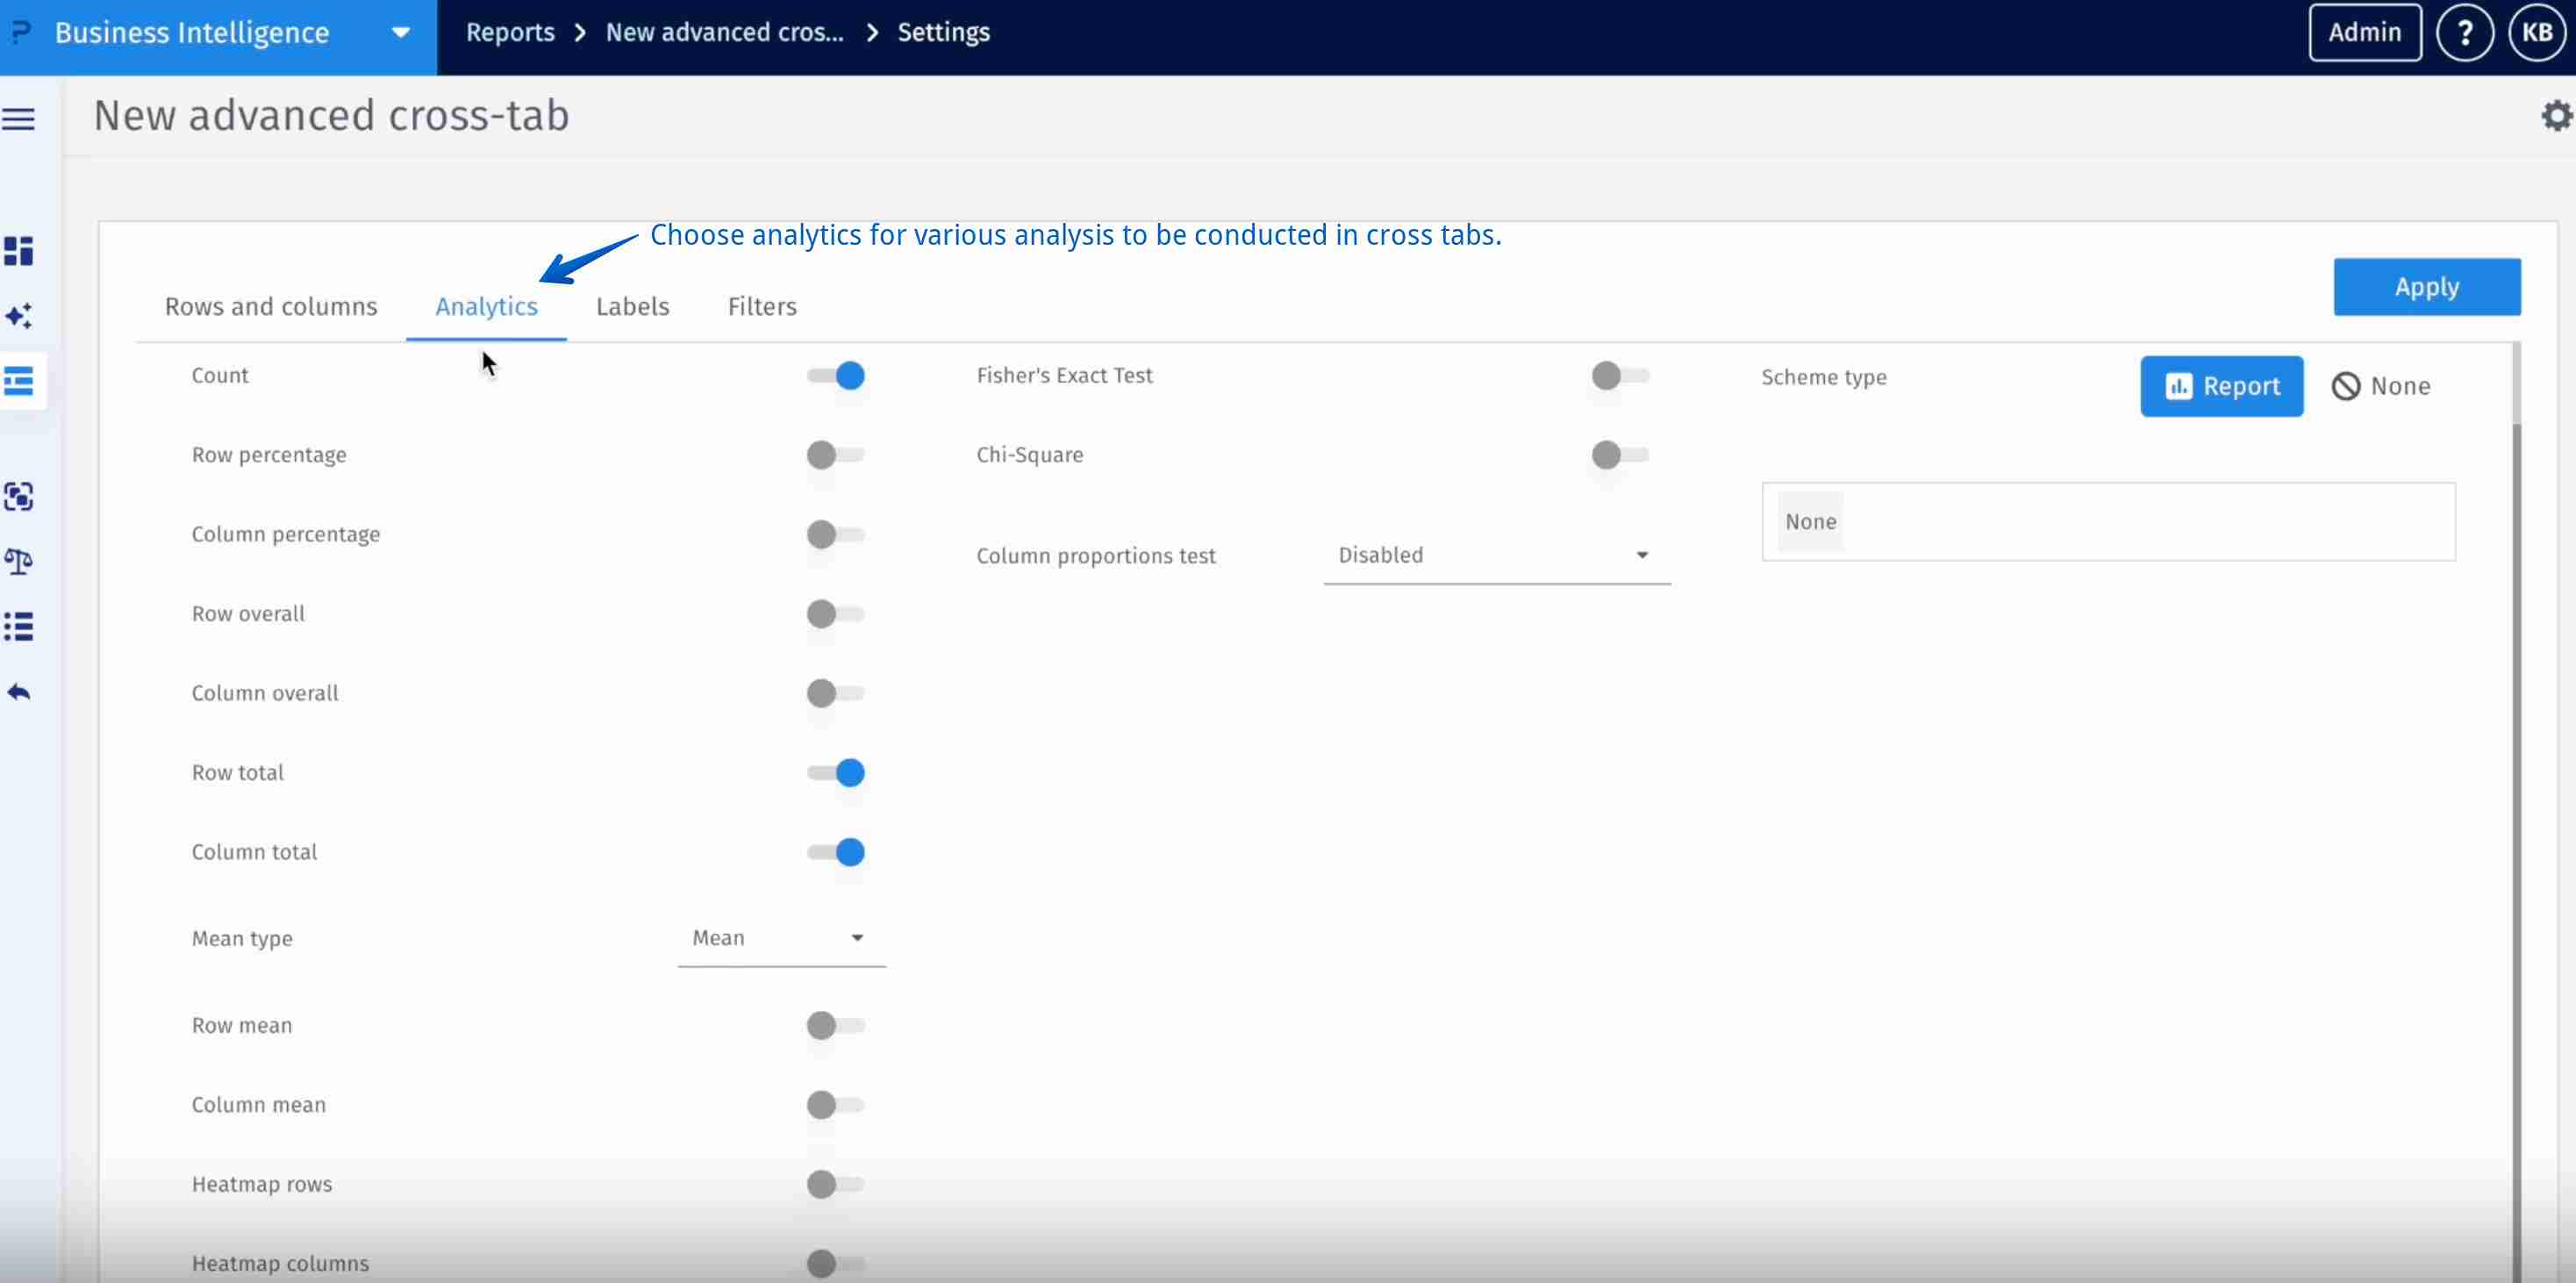
- In the Analytics tab, choose from the following analysis:
- Count: Number of responses (or respondents) in each cell.
- Row percentage: Proportion of responses within a row distributed across columns (100% per row).
- Column percentage: Proportion of responses within each column relative to that column’s total.
- Row overall: Total responses or percentages across all columns for that specific row.
- Column overall: Distribution of responses across all rows within each column.
- Row total and Column total: Sum of all responses across rows/columns.
- Mean and Average: Arithmetic mean (sum/count) or average shown across categories to compare groups.
- Row and Column Mean: Average of values across all columns/rows.
- Row and Column heatmap: Highlights patterns and intensity with shading for quick trend spotting.
- Fisher's Exact Test: Tests non-random associations between two categorical variables (small sample sizes).
- Chi-Square: Tests whether differences between observed and expected frequencies across categories are statistically significant.
- Confidence Interval for proportion test: A confidence interval for a proportion test in cross-tabs gives the range of values within which the true population proportion is likely to fall, with a chosen level of confidence.
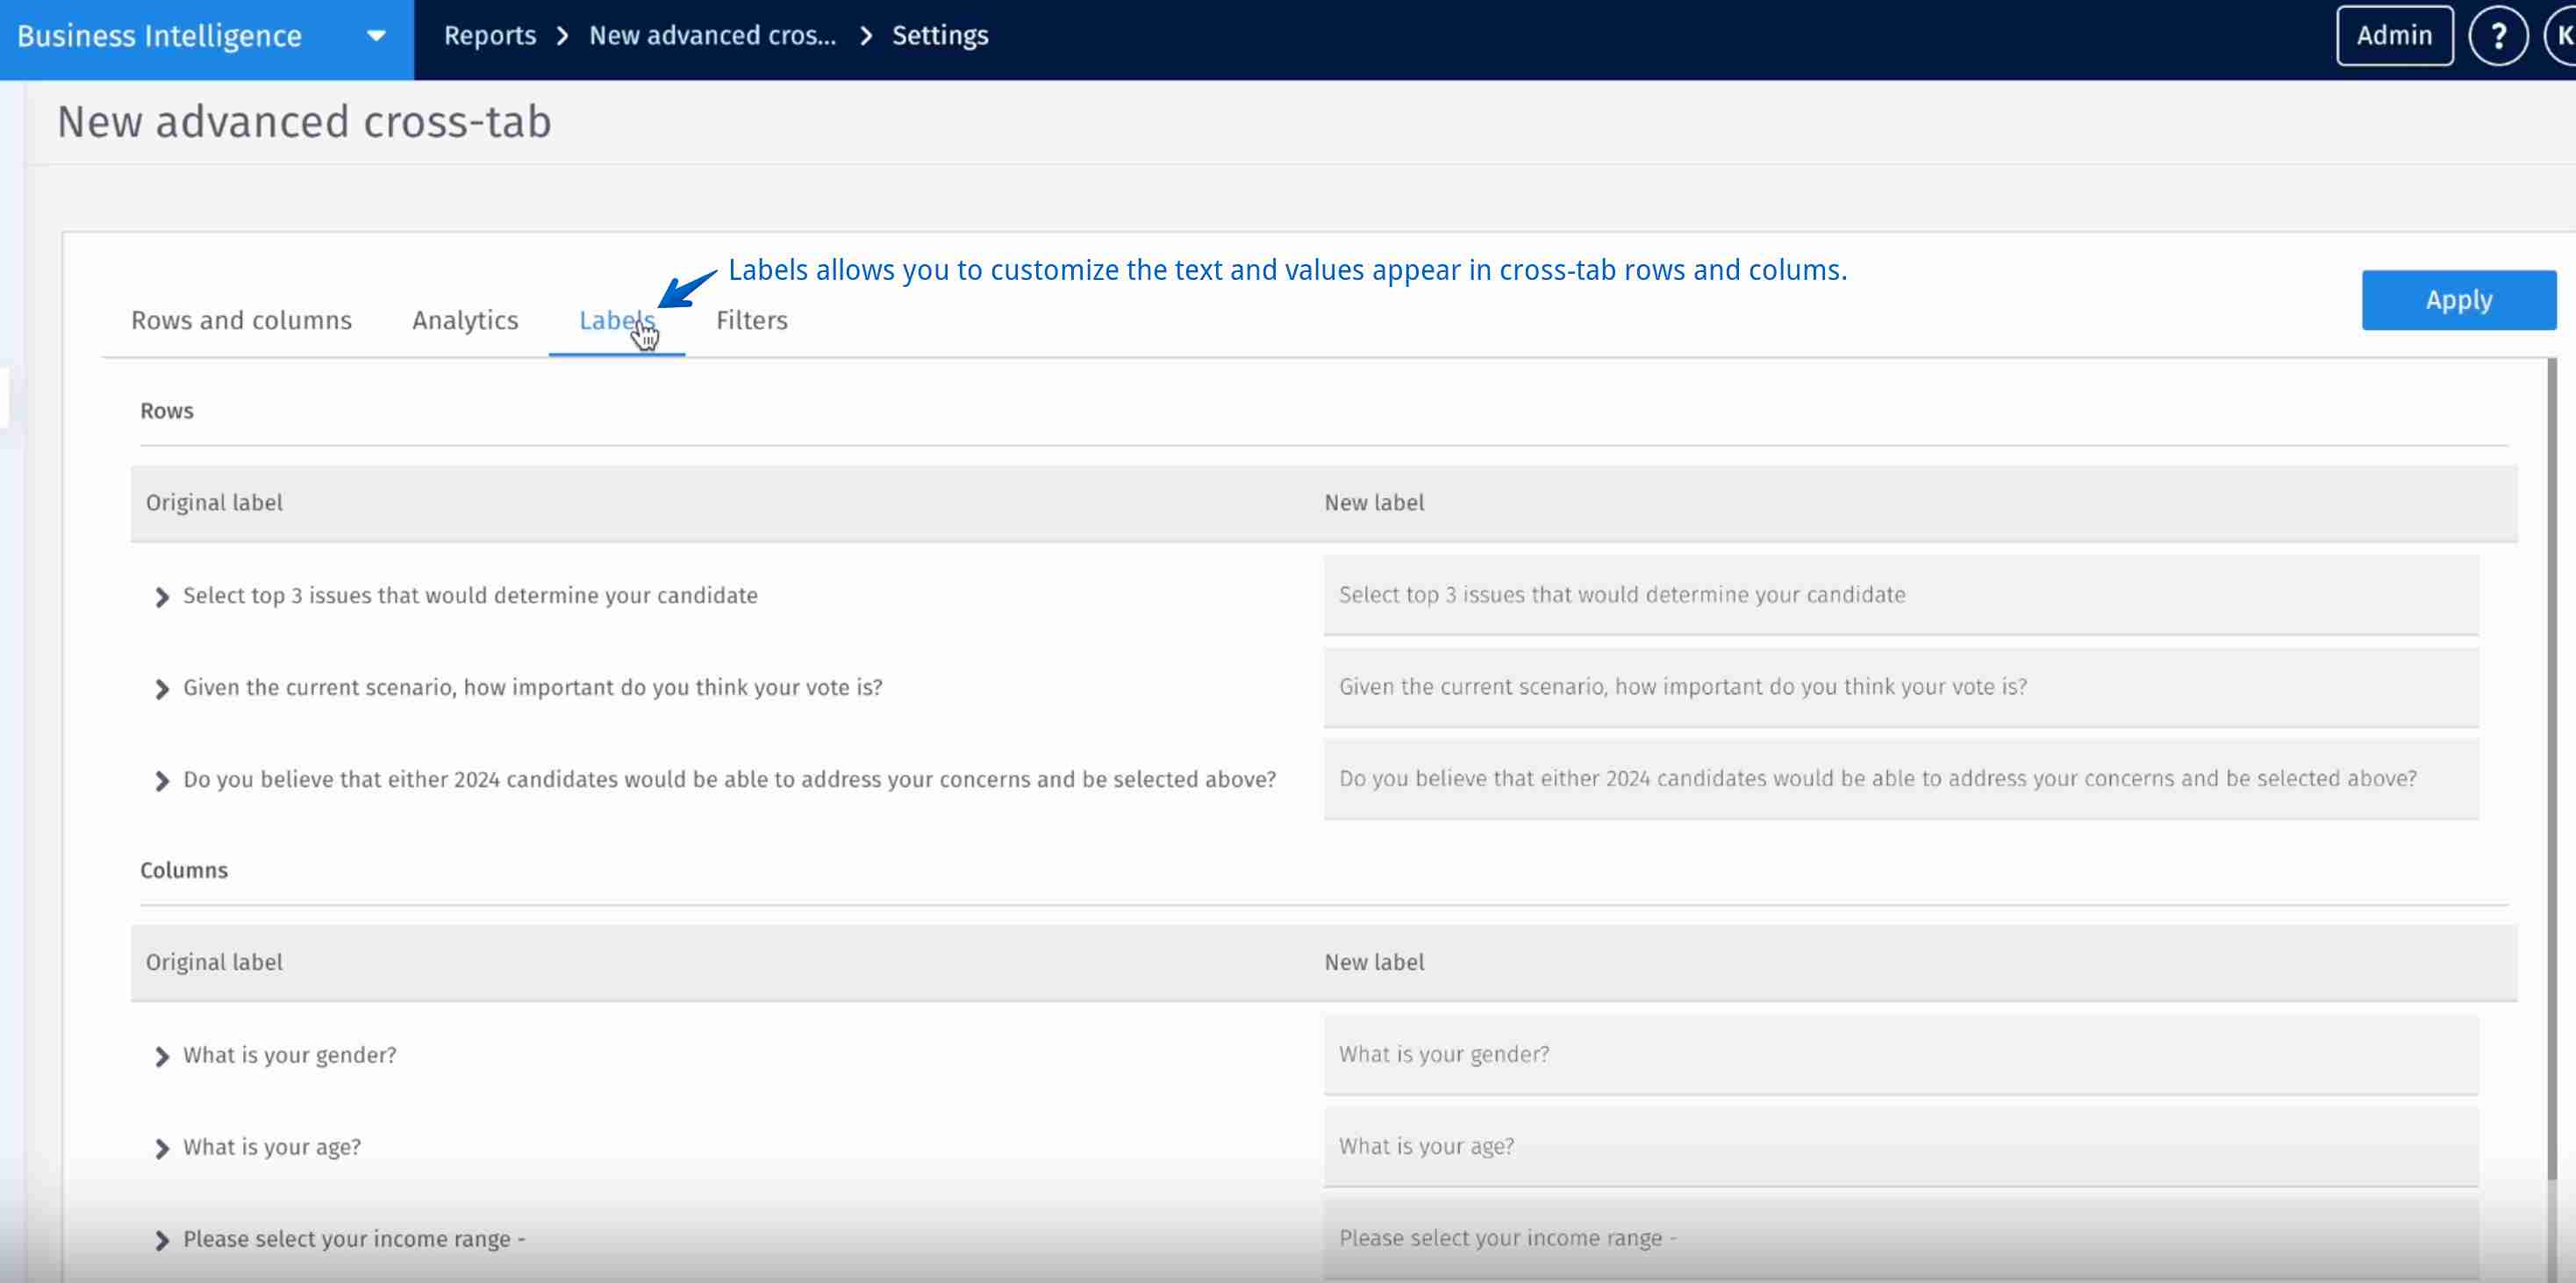
To customize labels in cross-tab:
- In the Labels tab customize text and label names in cross-tab.
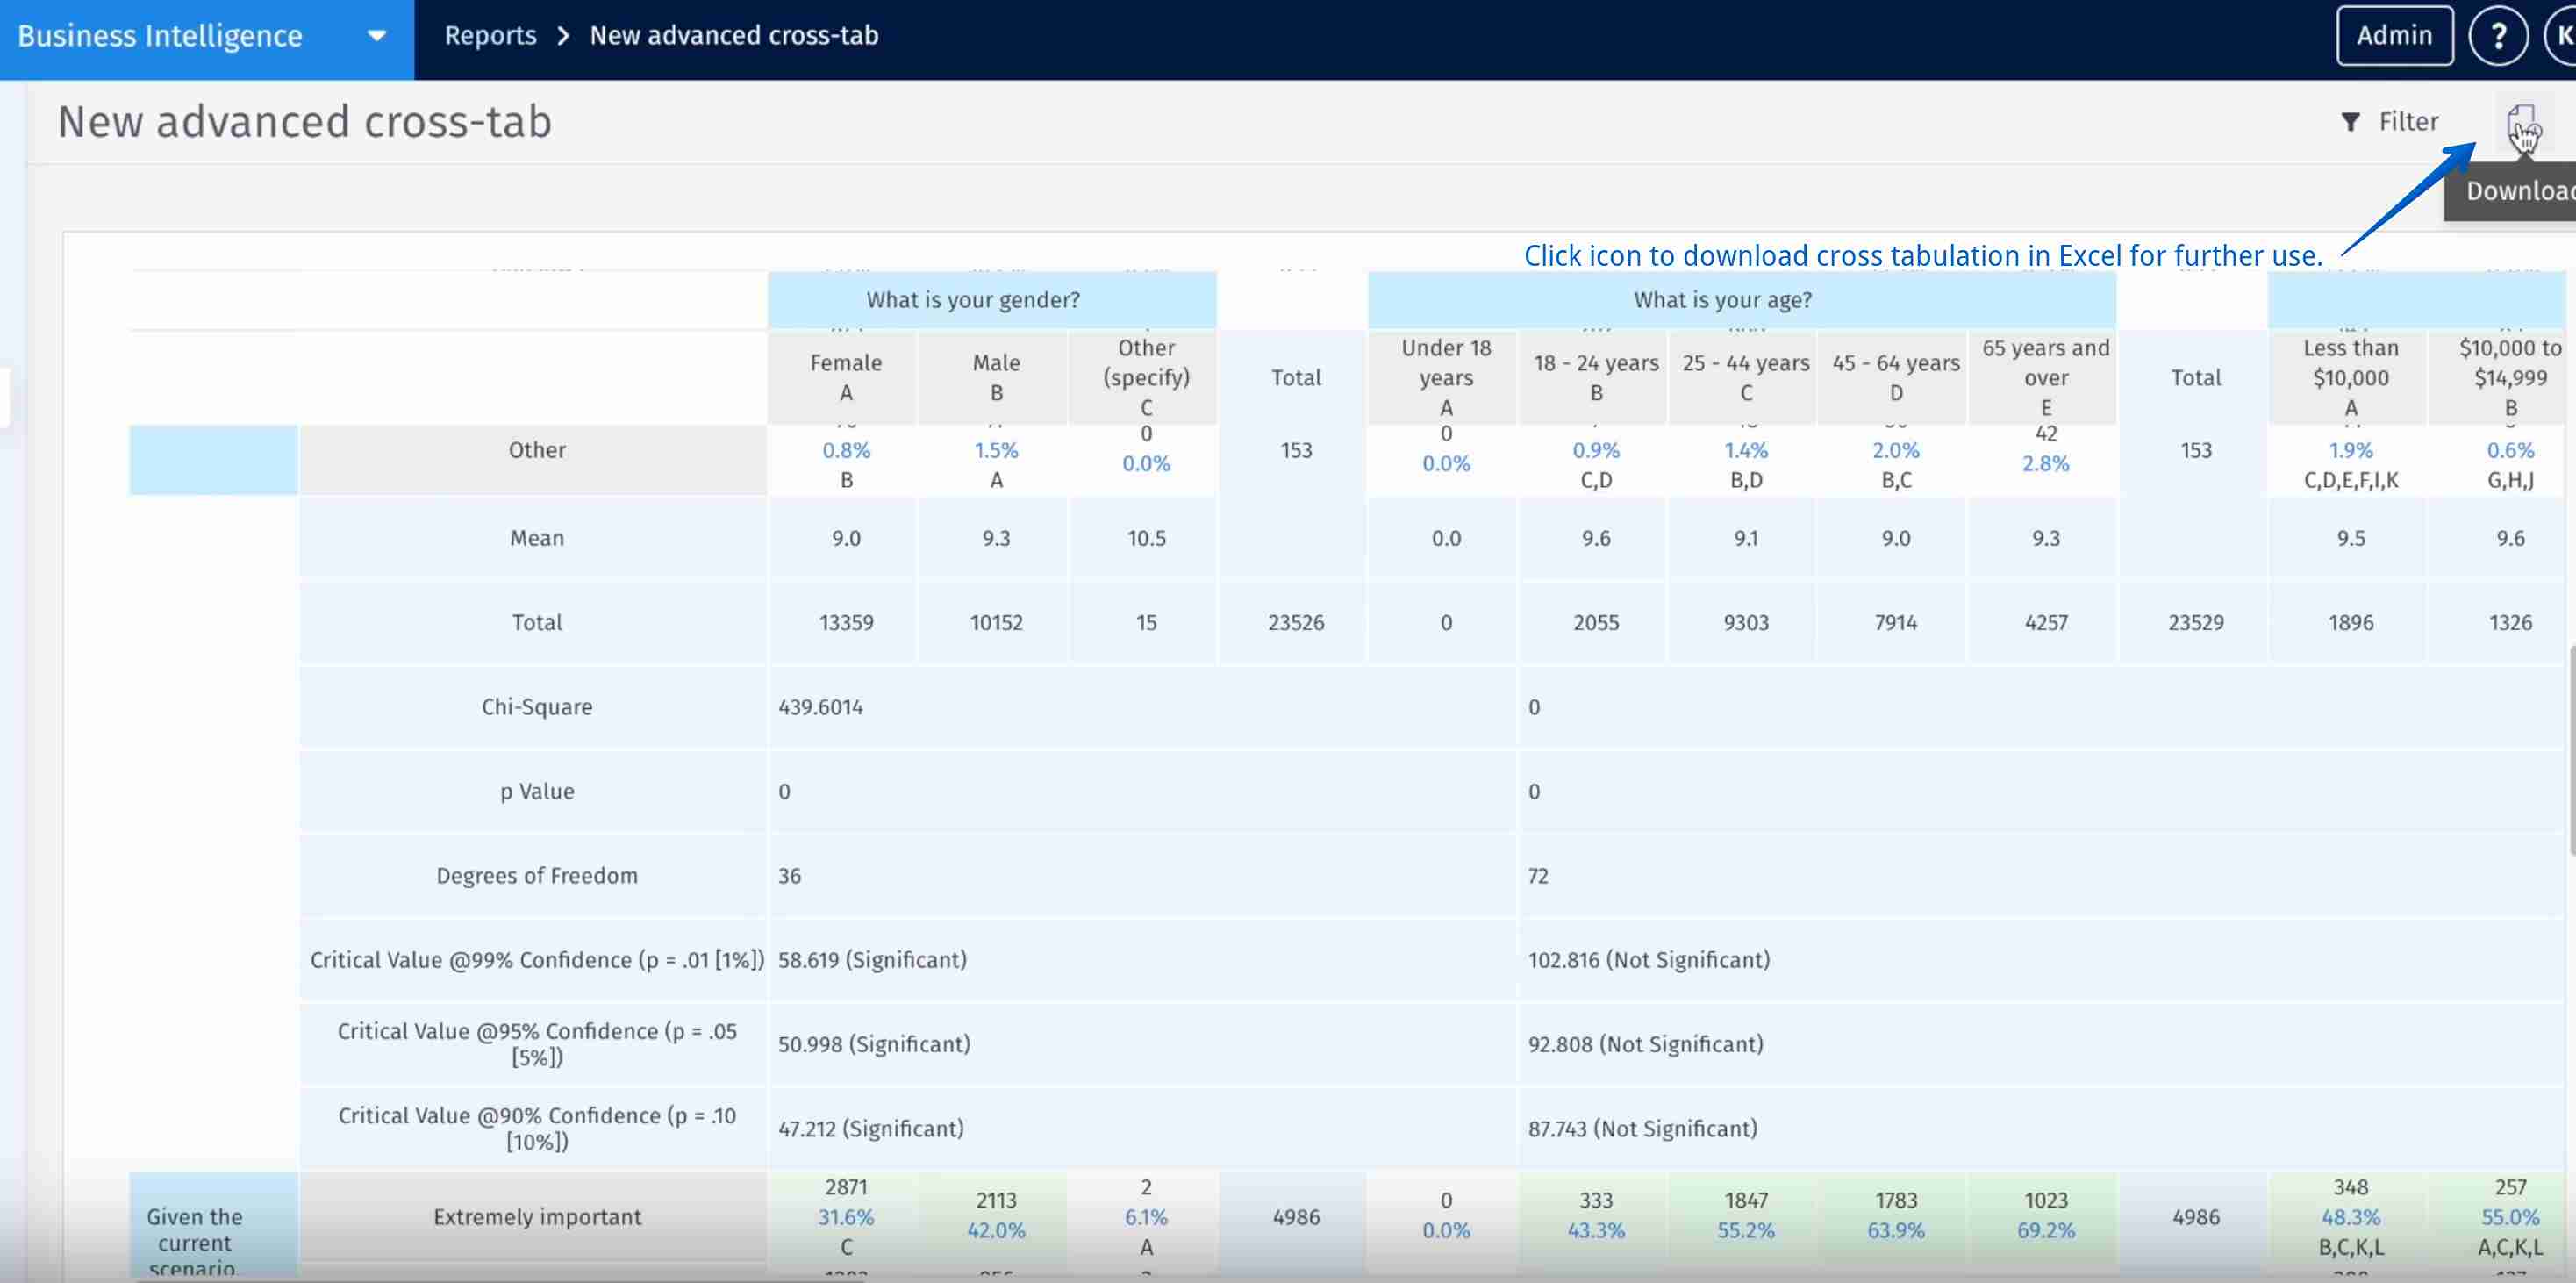
To download cross-tab, click download icon
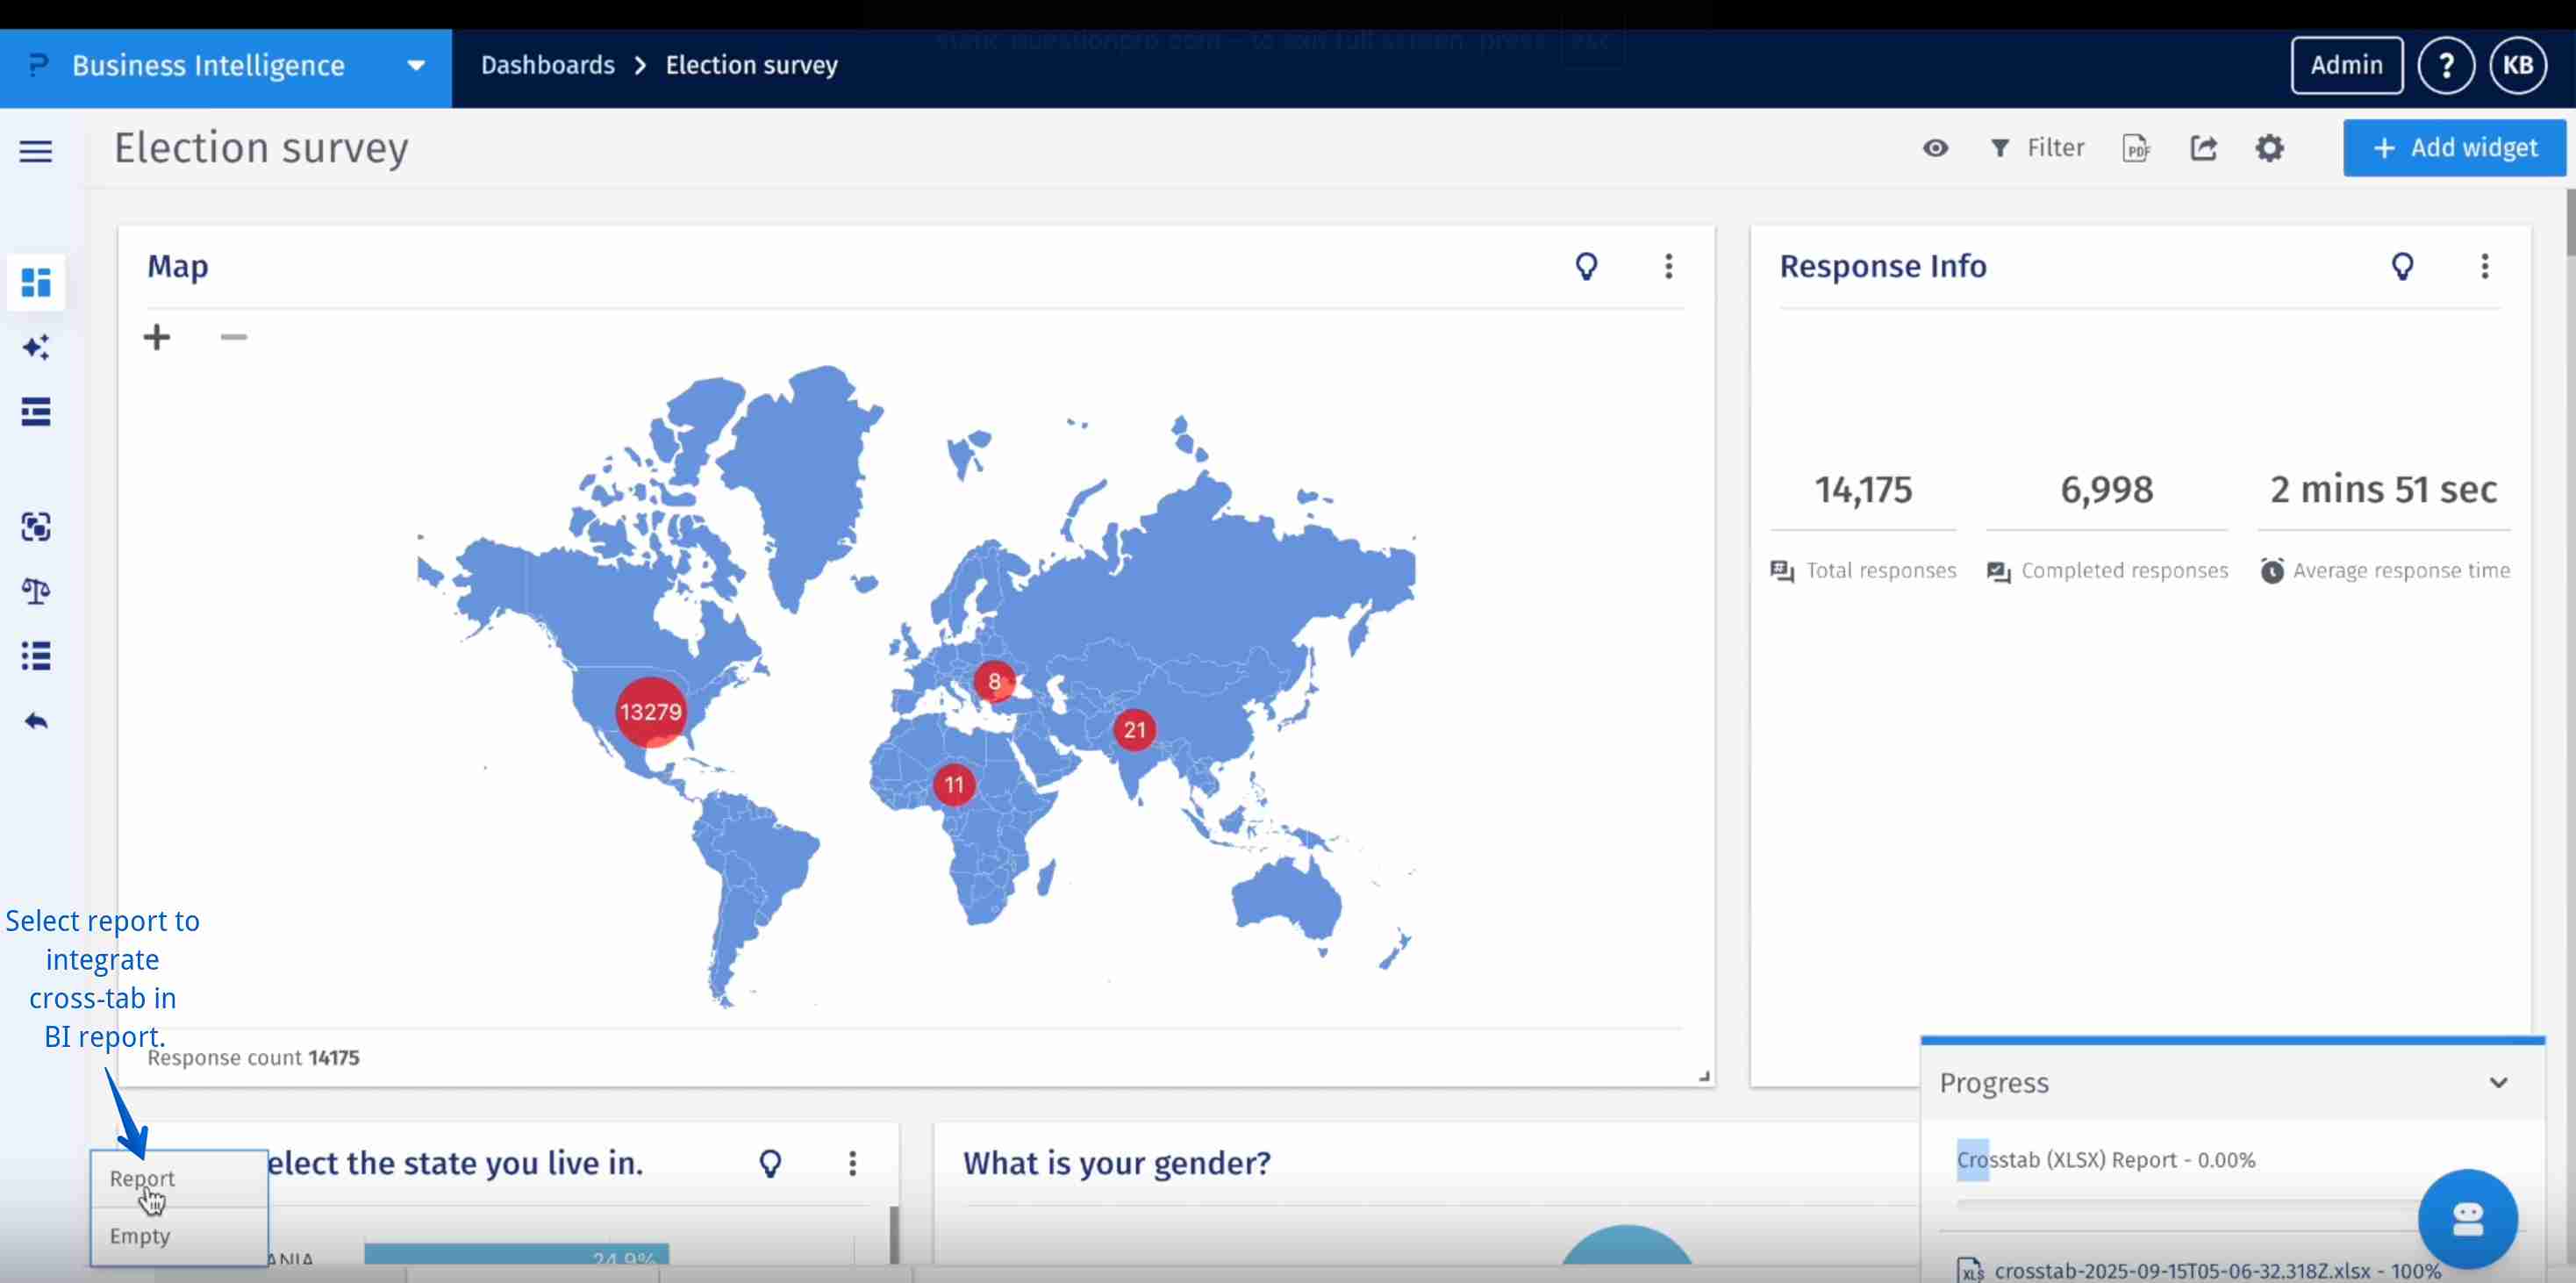
- To add cross-tab report to BI report: Select BI report » Click on add tab button (left-bottom corner) » Click report » Select cross-tab report » Click save.
This feature is available with the following licenses :
Research Edition Communities Customer Experience Employee Experience University - Research Edition