


Donut Chart for your widget
Donut chart is a variant of the pie chart, with a blank center allowing for additional information about the data as a whole to be included.
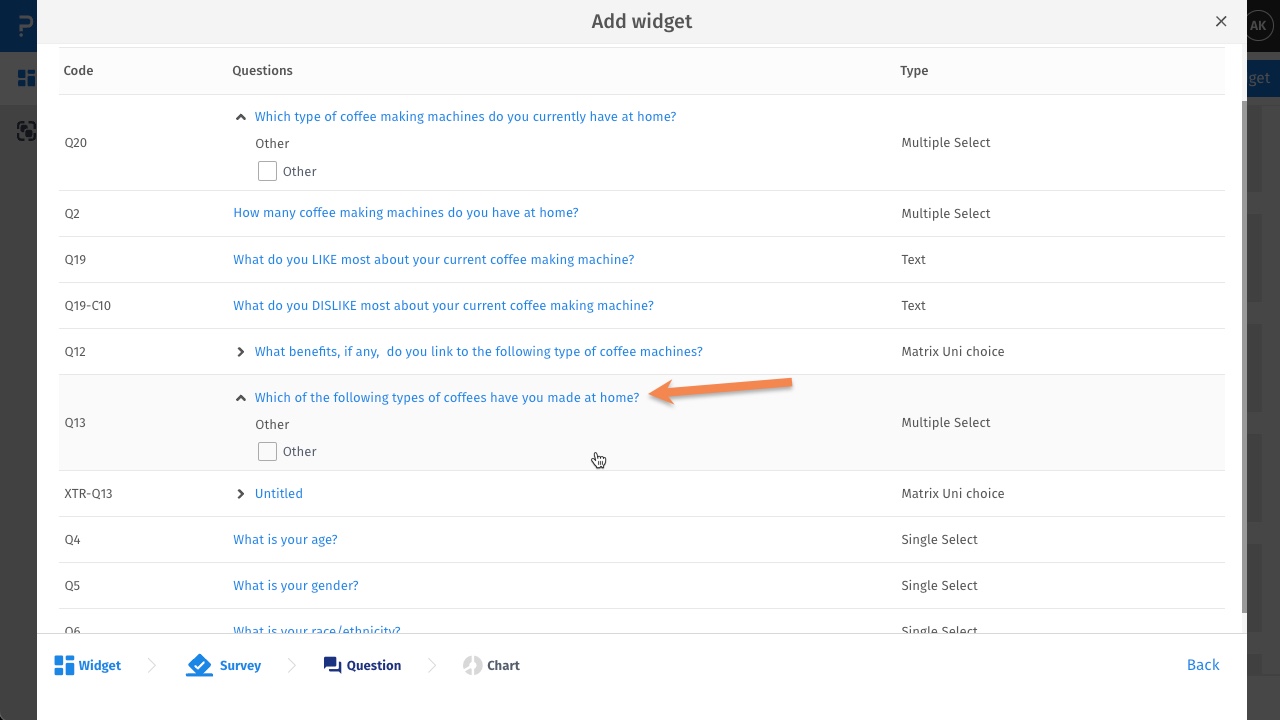
Go to: Login » Select dashboard » Add widget » Question based or continue using this survey » Select question or part of a question » Select the donut chart type » Add Widget
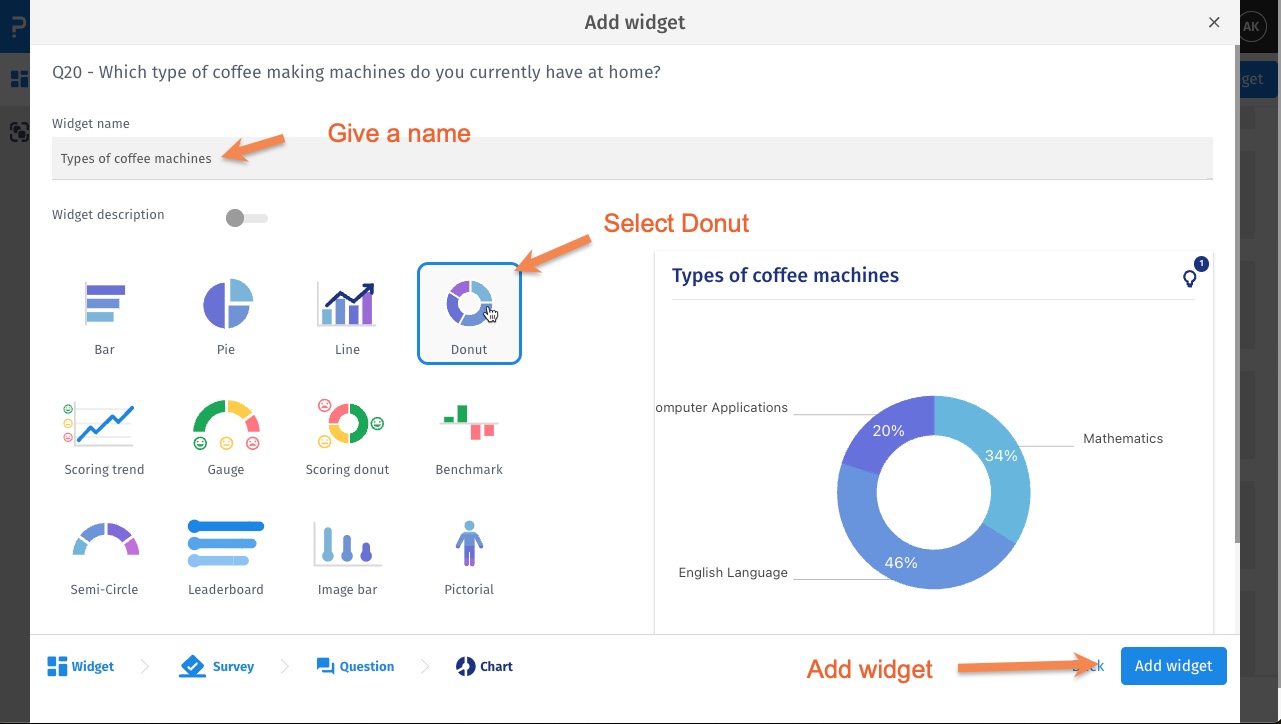
 Step 2: Give a name to widget >> Select Donut Chart type >> Add Widget
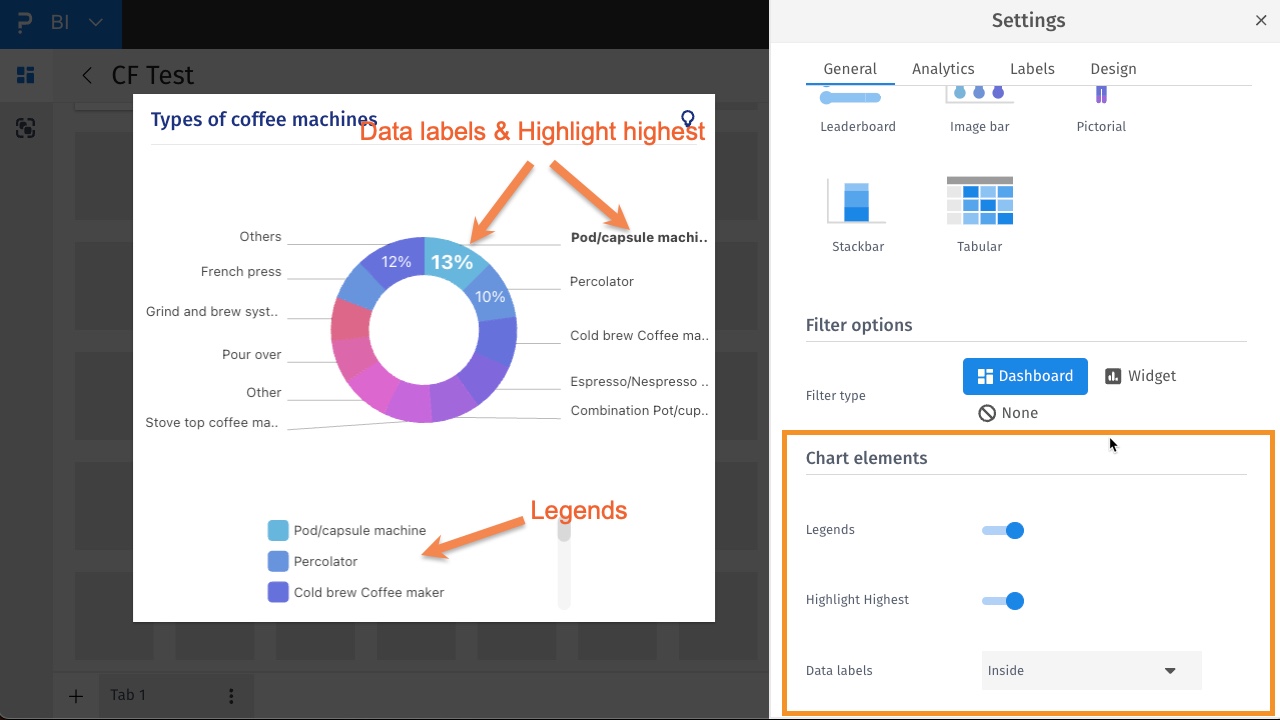
You can customize the chart elements such as enable or disable Legends, display data labels inside or outside the chart.
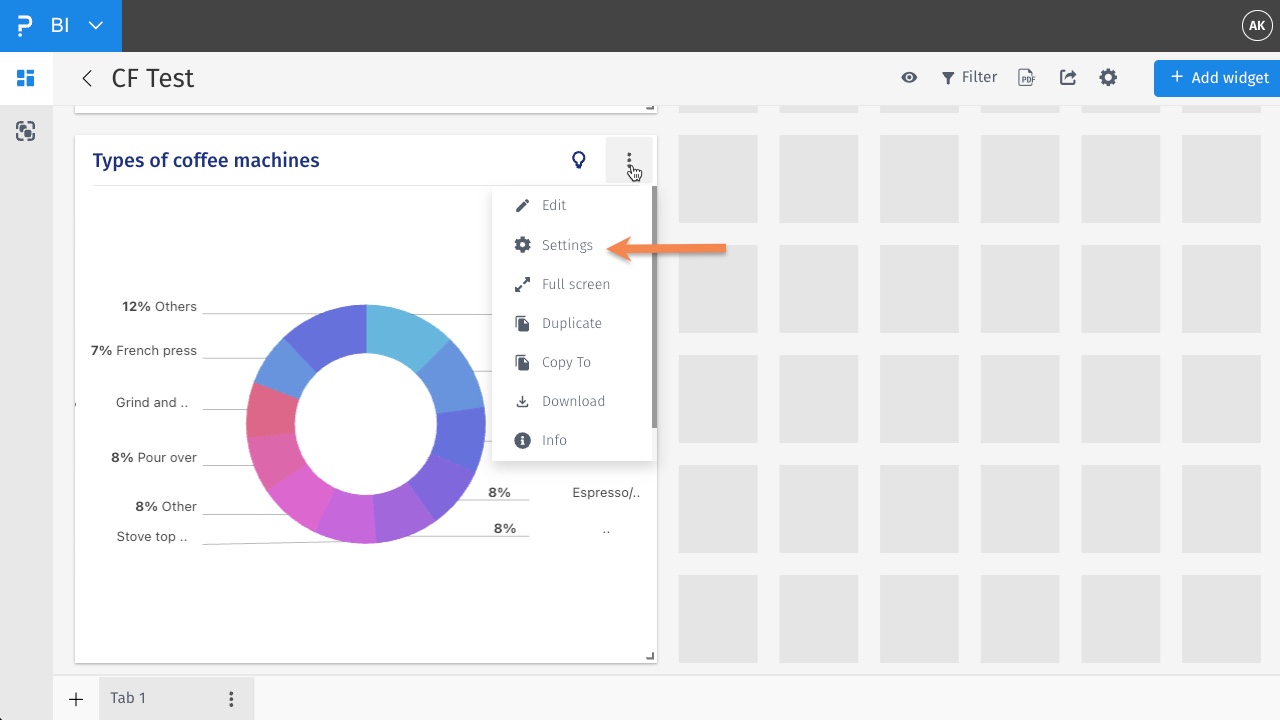
Click on the options of the widget: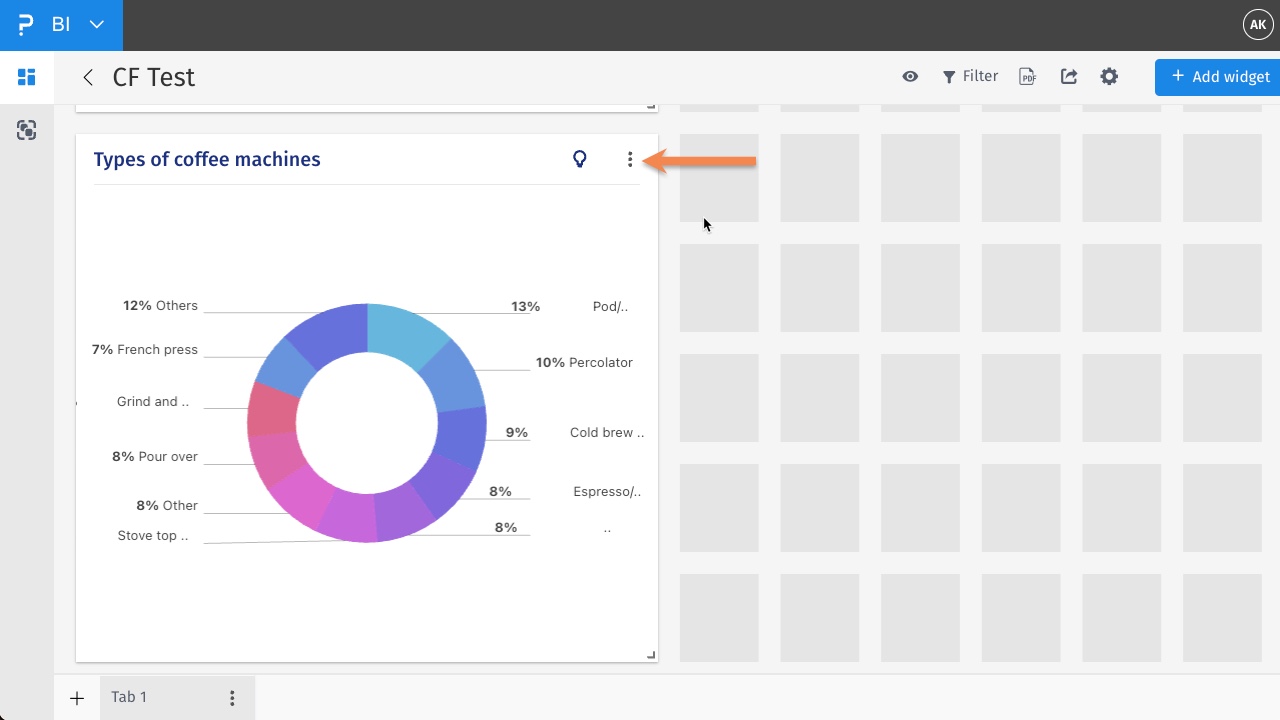 Click on settings:
 Once the general setting are shown, scroll down to access chart elements.
This feature is available with the following licenses :
Team Edition Research Edition Communities Customer Experience Employee Experience