


Topic Stackbar
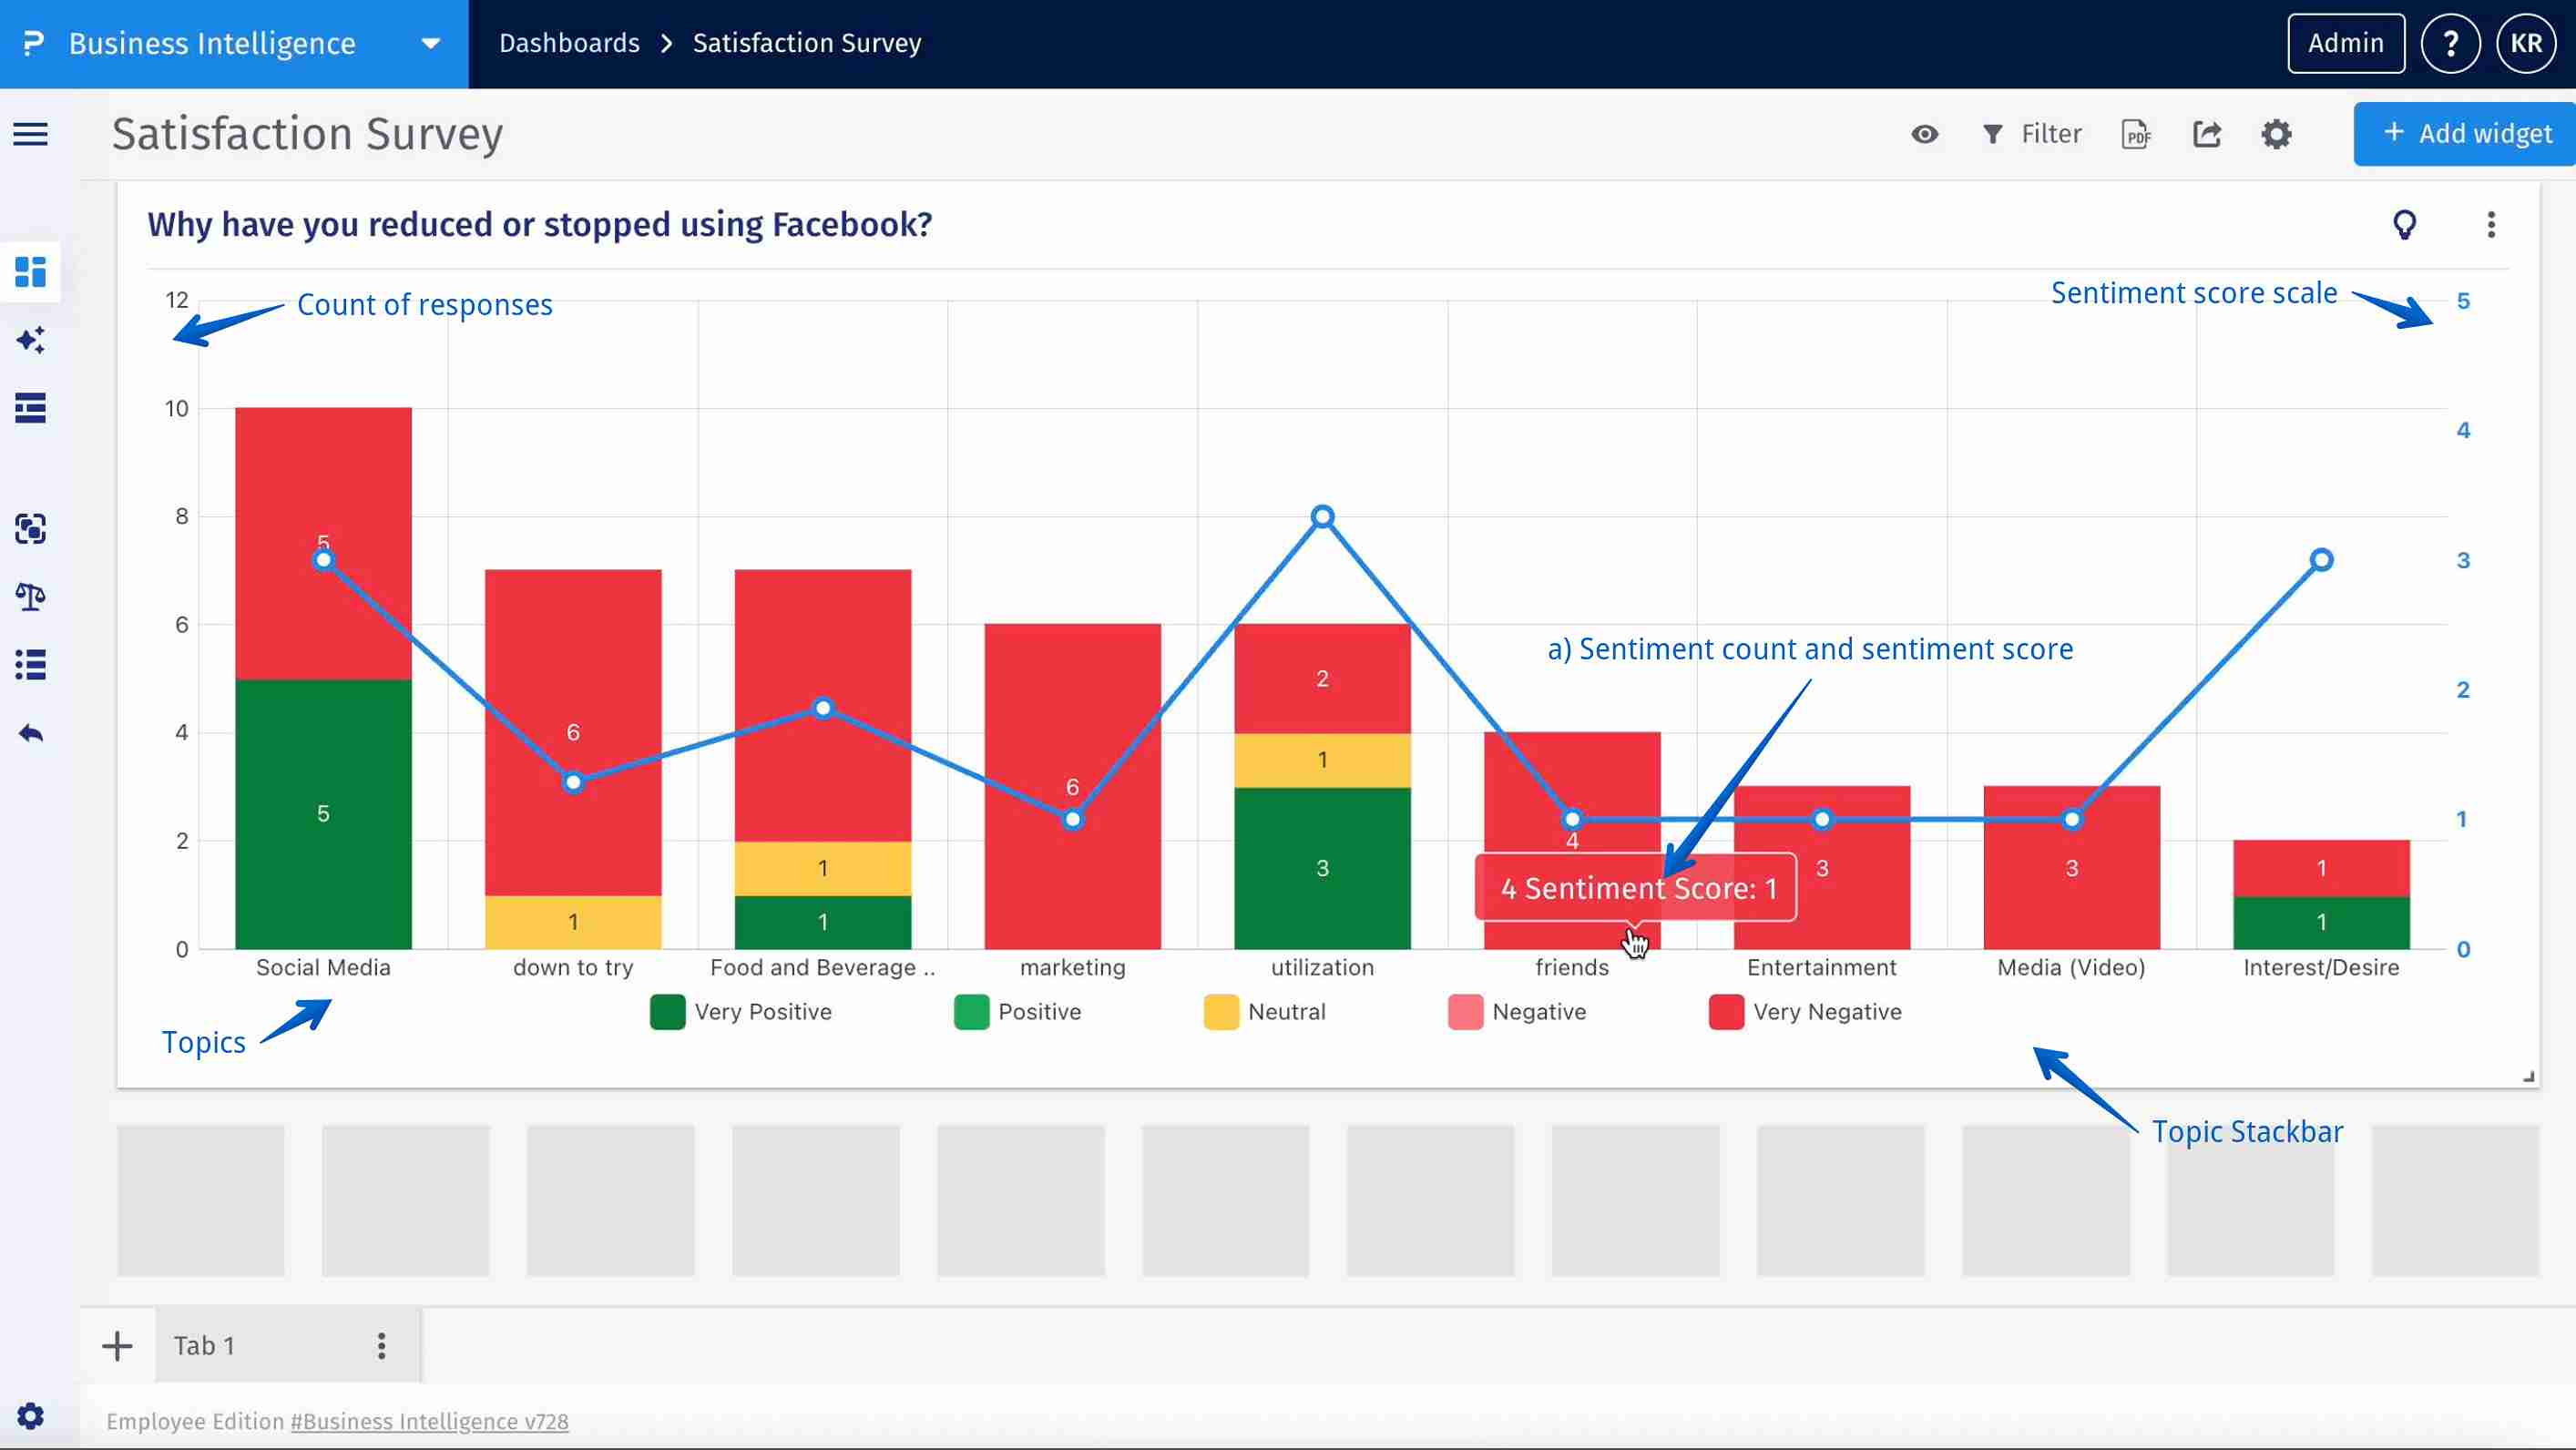
The Topic Stackbar is a visualization tool that displays the distribution of sentiment across different topics in a stacked bar format. Each bar represents a topic, and the stack segments within the bar indicate the proportion of sentiments — Very Positive, Positive, Neutral, Negative, and Very Negative.
This feature helps users quickly compare sentiment distribution across topics and drill down into the actual responses behind each sentiment. Additionally, a sentiment score line chart overlays the bar chart as a secondary axis, helping users assess overall topic sentiment trends at a glance.
- Stacked Sentiment Distribution: Each topic is represented as a bar, stacked with different sentiment layers (Very Positive, Positive, Neutral, Negative, Very Negative).
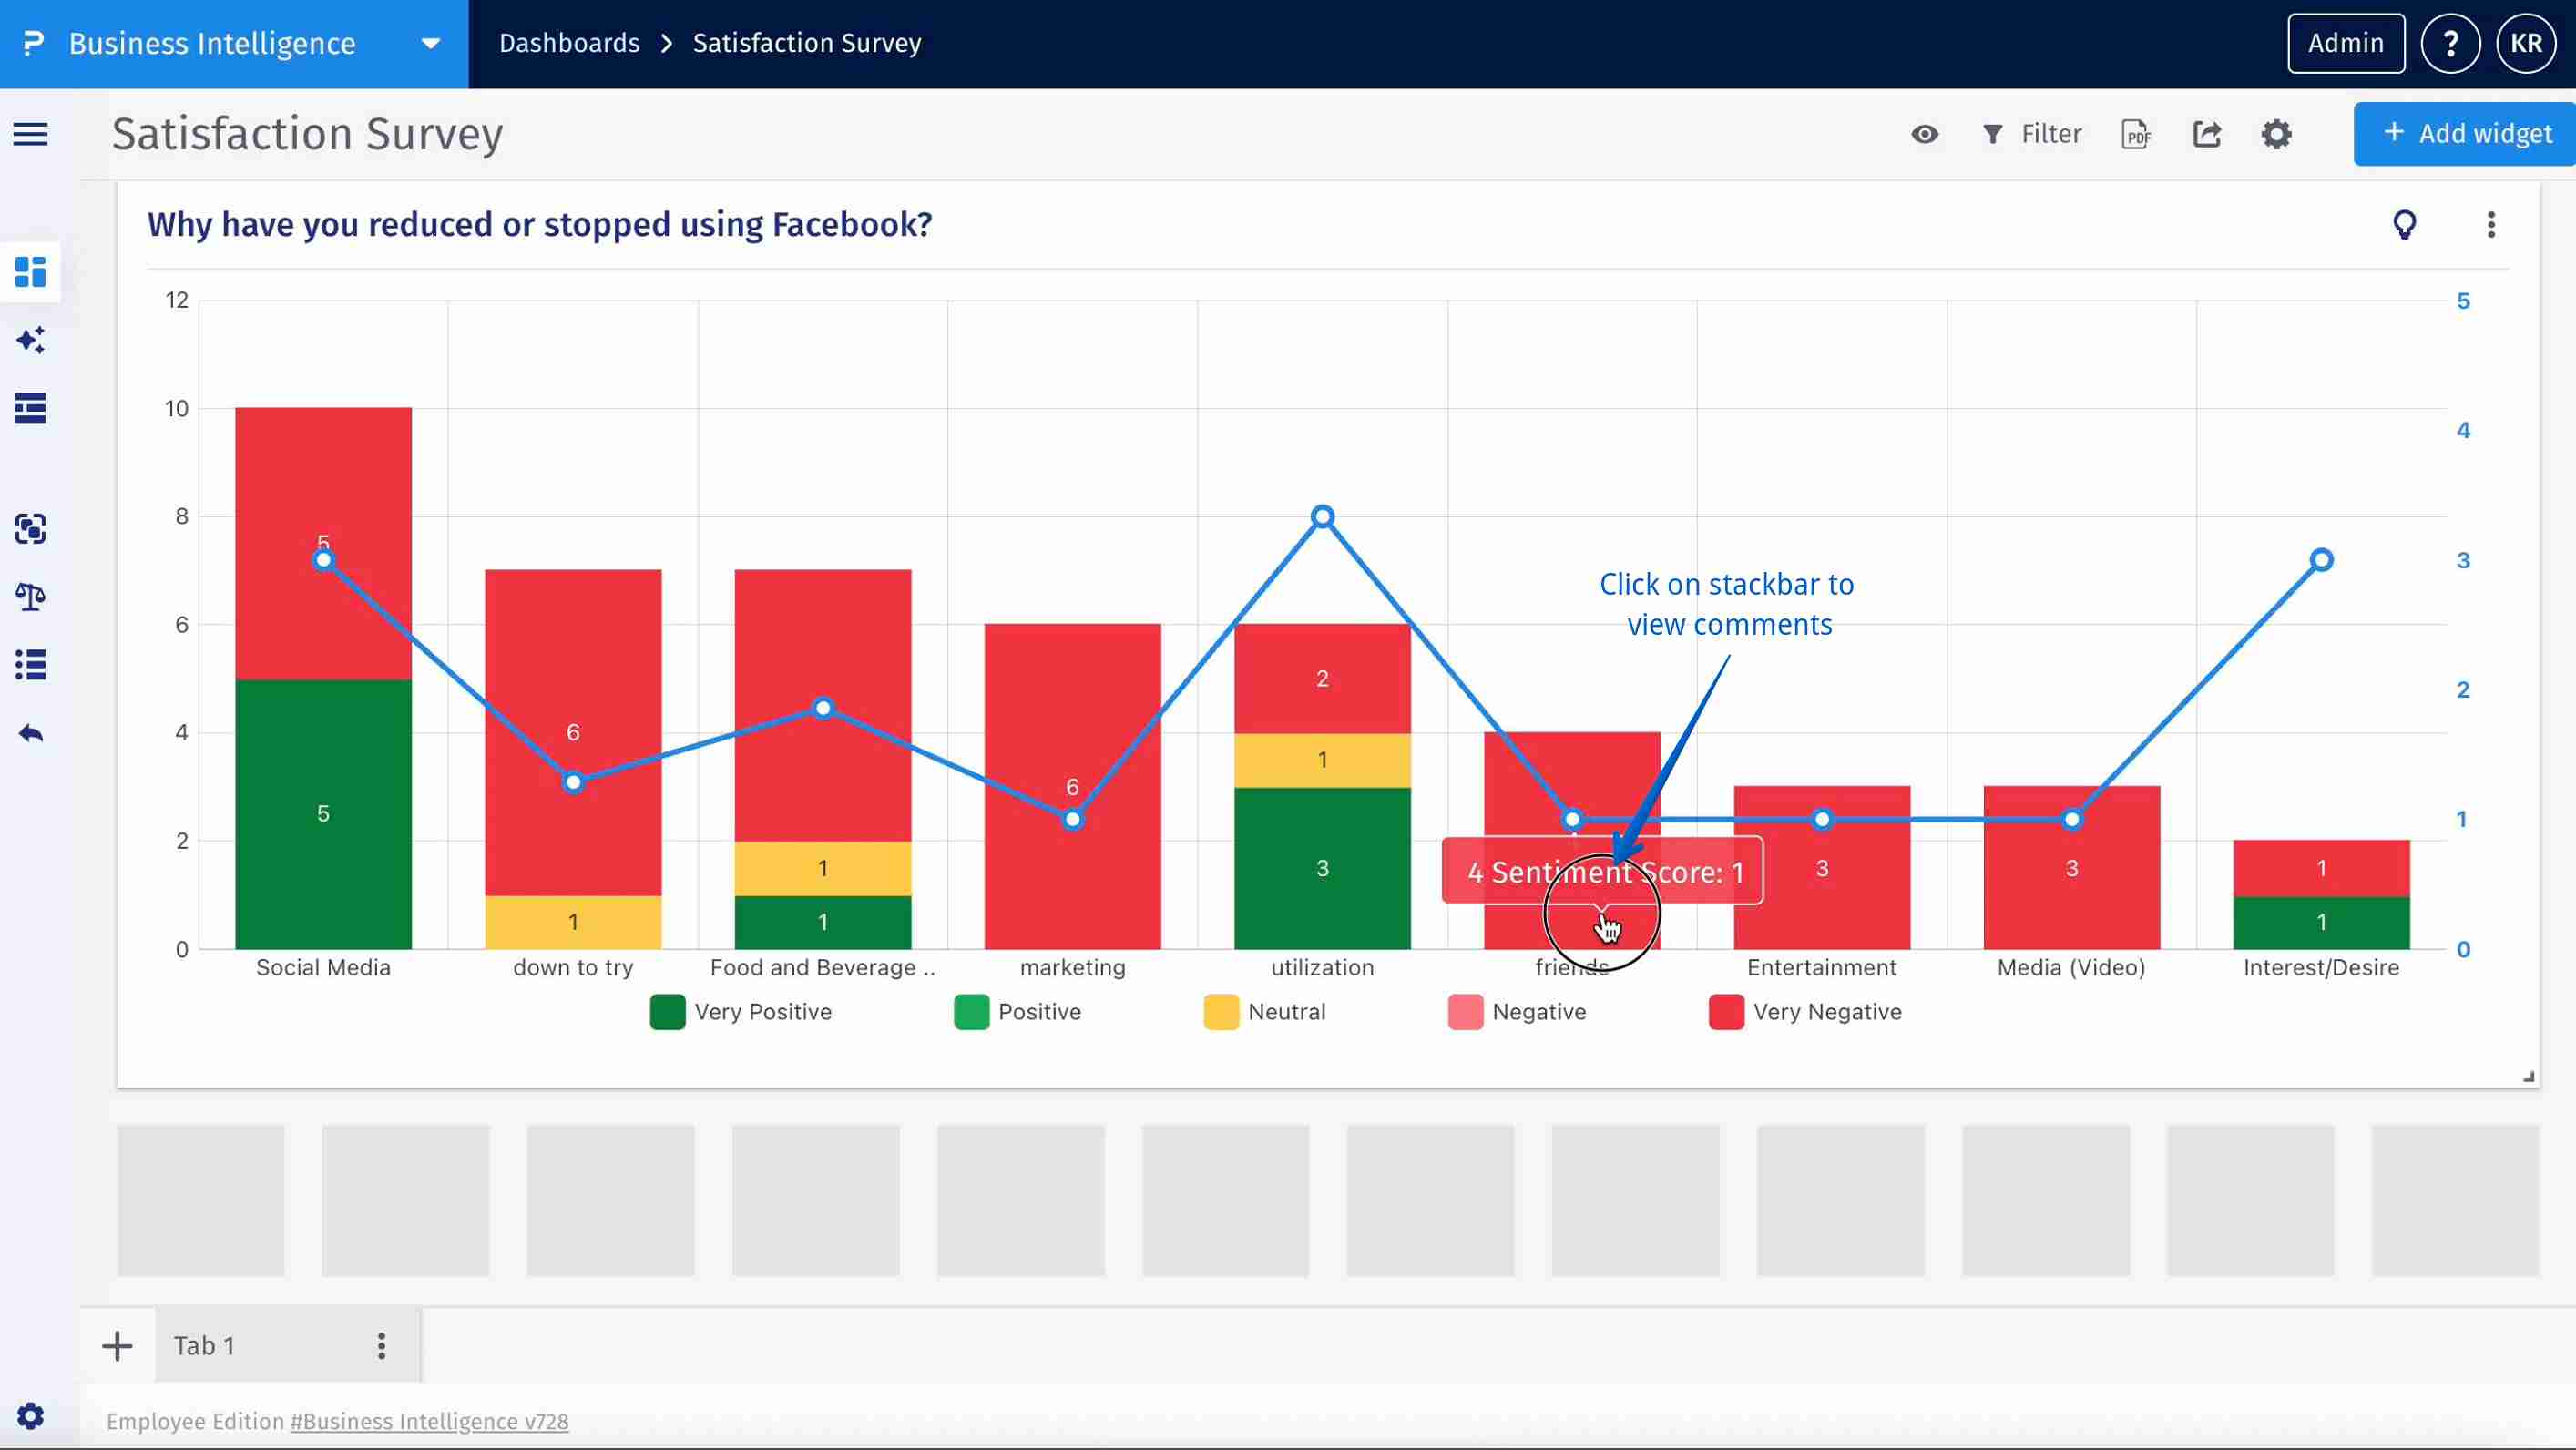
- Interactive Drill-down: Users can click on any sentiment layer within a bar to view the underlying open-ended responses tagged to that sentiment and topic.
- Tooltips and Highlights: Hovering over a stack or the sentiment line reveals the exact percentage and count of responses for that sentiment level.
- Filtering Options: Users can filter topics, time periods, or respondent segments using BI filters to tailor the analysis context.
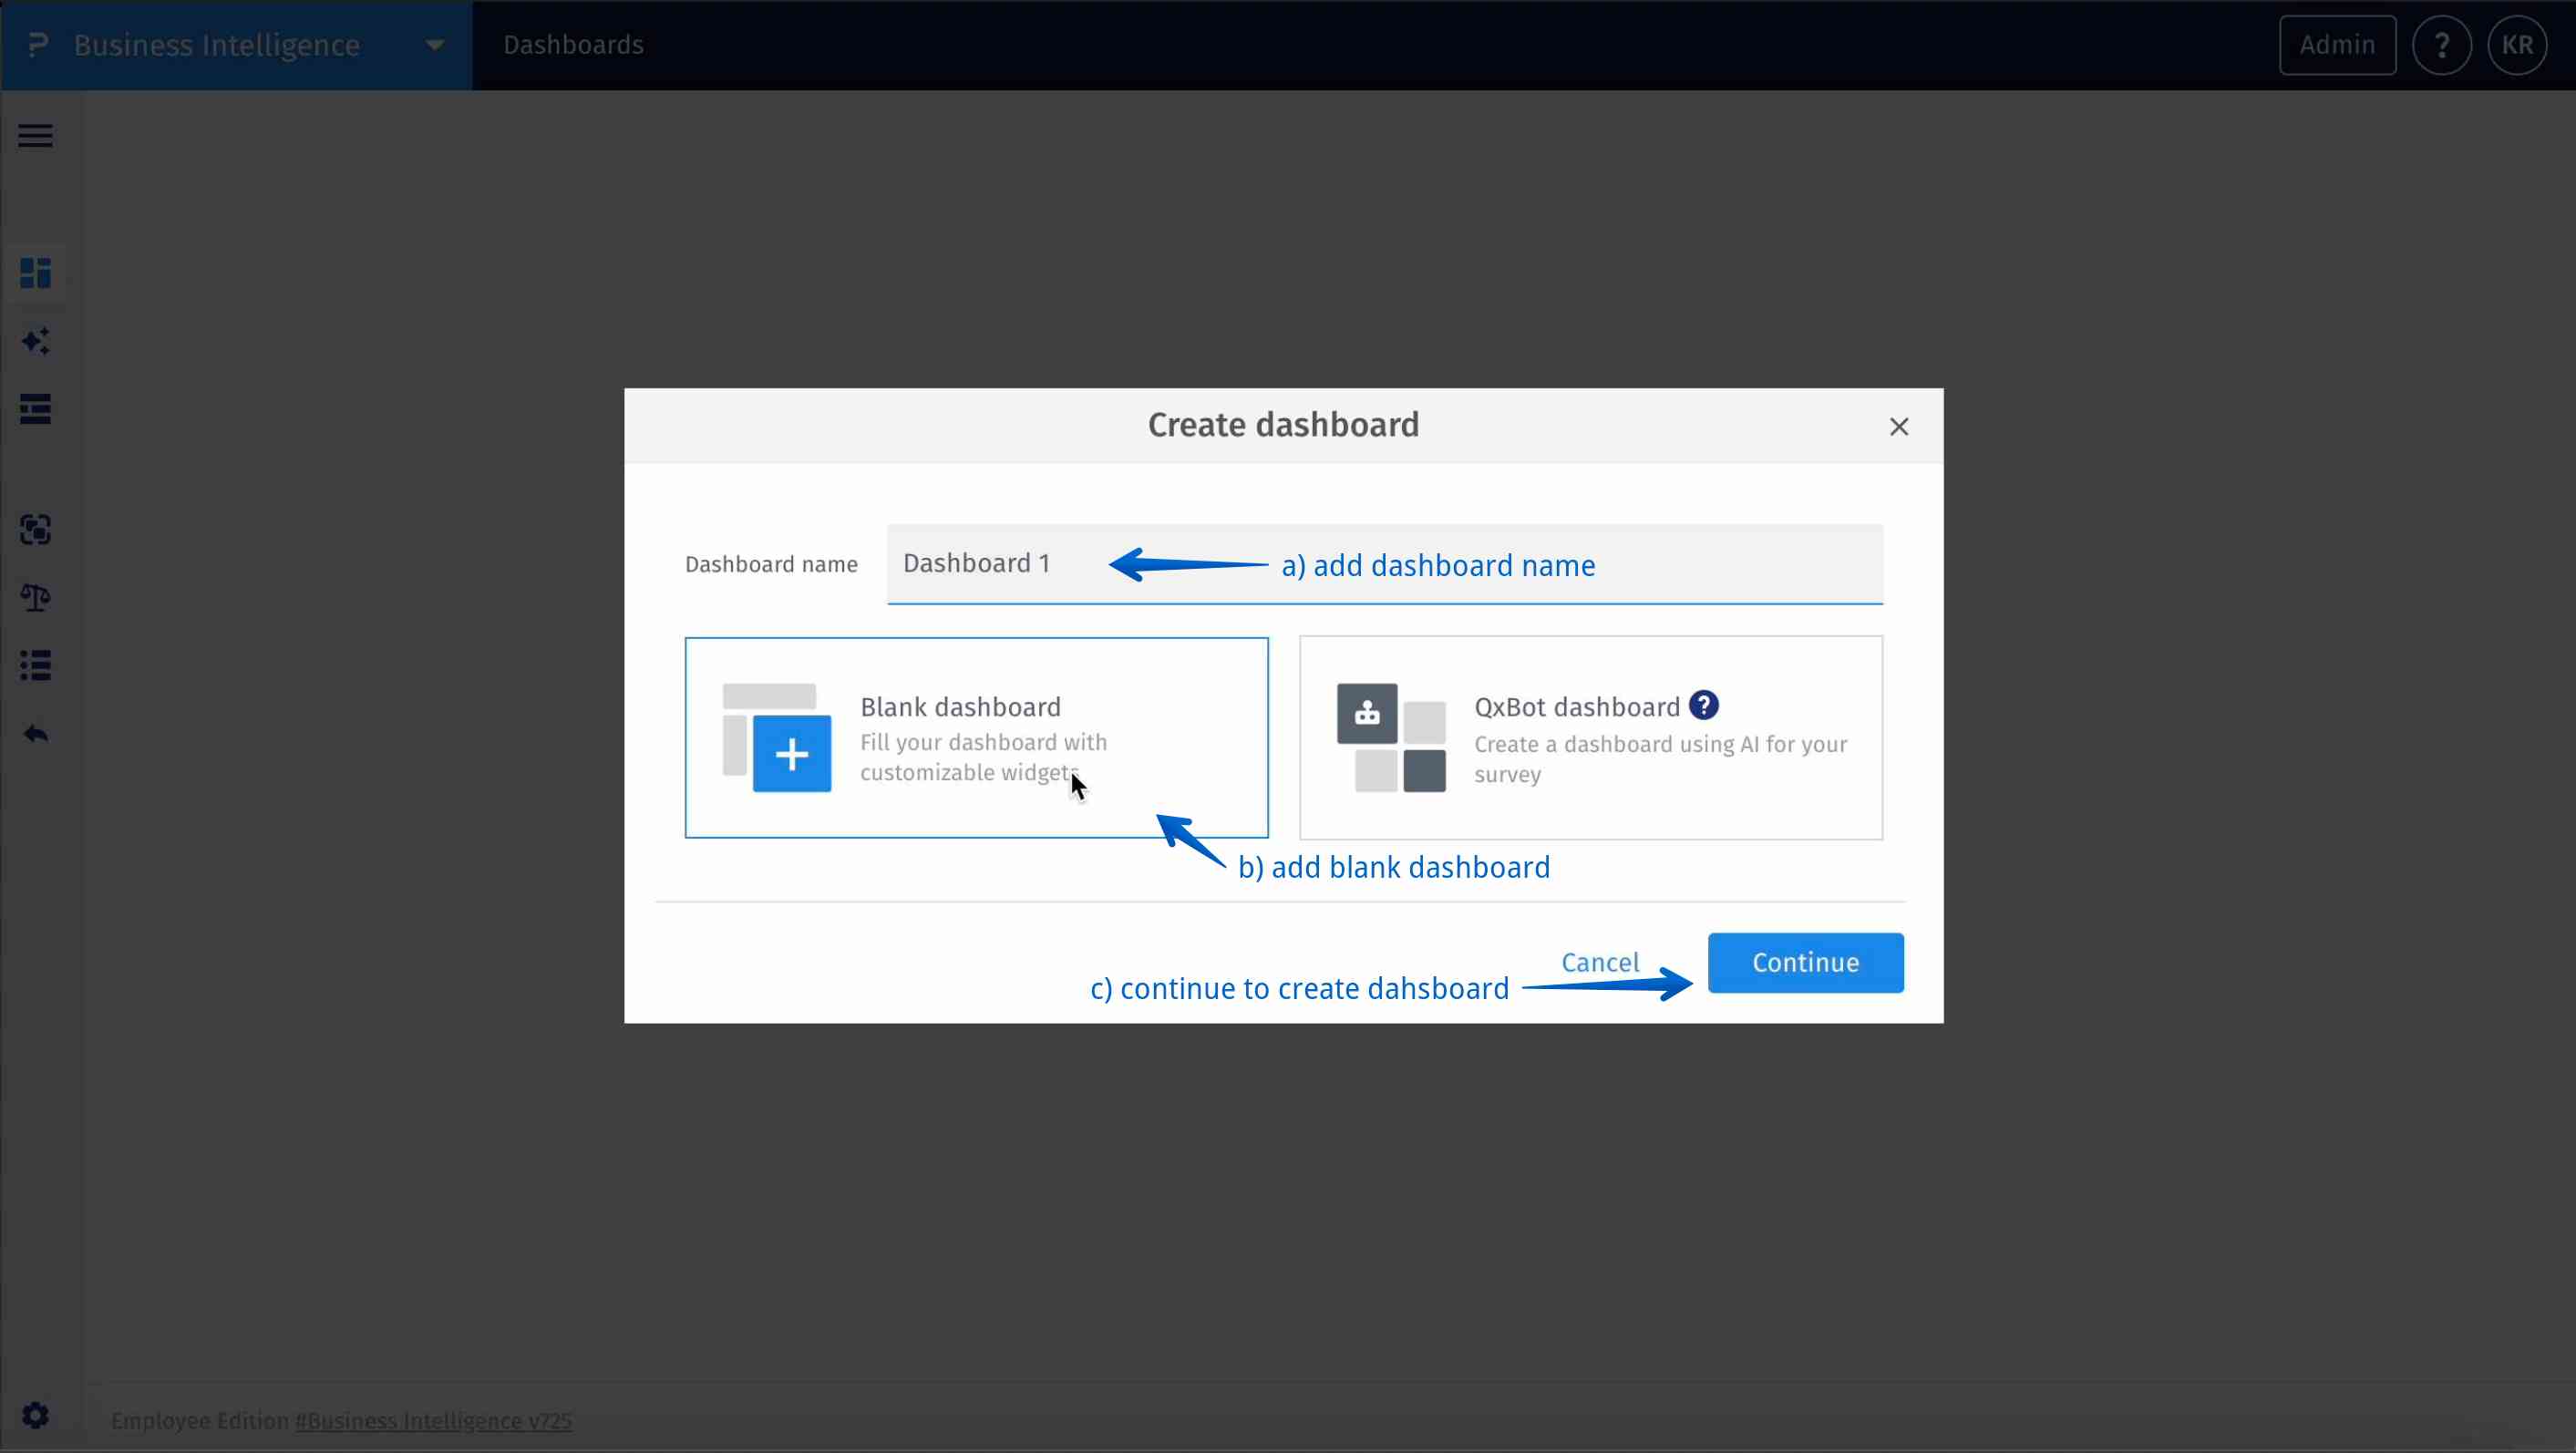
- Step 1: Create dashboard – To create Topic stackbar widget create a new dashboard or in an existing one, go to Step 6.
- Step 2: Select blank dashboard – Choose a blank dashboard layout as the starting point for adding your Topic stackbar widget.
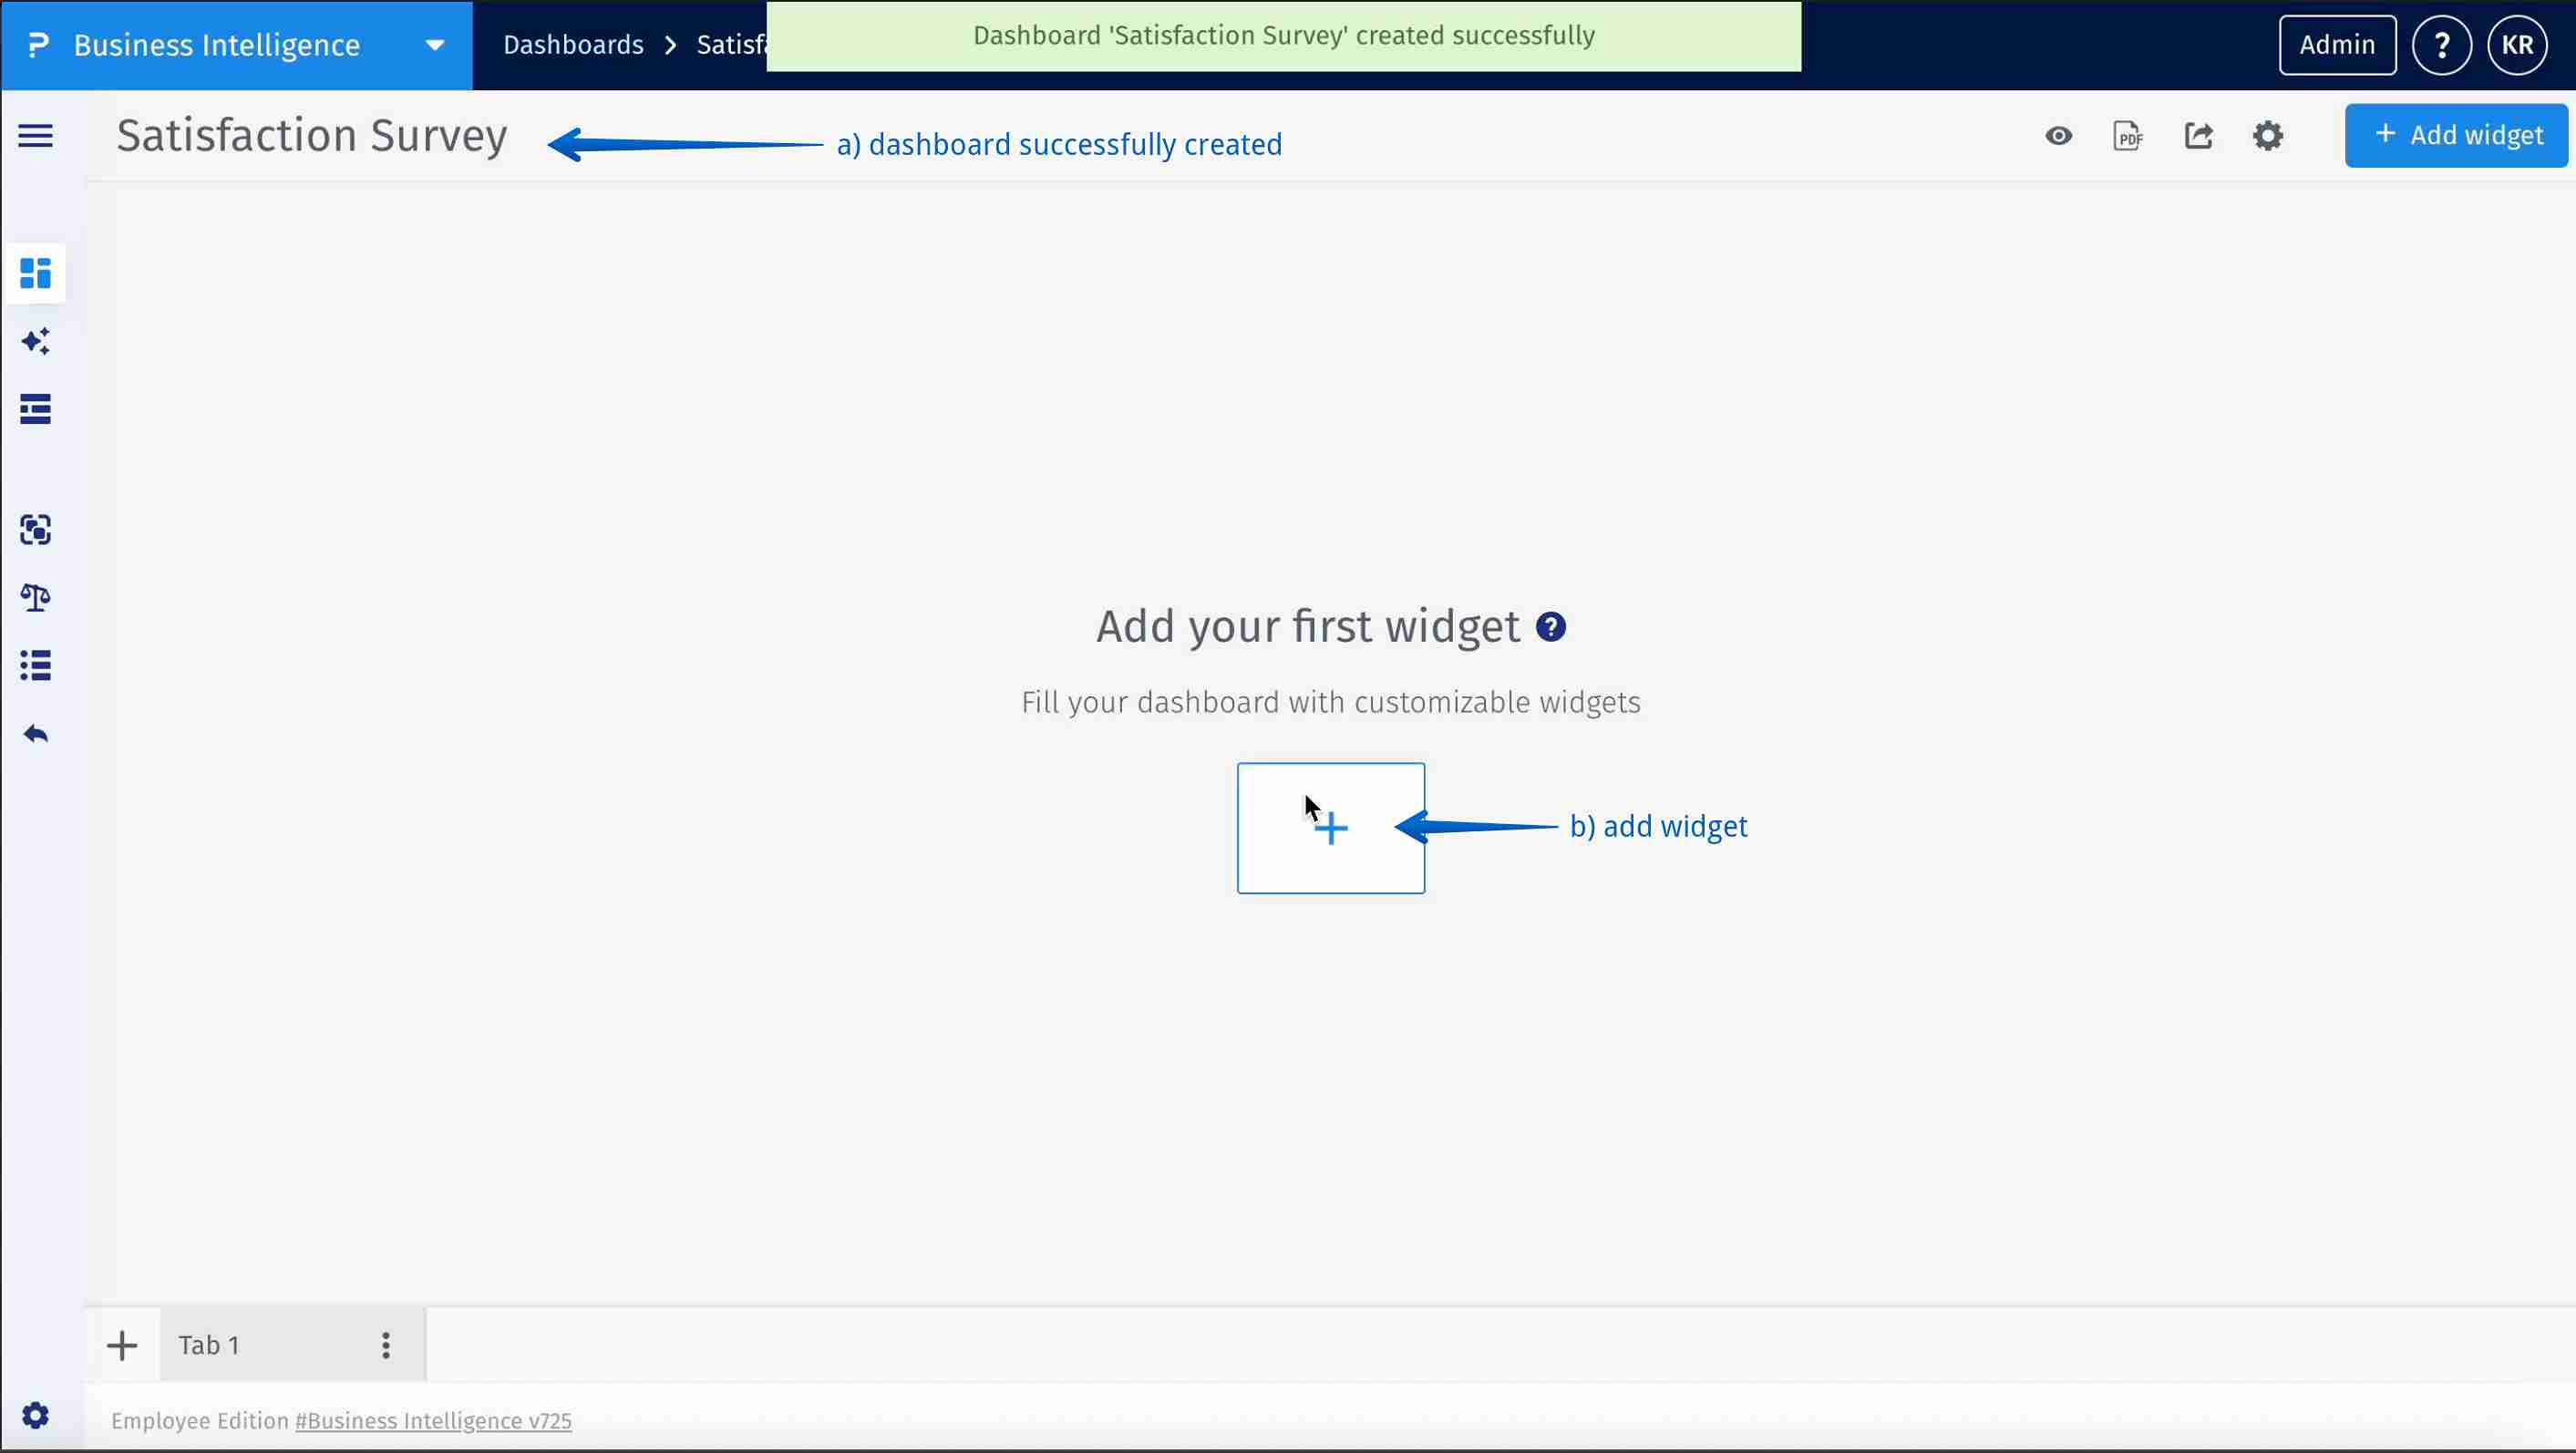
- Step 3: Add widget – Click on “Add Widget” to begin inserting visual elements into your dashboard.
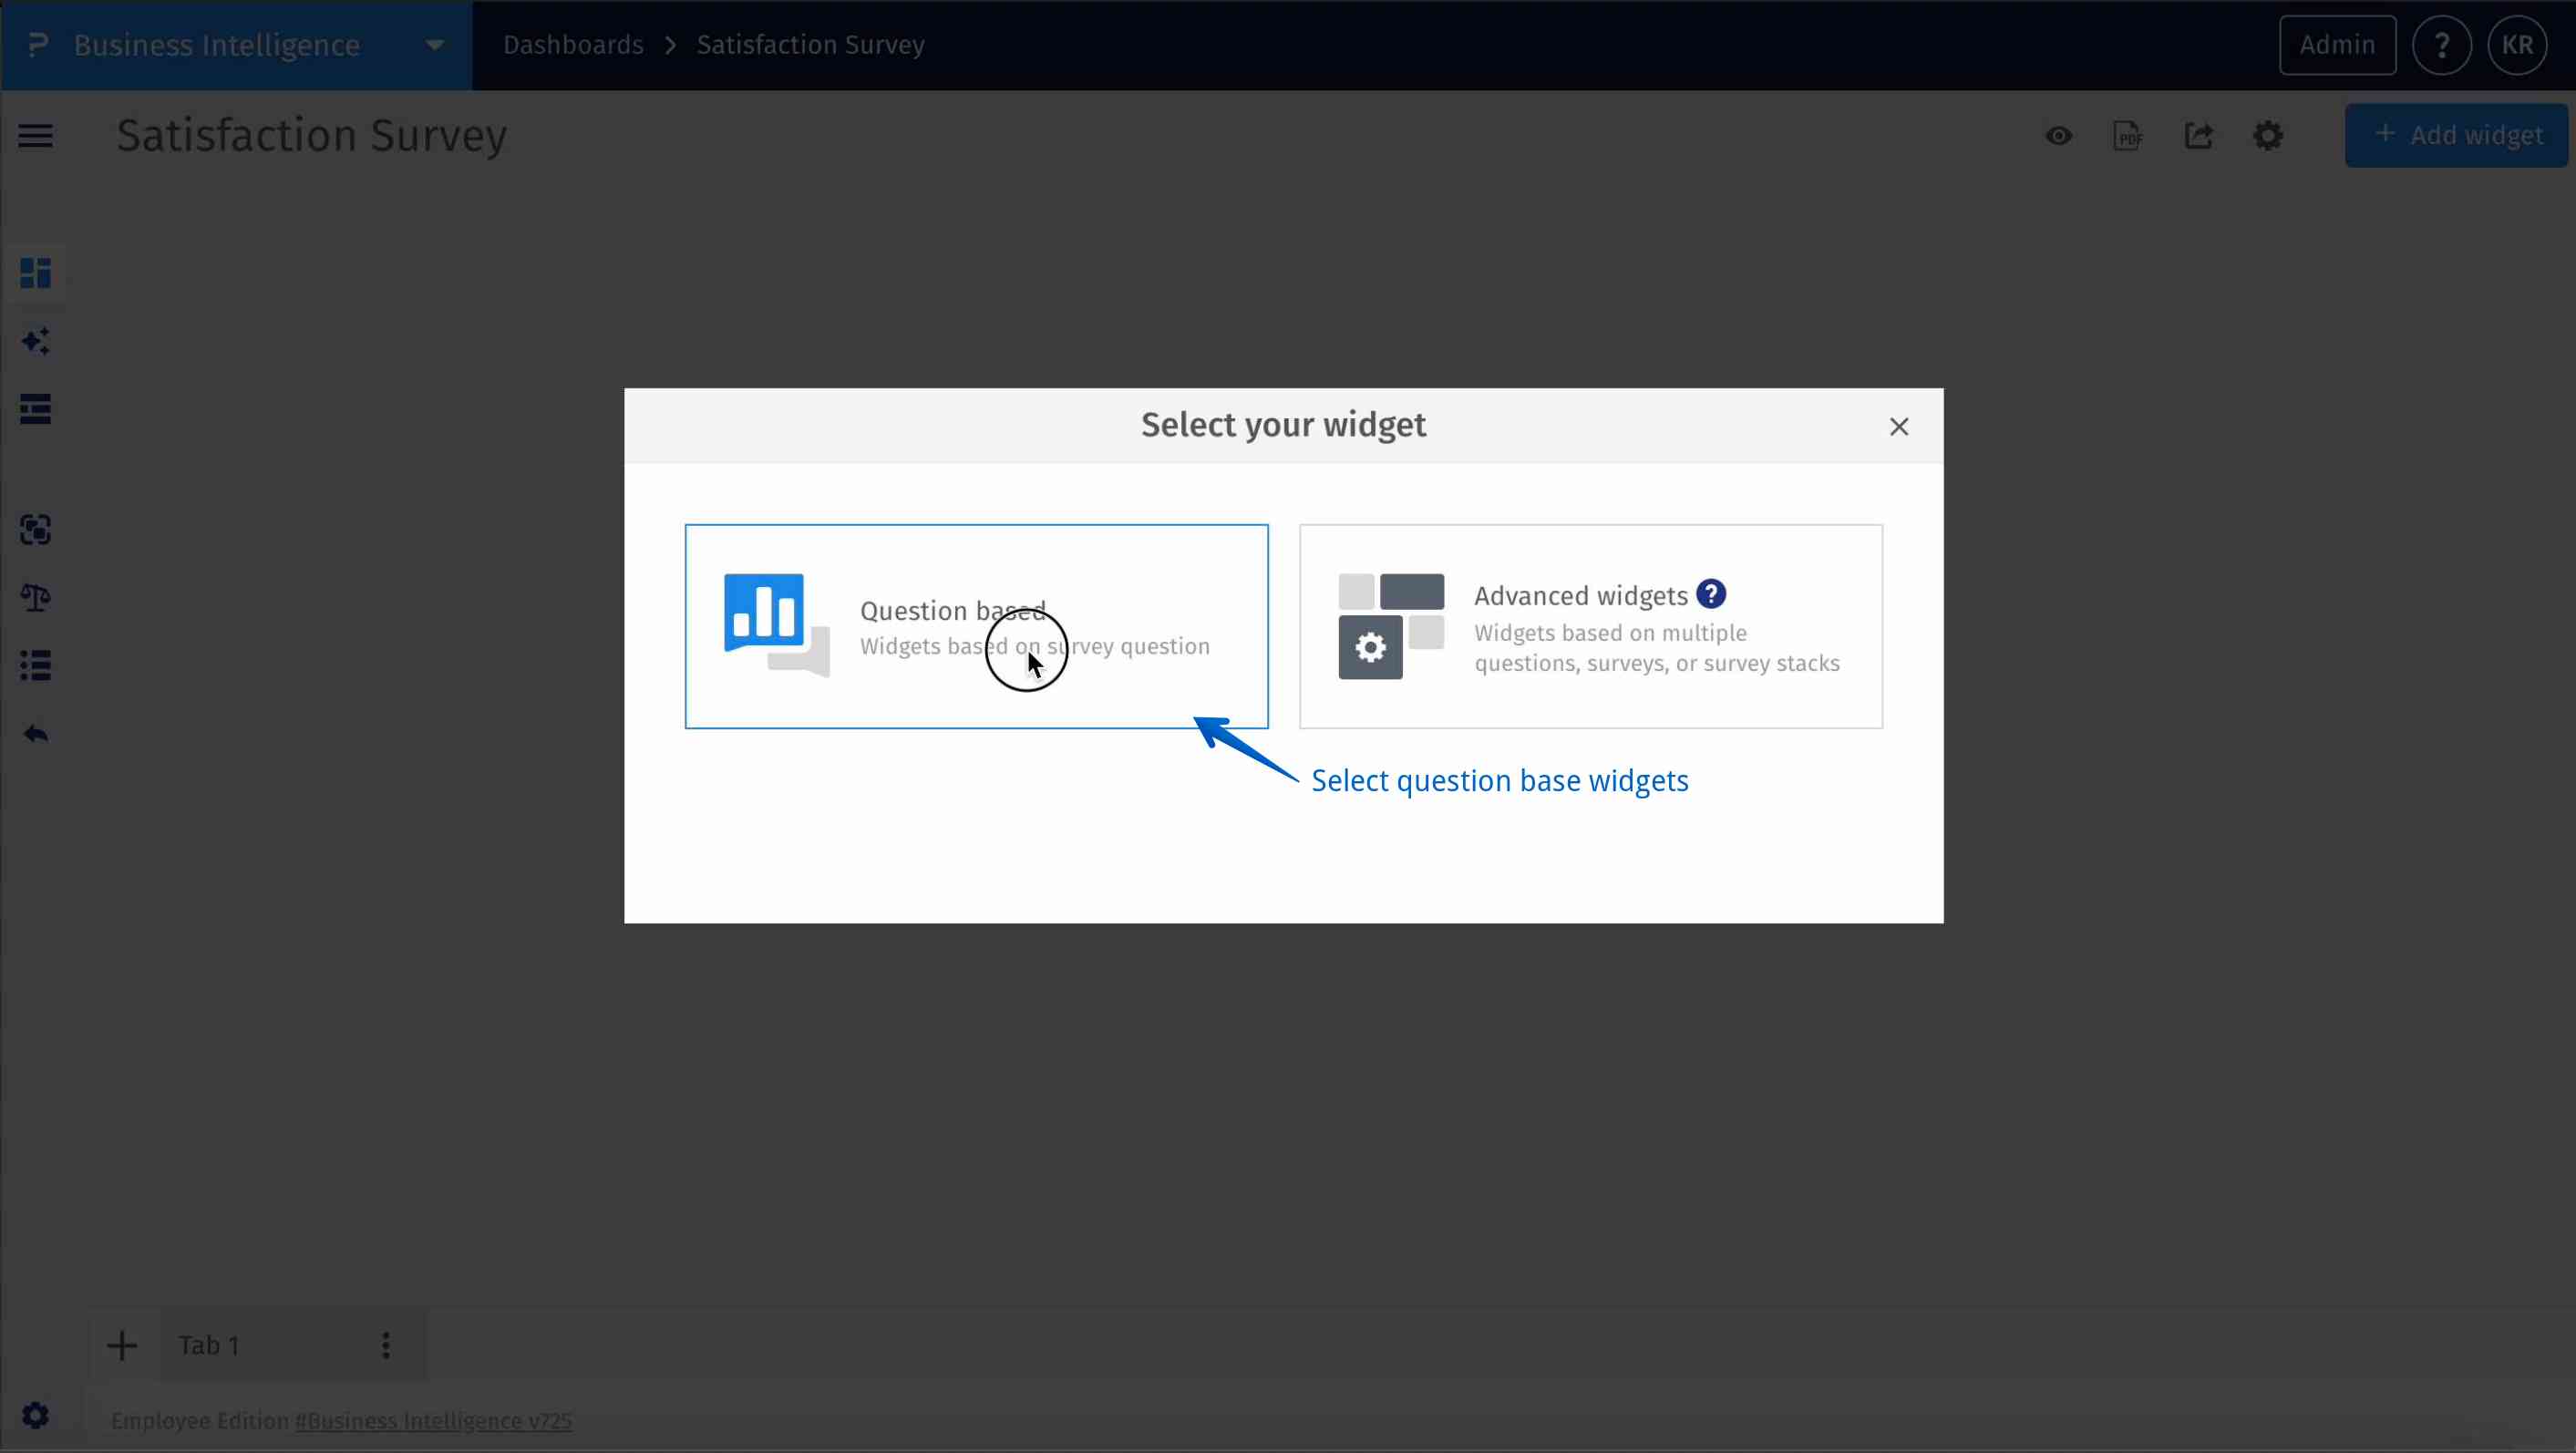
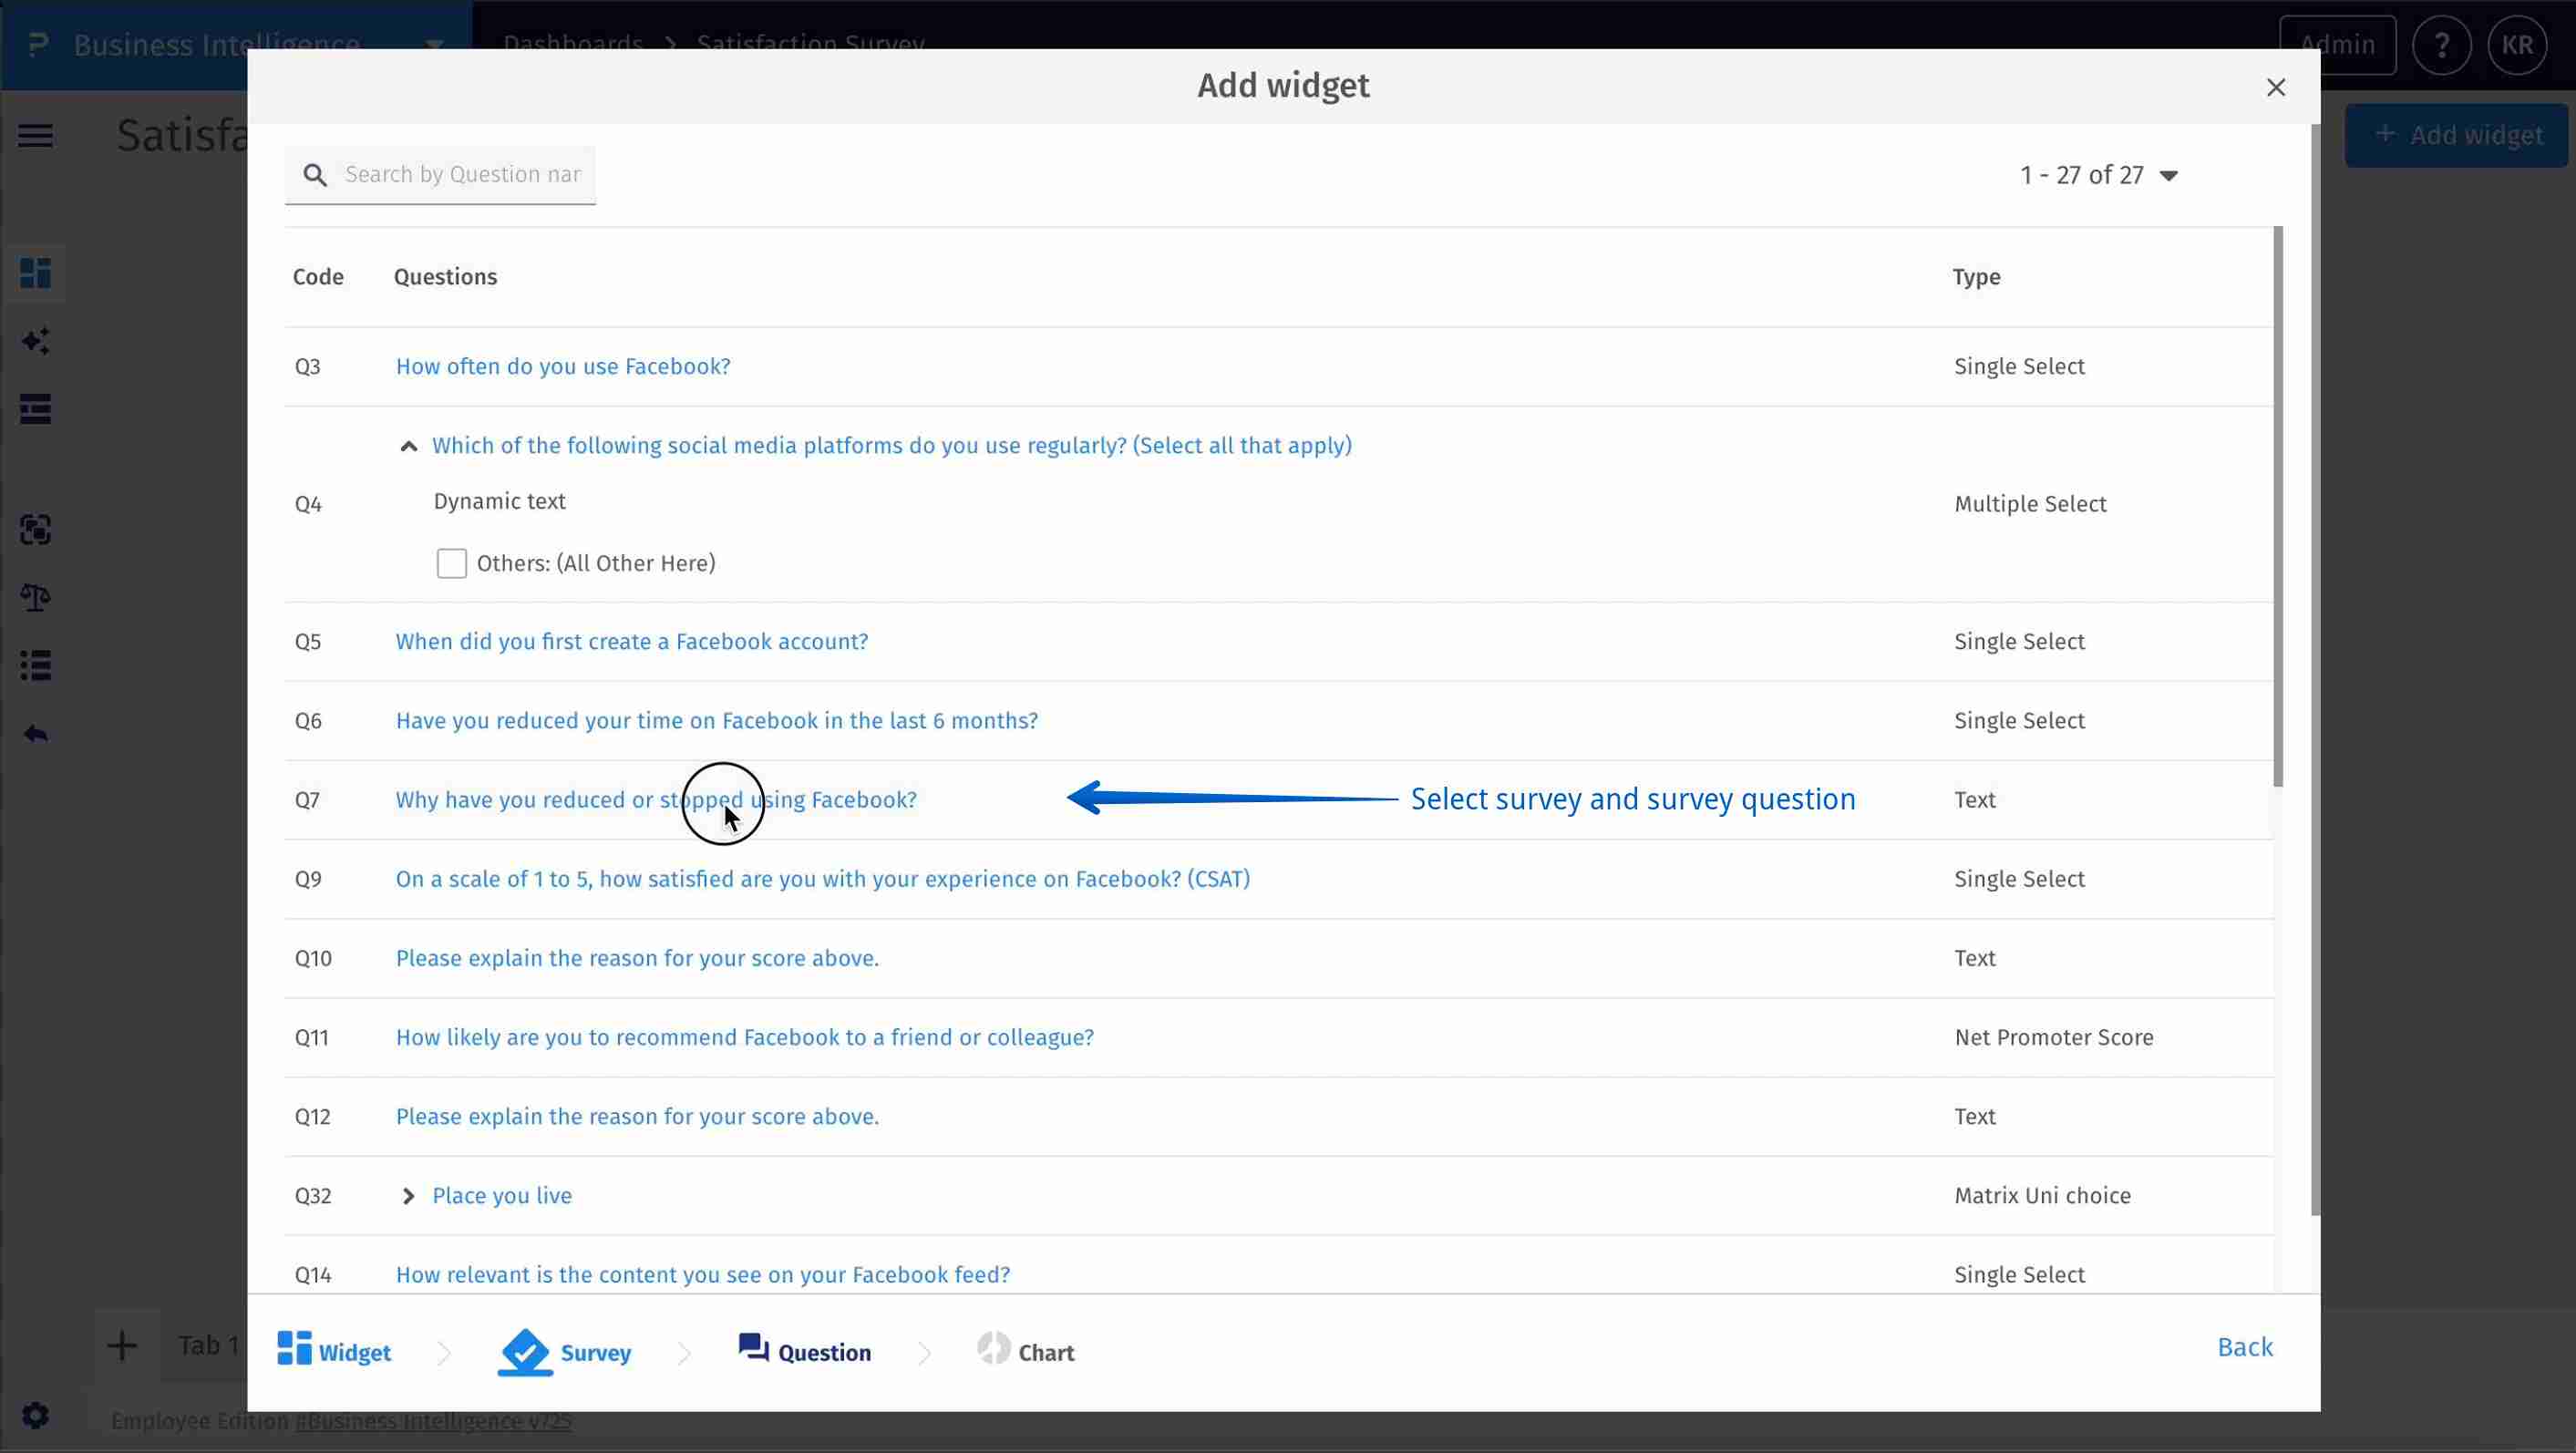
- Step 4: Select your widget – Choose the Topic stackbar widget and link it to a specific open-ended survey question.
- Step 5: Select survey and question – Select the relevant survey and choose a text-based (open-ended) question.
- Step 6: Select stackbar – Reconfirm your survey and open-ended question to configure the widget properly.
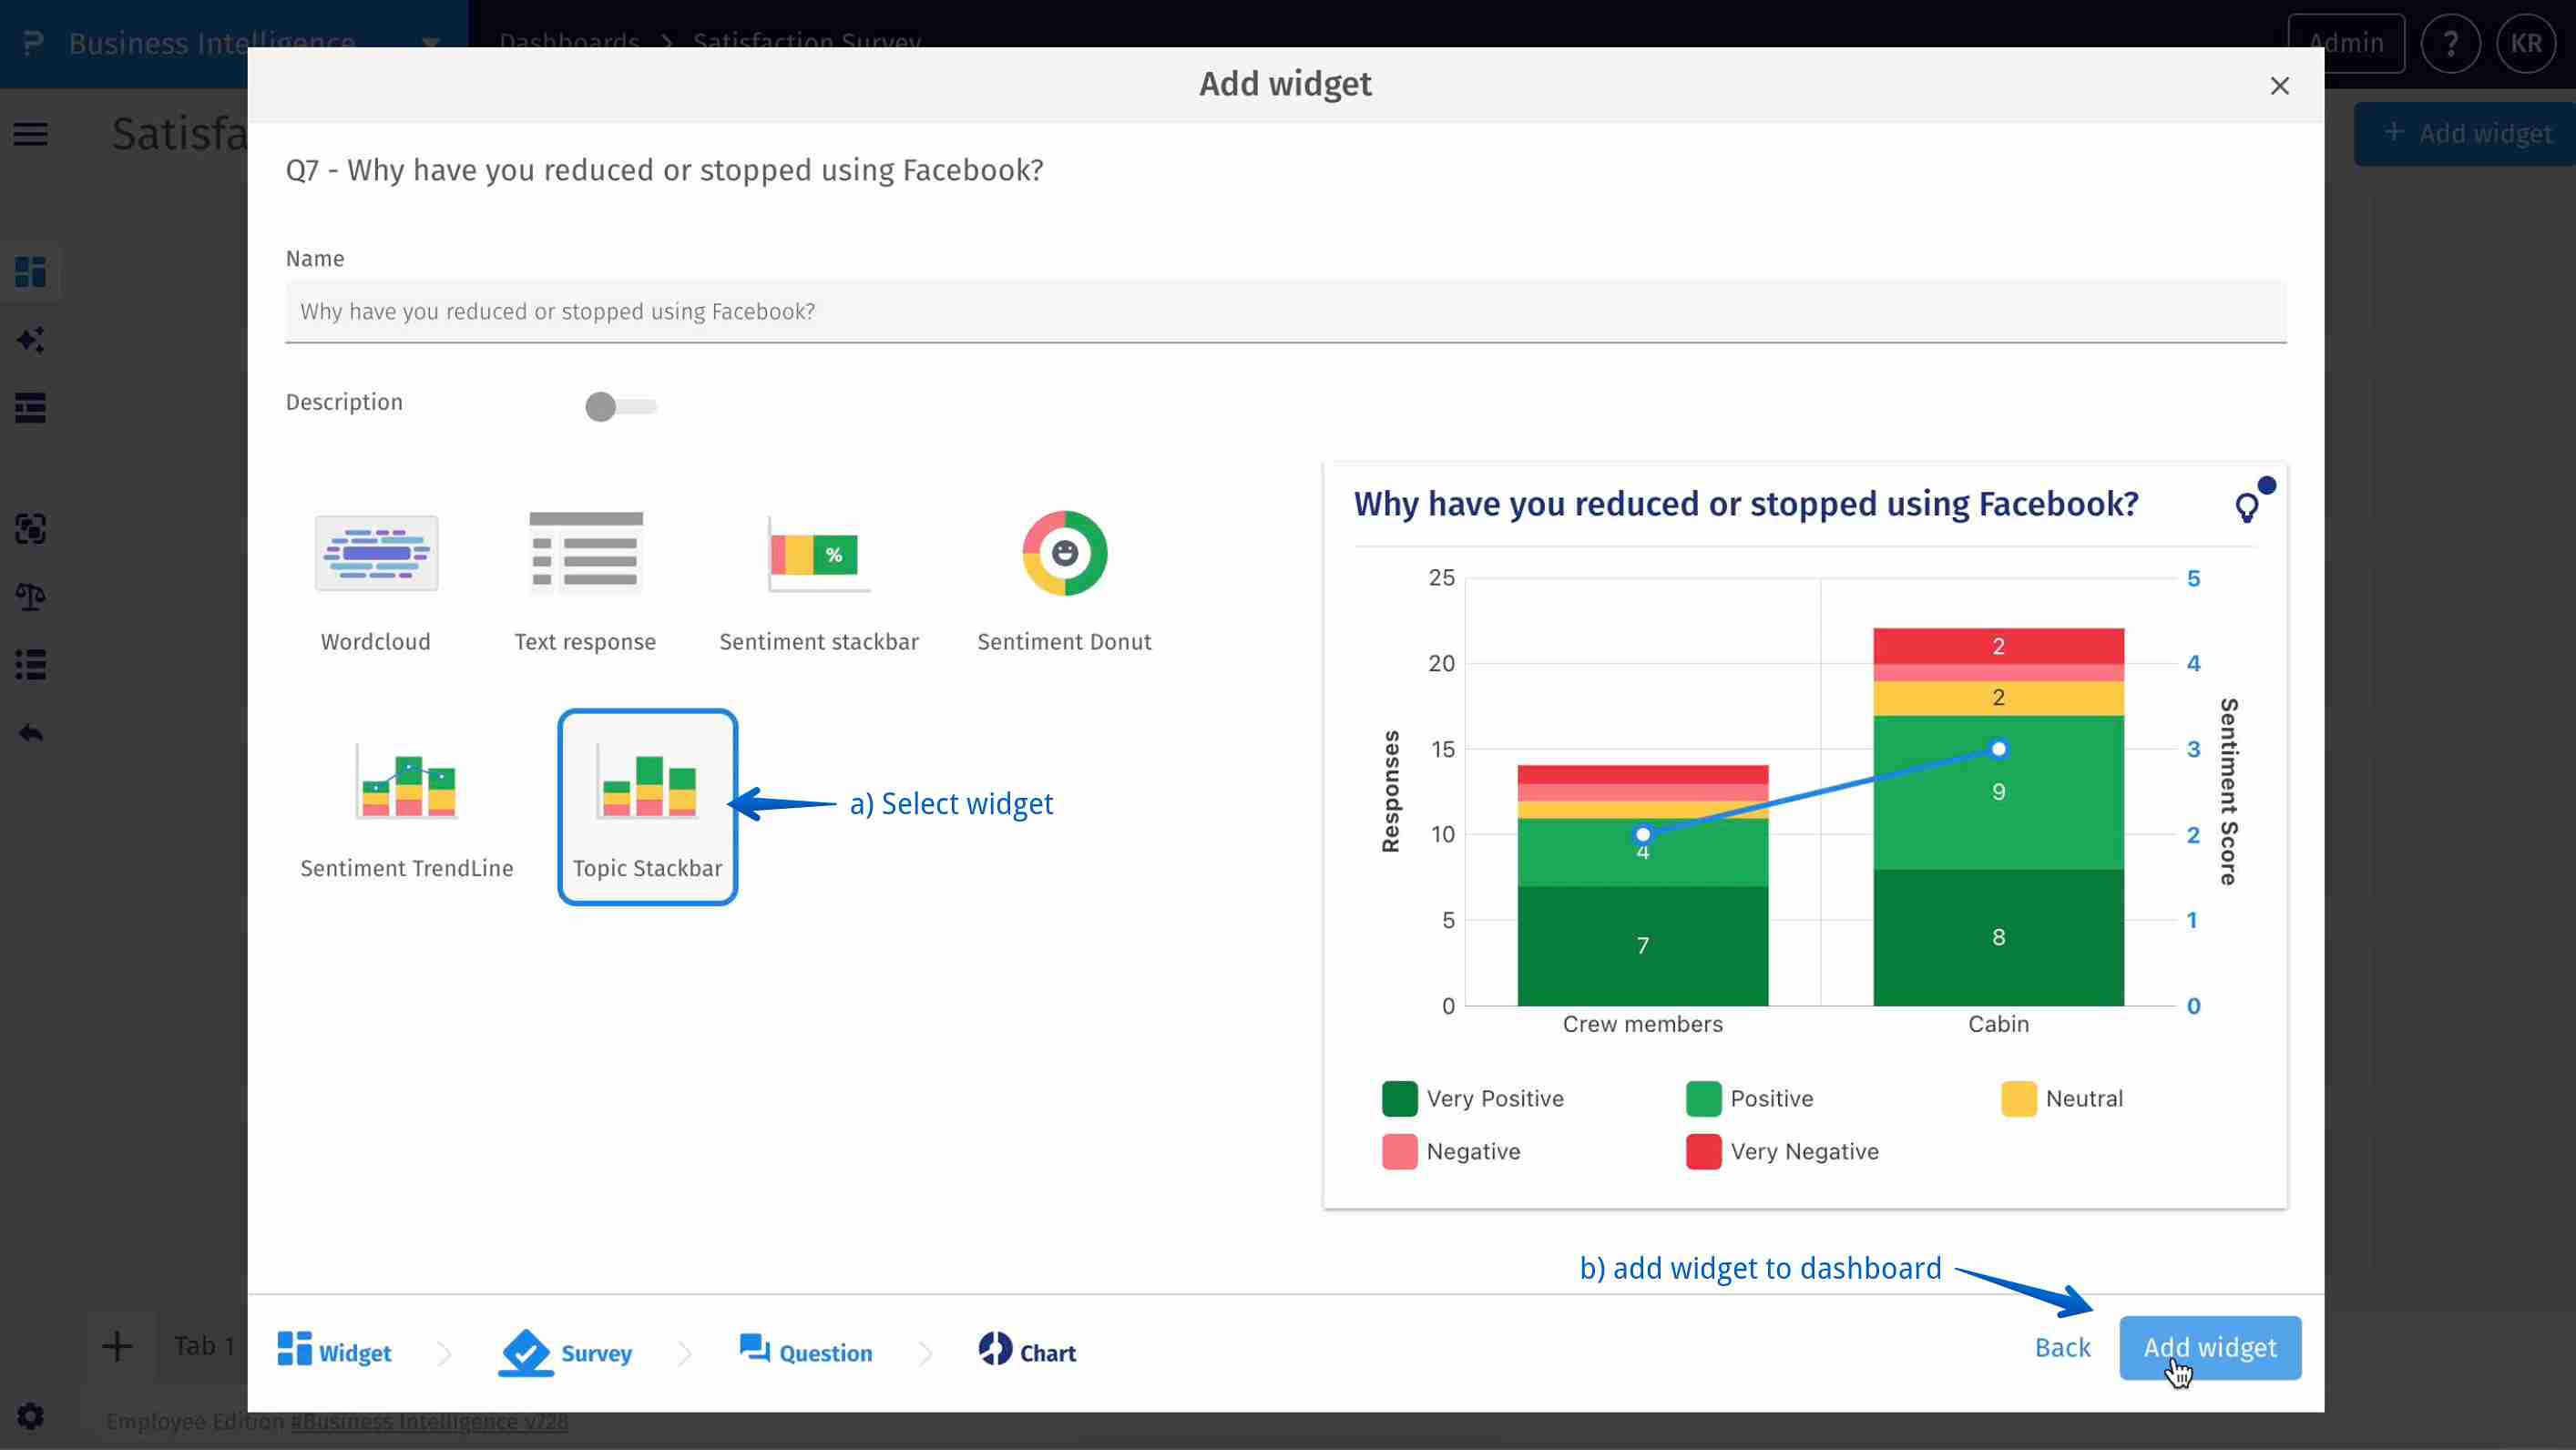
- Step 7: Topic stackbar widget – The widget visually breaks down sentiment by topic in a stacked bar format.
Each bar represents a topic, with color-coded segments showing proportions of Very Positive, Positive, Neutral, Negative, and Very Negative responses.
A line chart overlays the bars to display the overall sentiment score per topic.
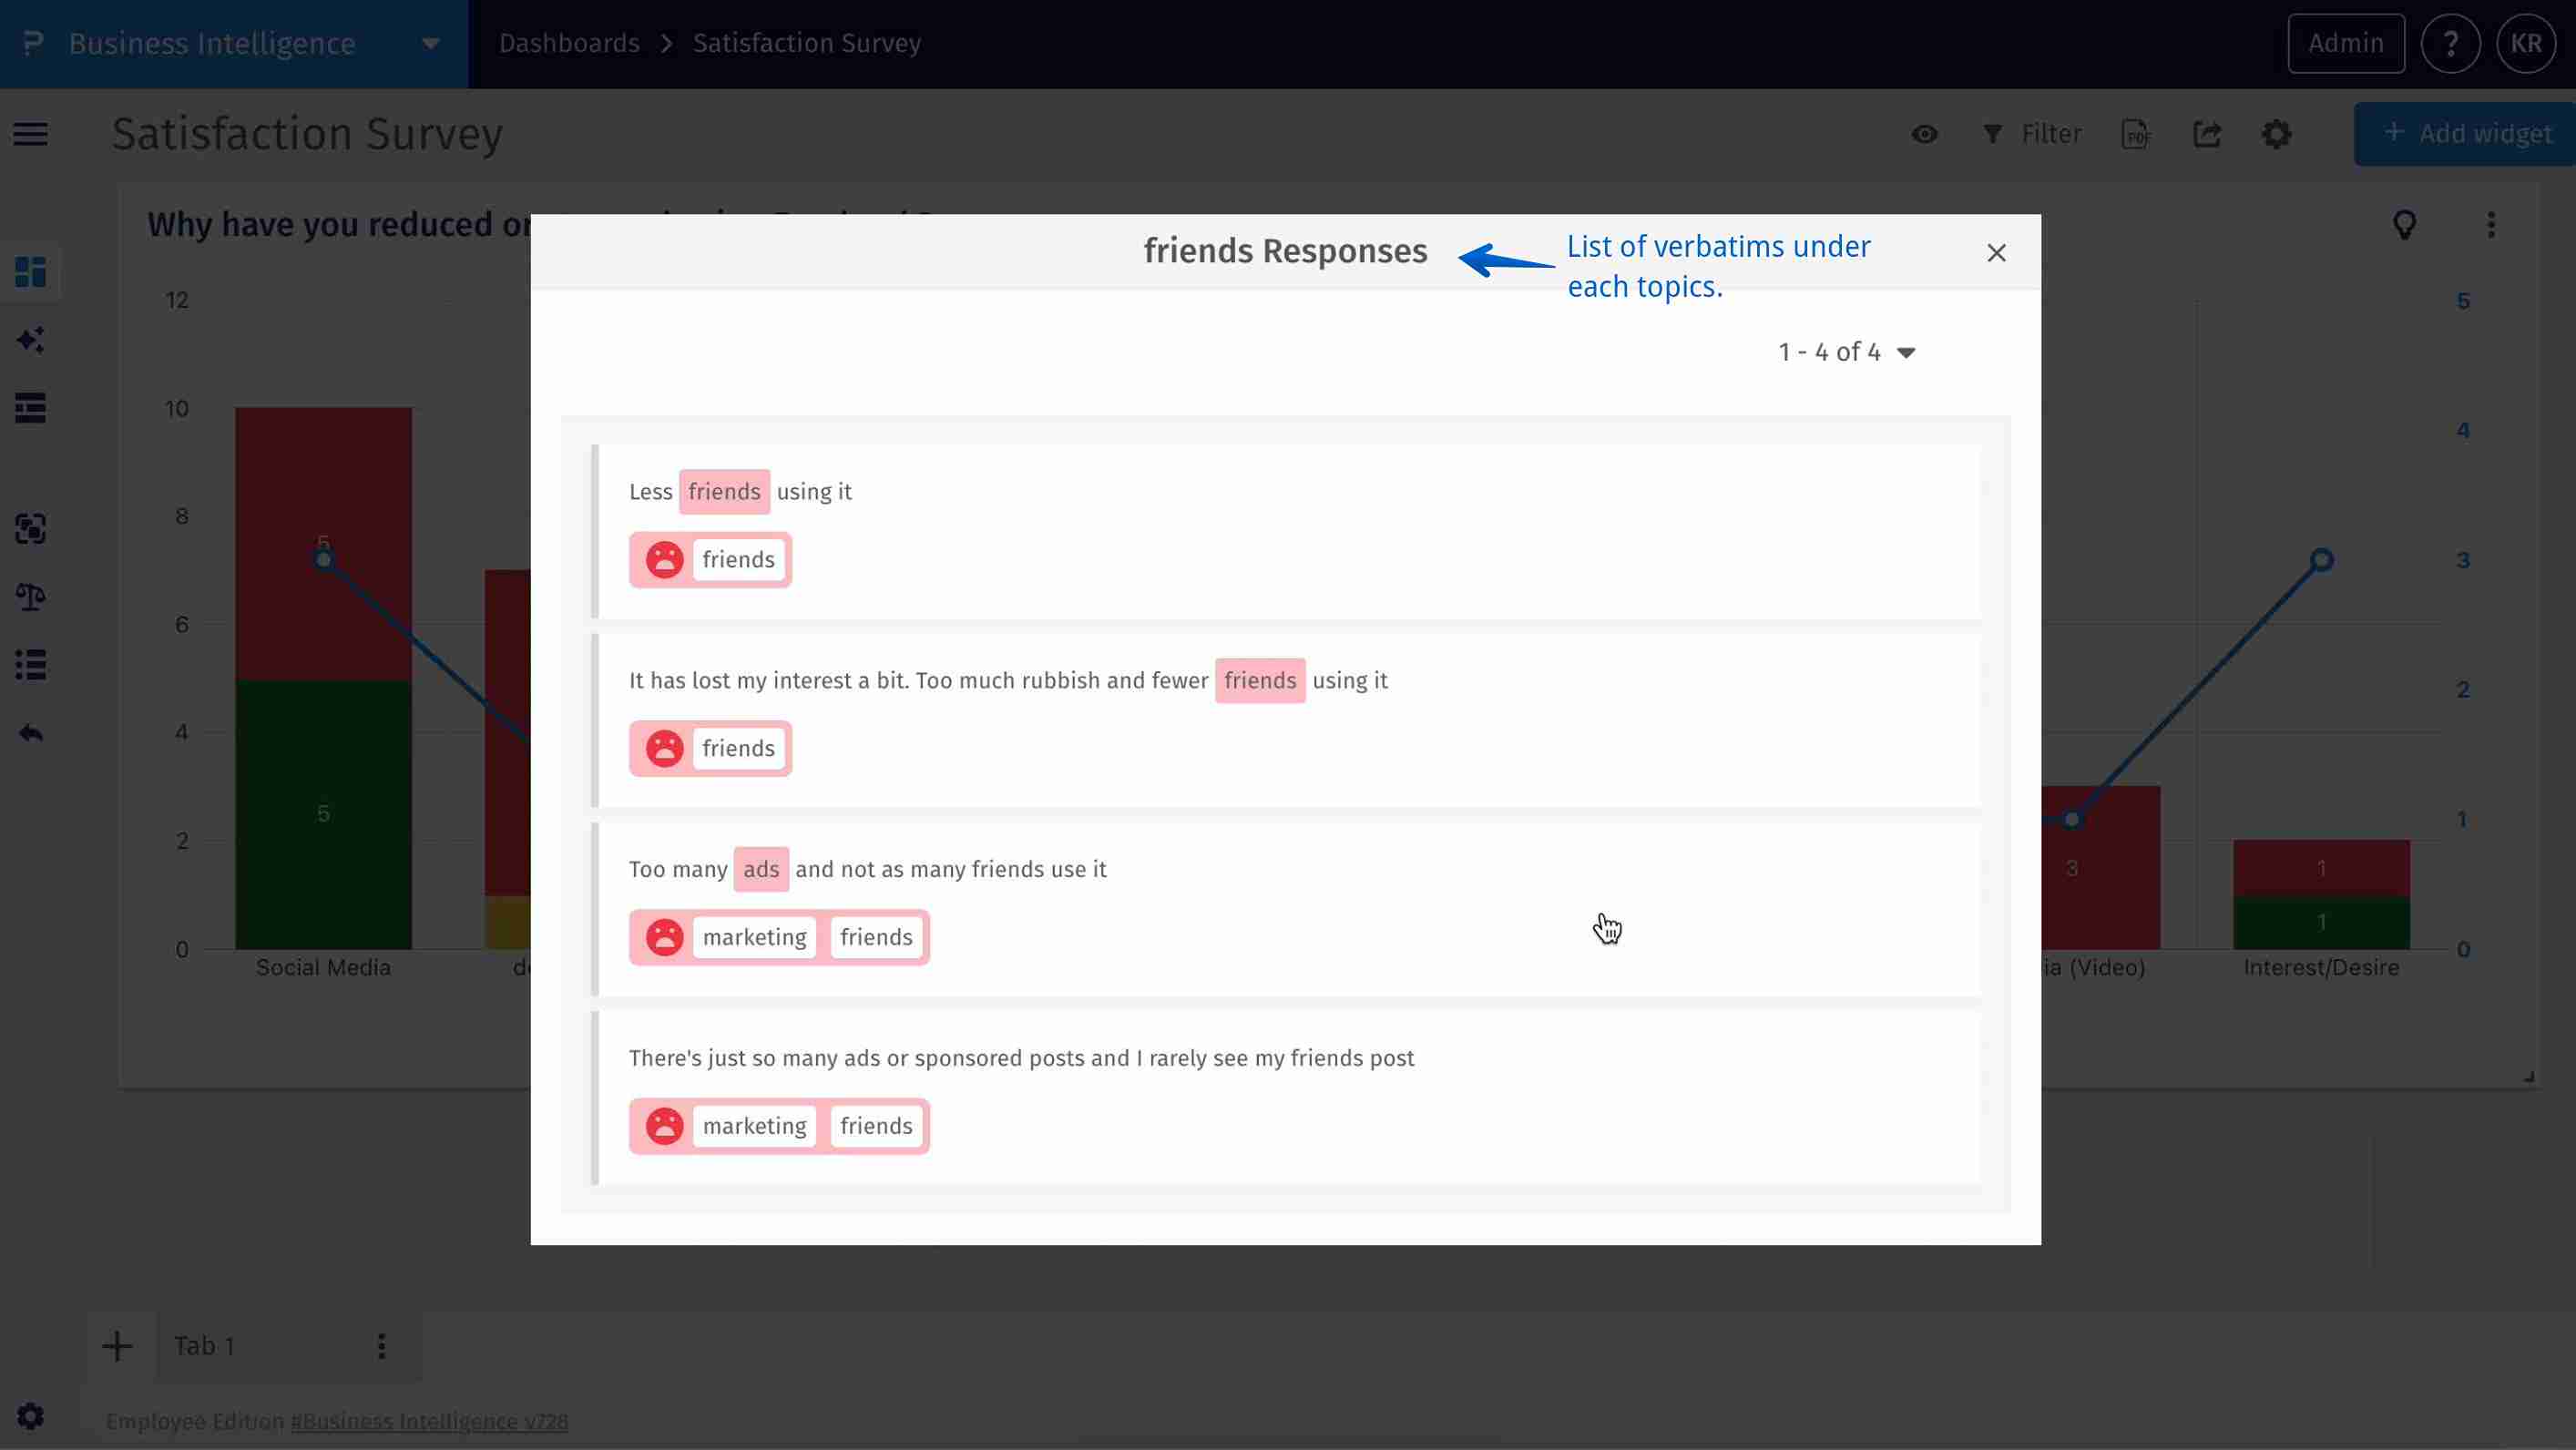
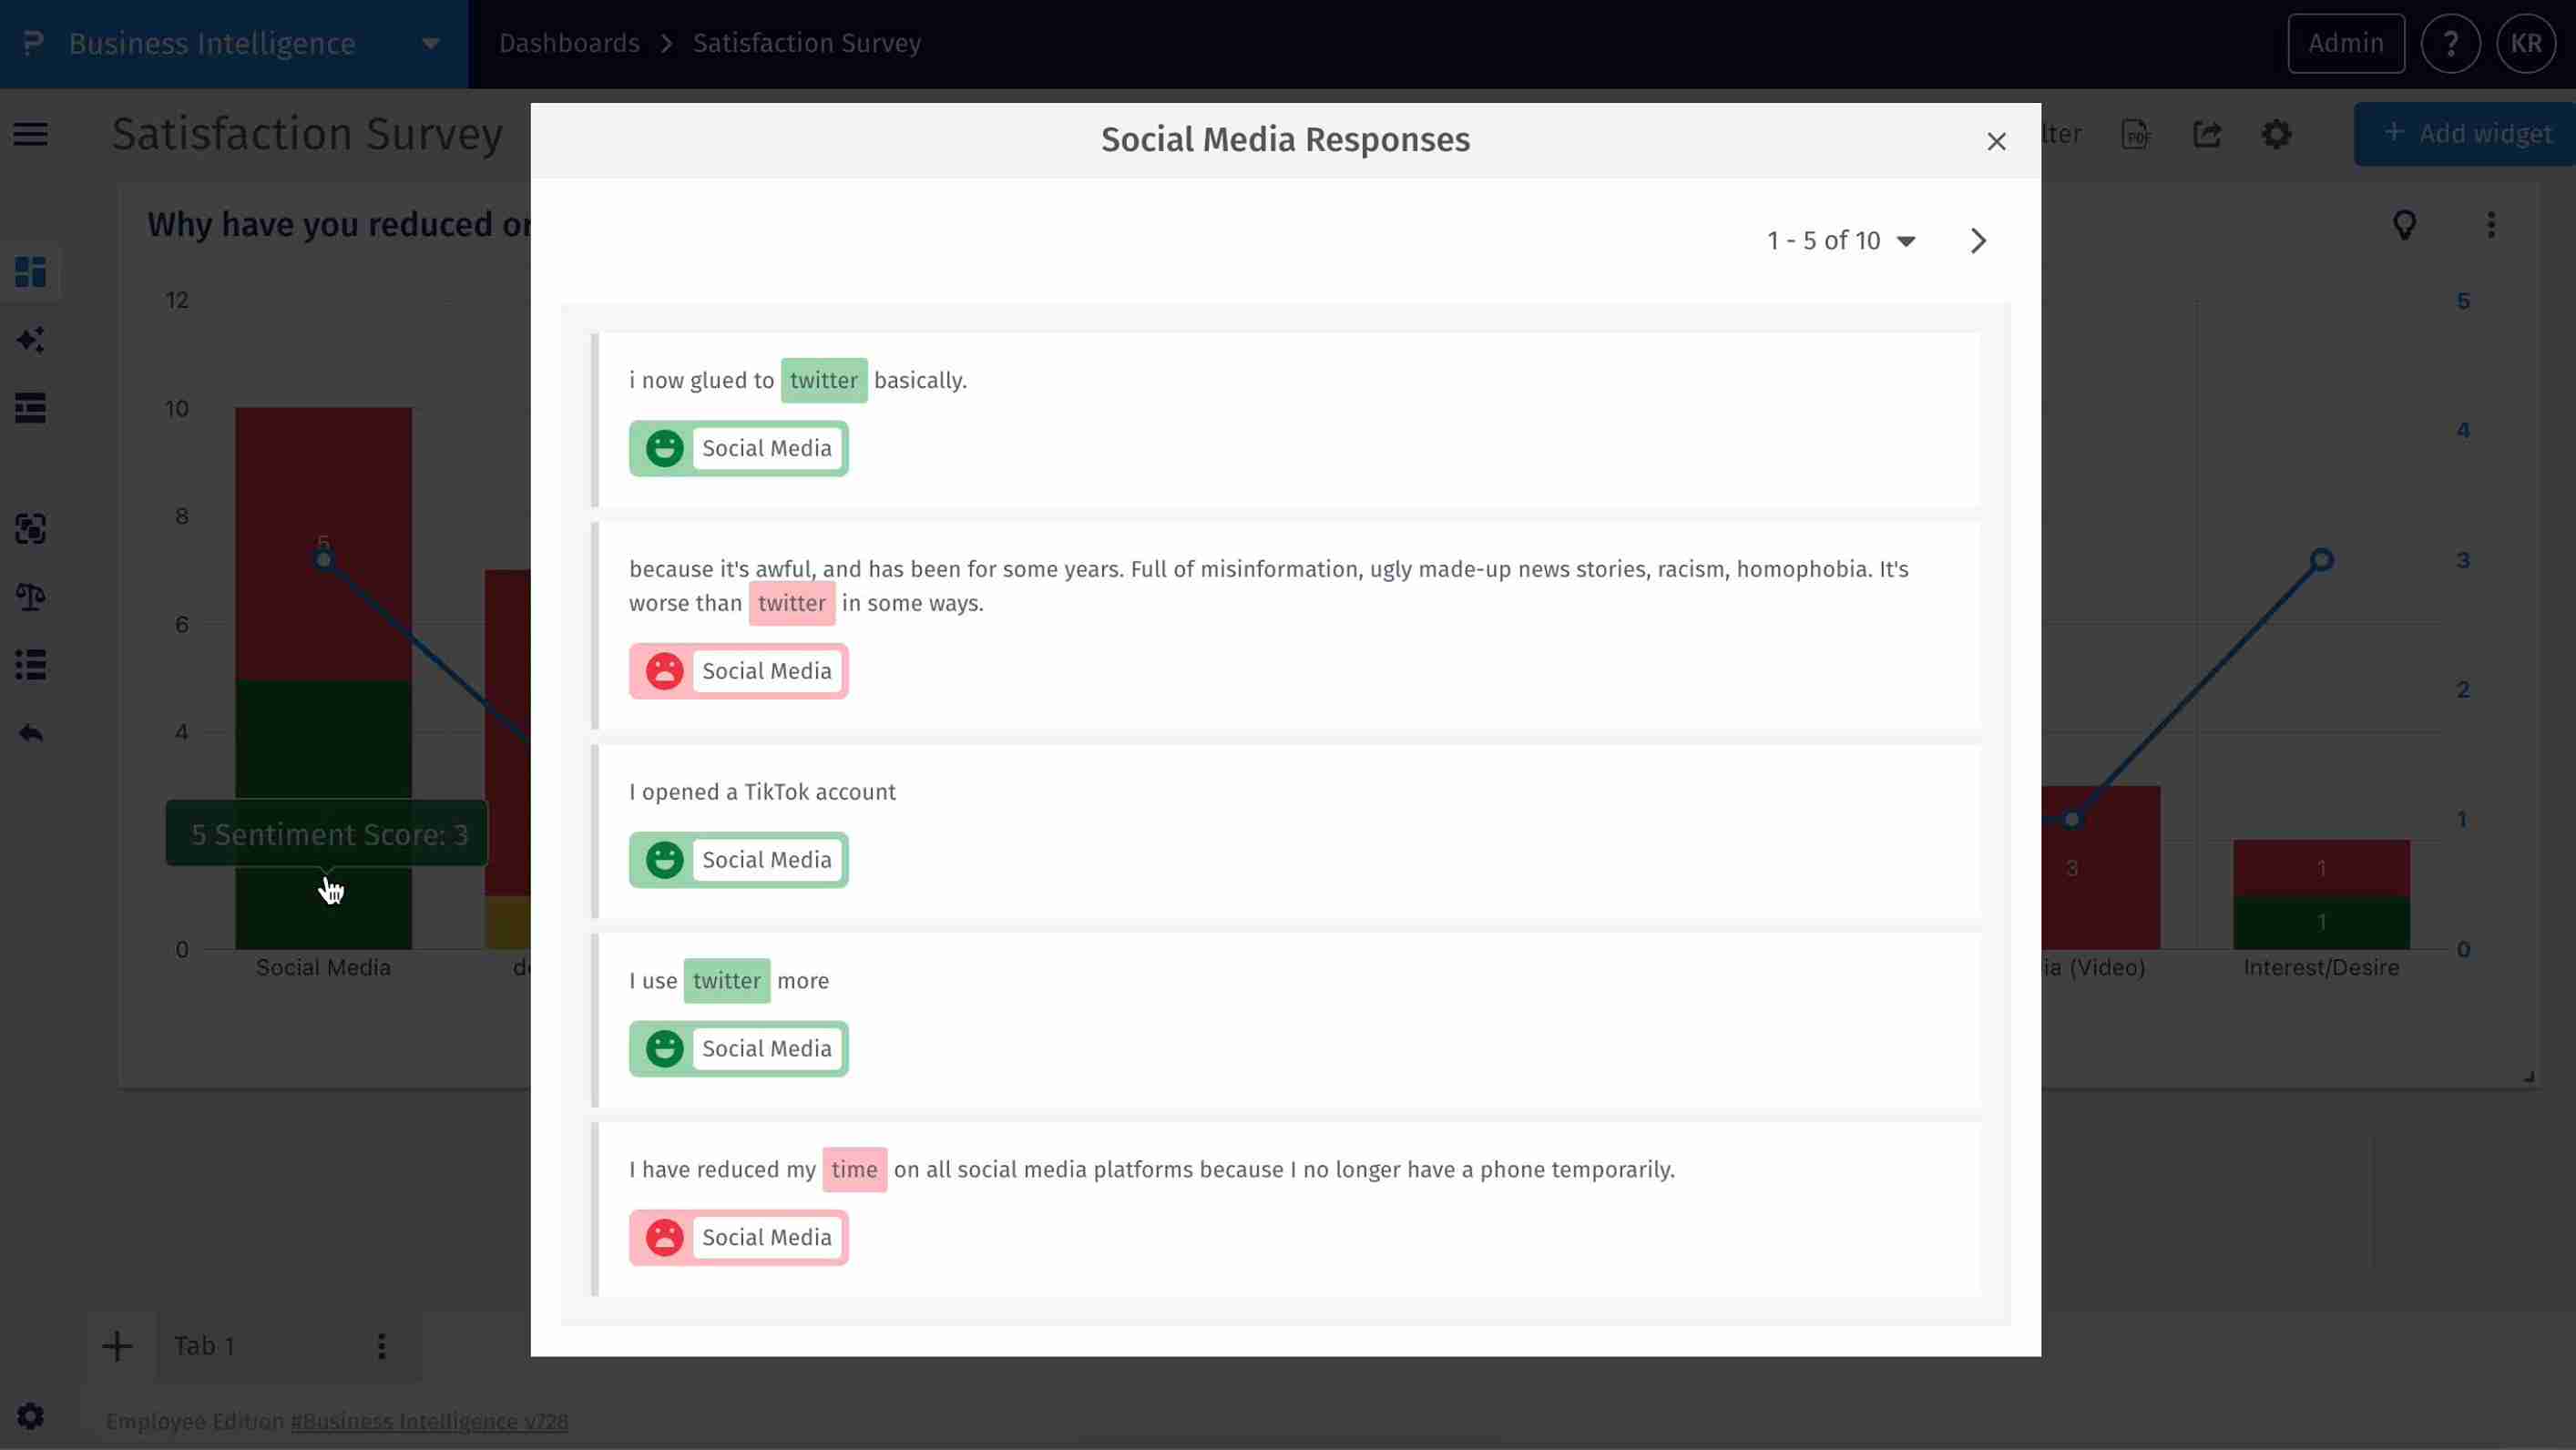
- Step 8: Click stackbar for comment – Users can click on any sentiment segment to view underlying comments.
- Step 9: List of comments – Browse through comments and their assigned sentiments.
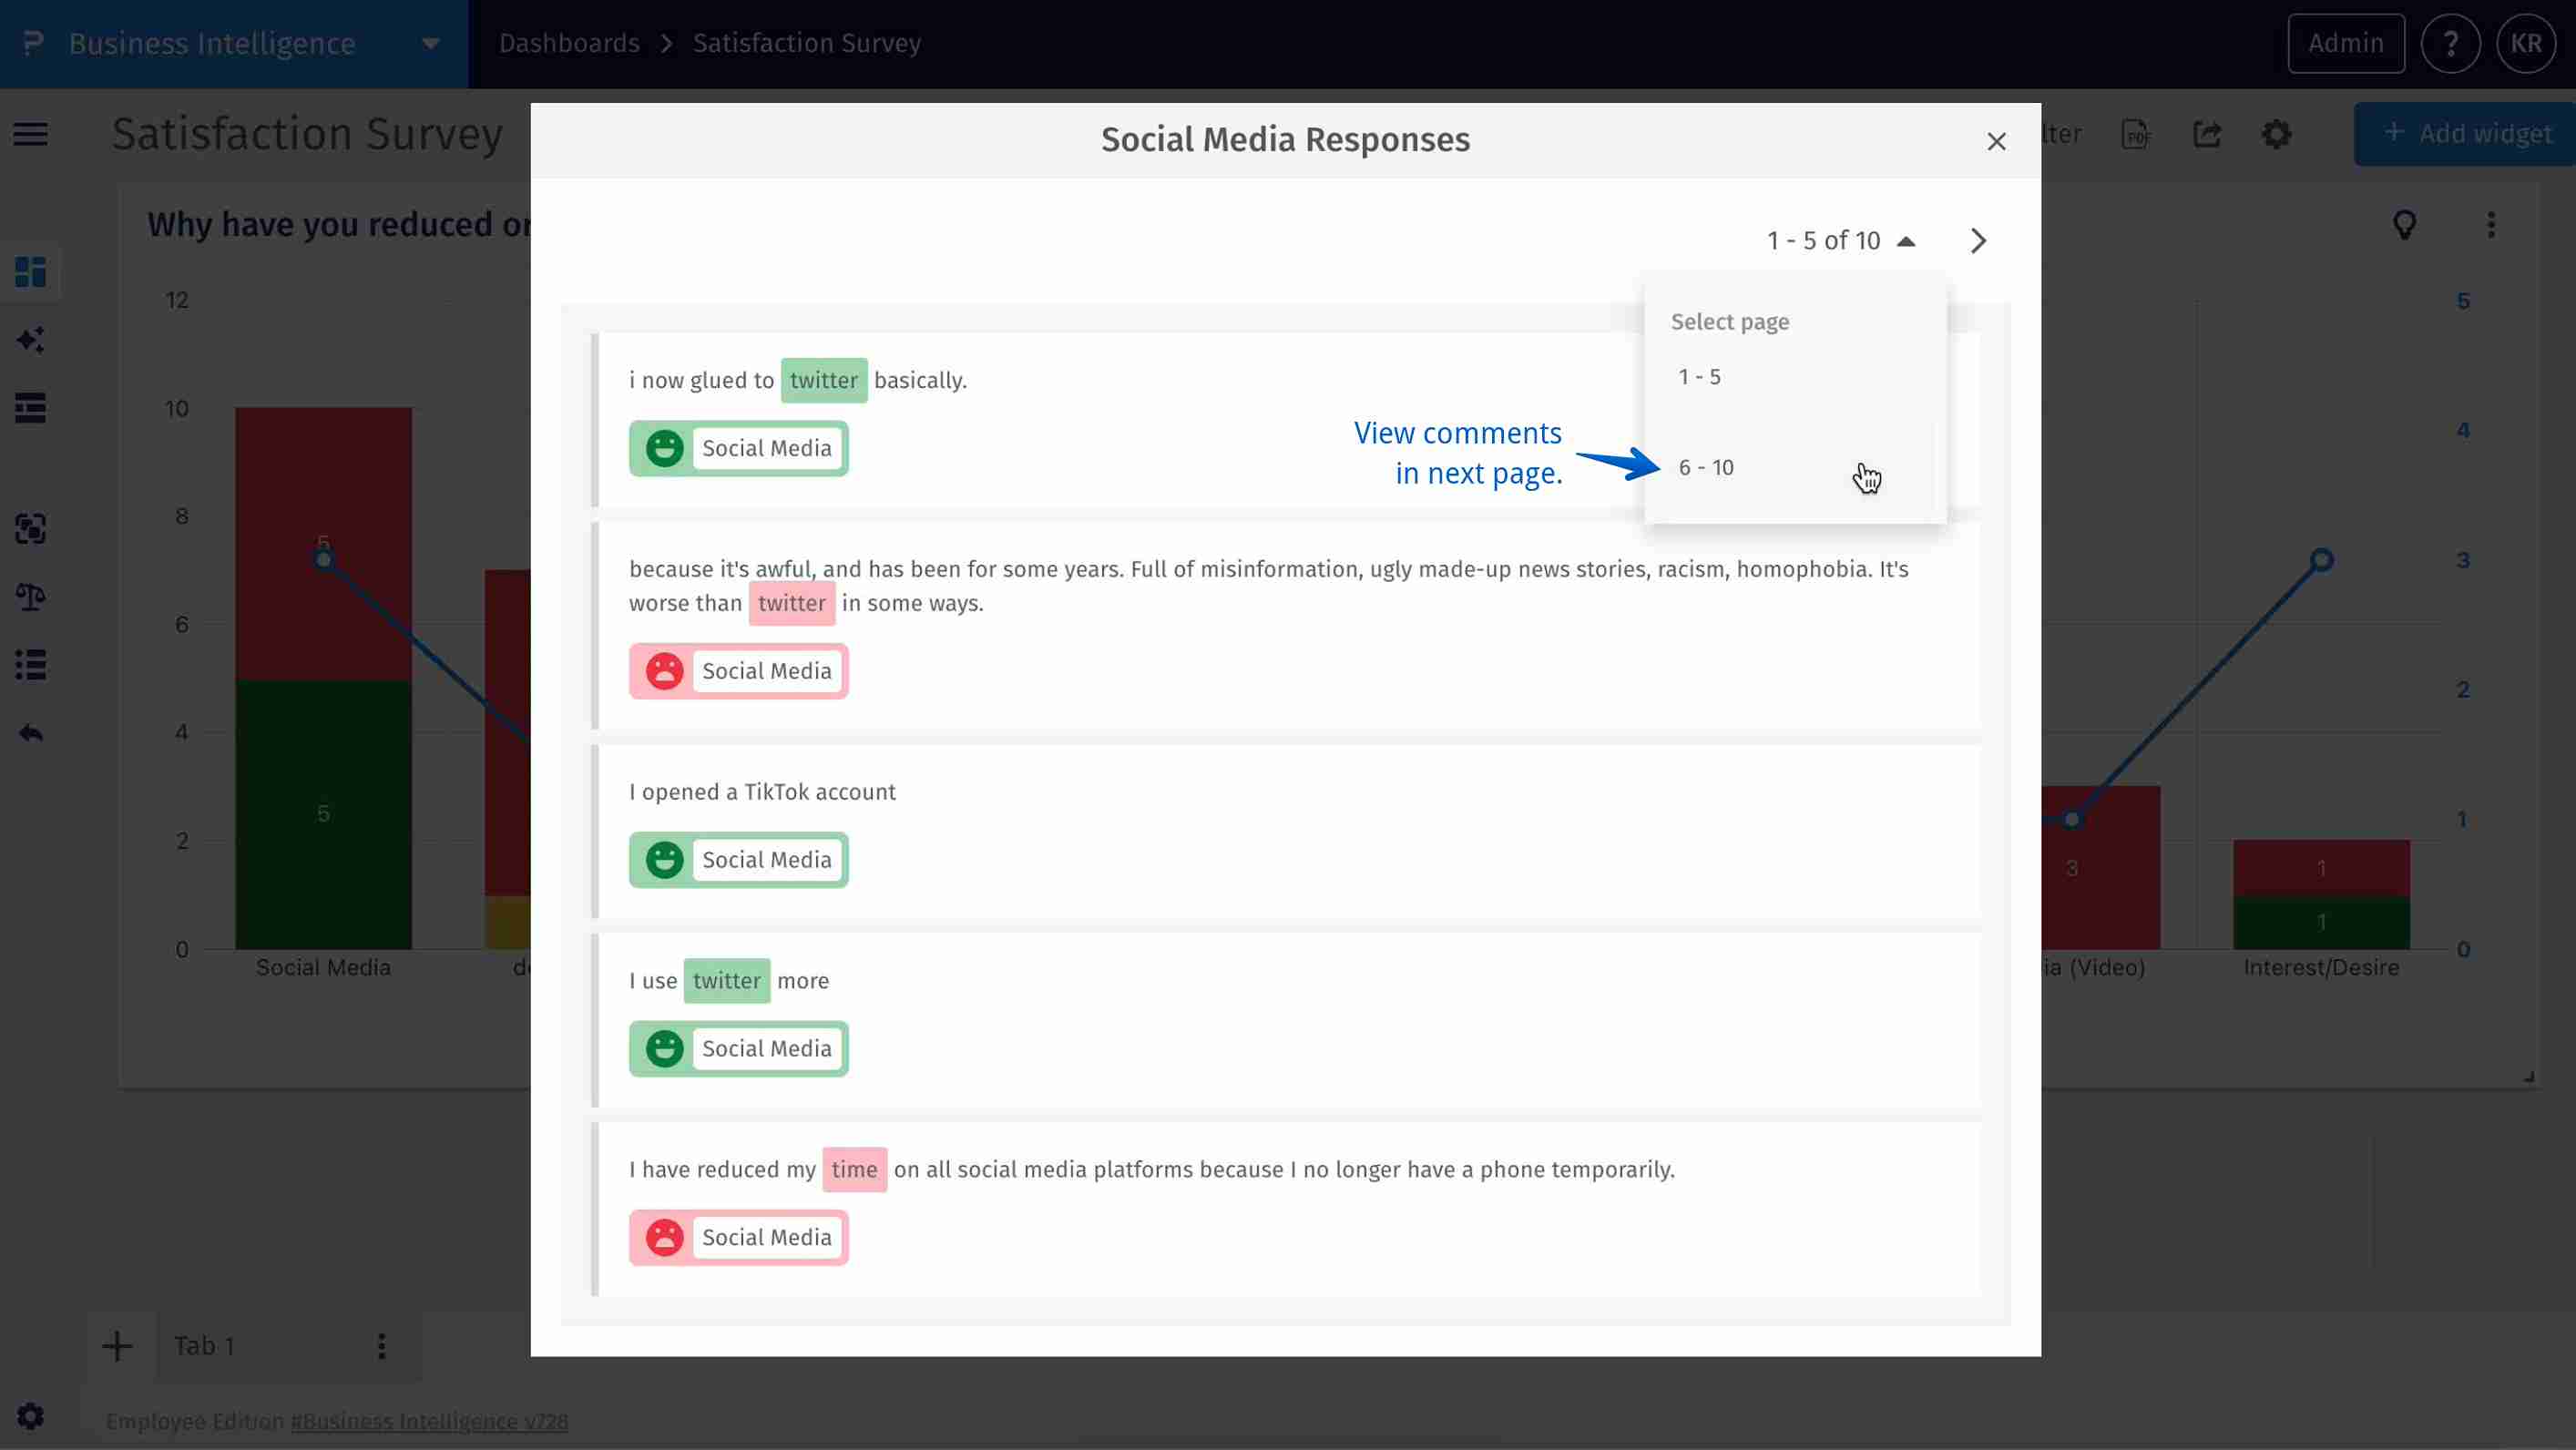
- Step 10: Select page to view next set of comments – Use pagination to navigate through more responses.
- Sentiment: A classification of respondent tone as Very Positive, Positive, Neutral, Negative, or Very Negative.
- Topic: A keyword or theme identified in open-ended responses through automated or manual tagging.
- Stacked Bar Chart: A chart type where individual categories (sentiment levels) are stacked on top of one another in a single bar to show proportionality.
- Sentiment Score: A numerical representation of the overall sentiment for a topic (e.g., weighted average from -2 to +2).
- Drill-down: A feature allowing users to click on a chart element to explore the detailed data behind it.