


Segment Trends Help Documentation
A robust tool that empowers businesses to monitor and analyze the ever-changing landscape of consumer behavior and preferences over time. This analysis can be focused on specific consumer segments or broader population cohorts. By understanding these dynamic shifts, companies can proactively adapt their products, services, and marketing strategies to better align with evolving consumer expectations and maintain a competitive edge.
Segment Trend allows users to draw correlations between specific events and shifts in consumer behavior or perception. These correlations can be further hypothesized and tested using business intelligence (BI) statistical methods to establish causation. By identifying causal relationships, businesses gain a competitive advantage in understanding and connecting with their core customers.
- Tracks Consumer Behavior and Preferences: Segment Trend allows businesses to monitor how consumer behavior and preferences shift over time.
- Identifies Trends and Patterns: By analyzing historical data and current market conditions, Segment Trend can identify emerging trends and patterns in consumer behavior.
- Focuses on Specific Consumer Segments: Businesses can use Segment Trend to track the behavior and preferences of specific consumer segments.
- Correlates Events with Behavior Shifts: Segment Trend enables users to identify correlations between specific events and shifts in consumer behavior or perception.
- Supports Hypothesis Testing and Causation: Businesses can test hypotheses and establish causal relationships between events and consumer behavior.
- Facilitates Competitive Advantage: Understanding and anticipating customer needs helps businesses develop targeted strategies.
Login to BI > Add Widget > Segment Trend > Select Survey > Select Question > Create Segment > Save.
- Step 1: Login to BI > Add Widget
- Step 2: Login to BI > Add Widget > Segment Trend
- Step 3: Login to BI > Add Widget > Segment Trend > Select Survey
- Step 4: Login to BI > Add Widget > Segment Trend > Select Survey > Select Question > Create Segment > Save.
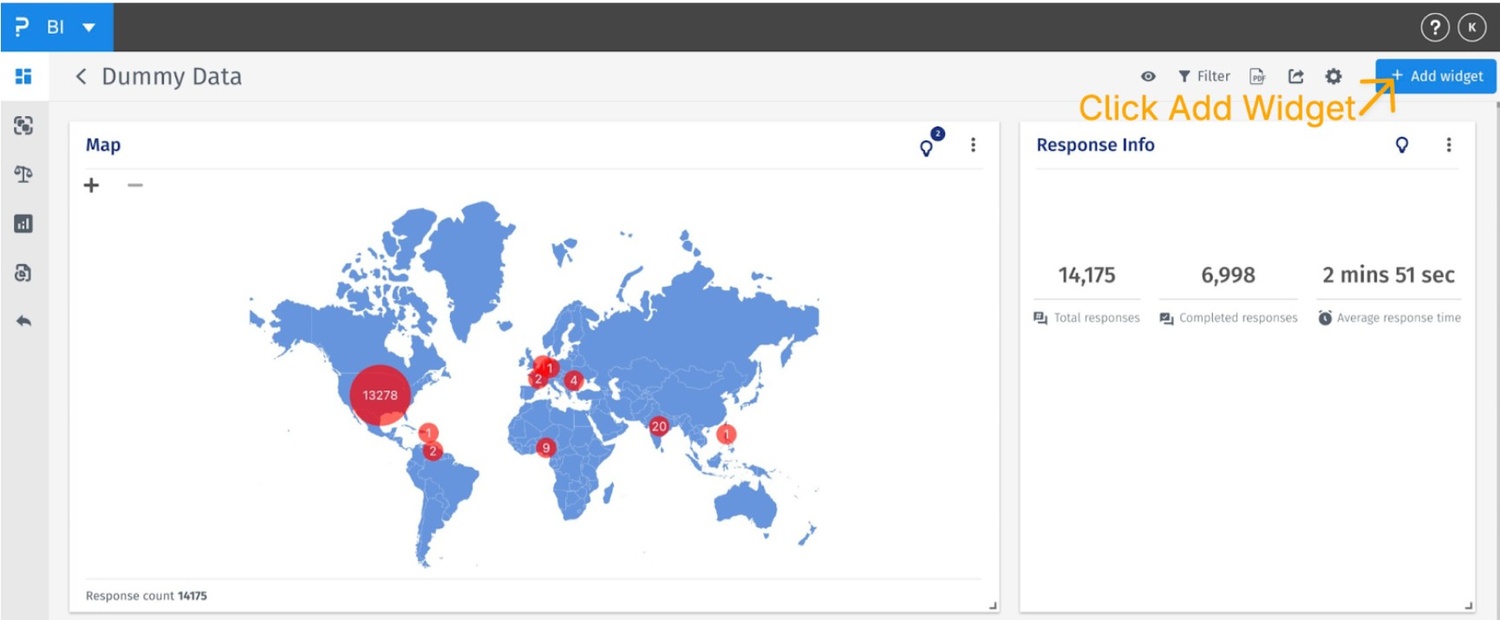
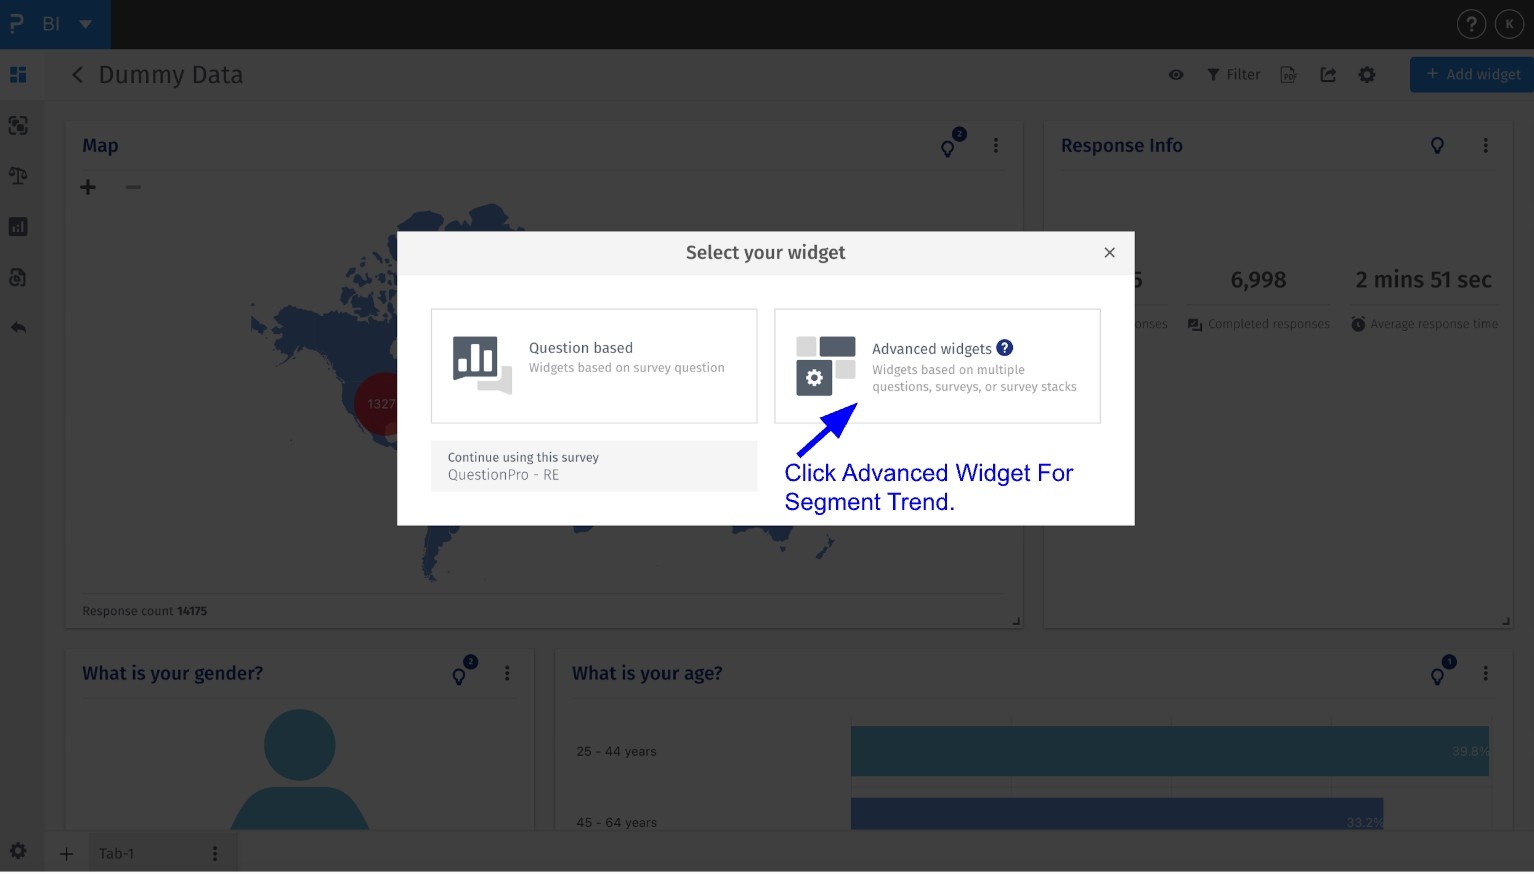
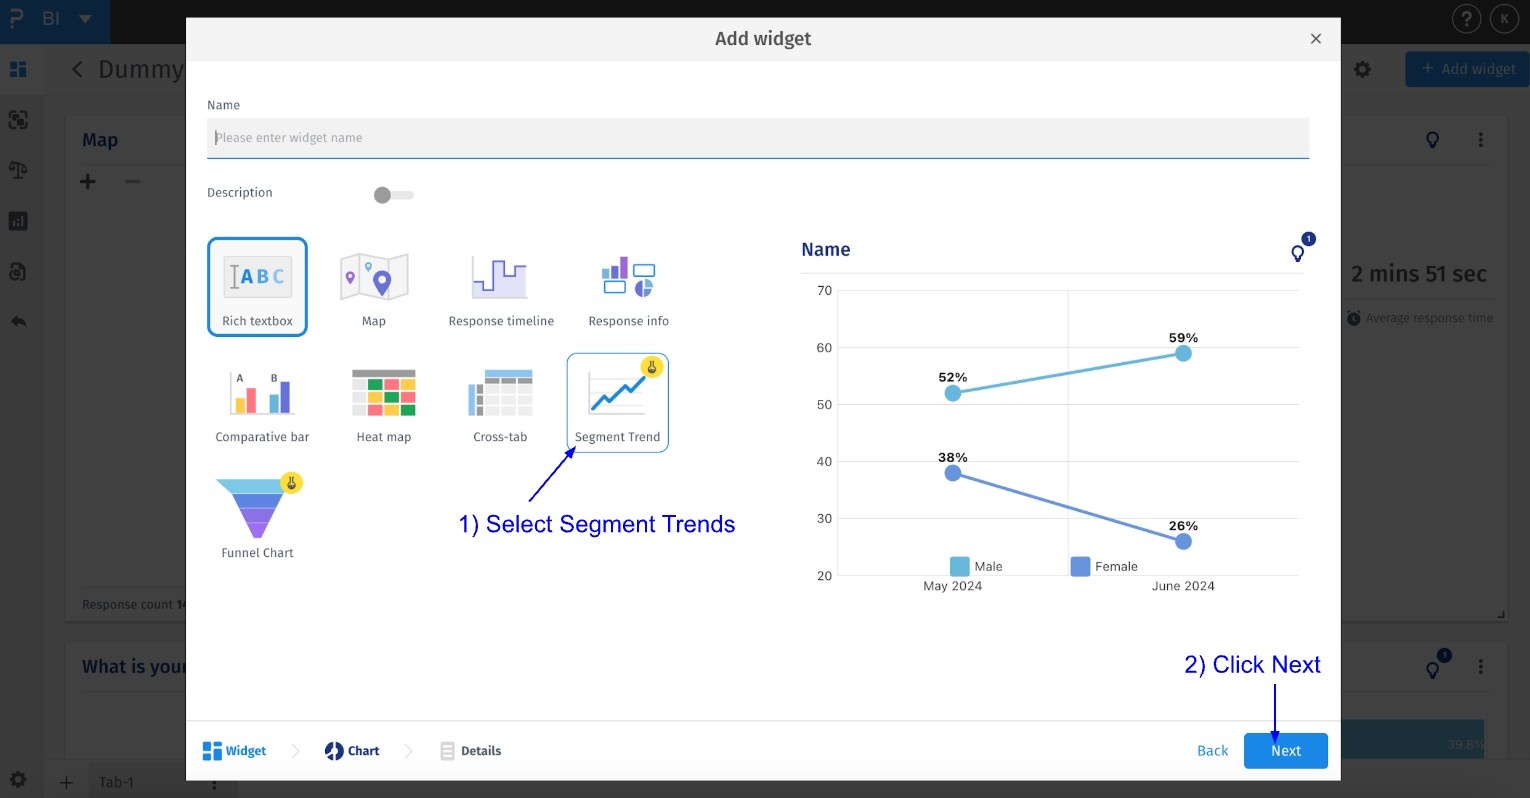
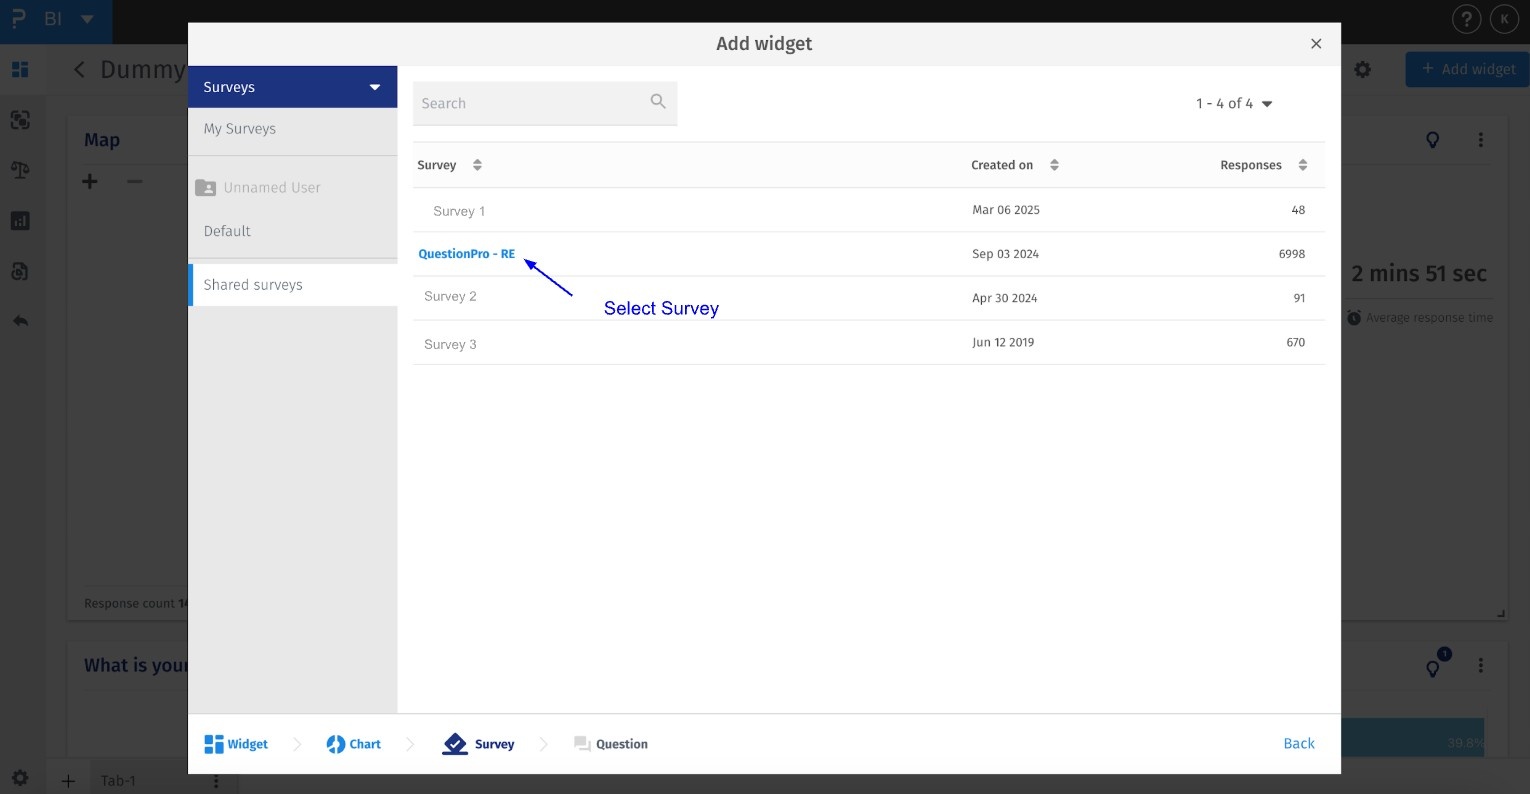
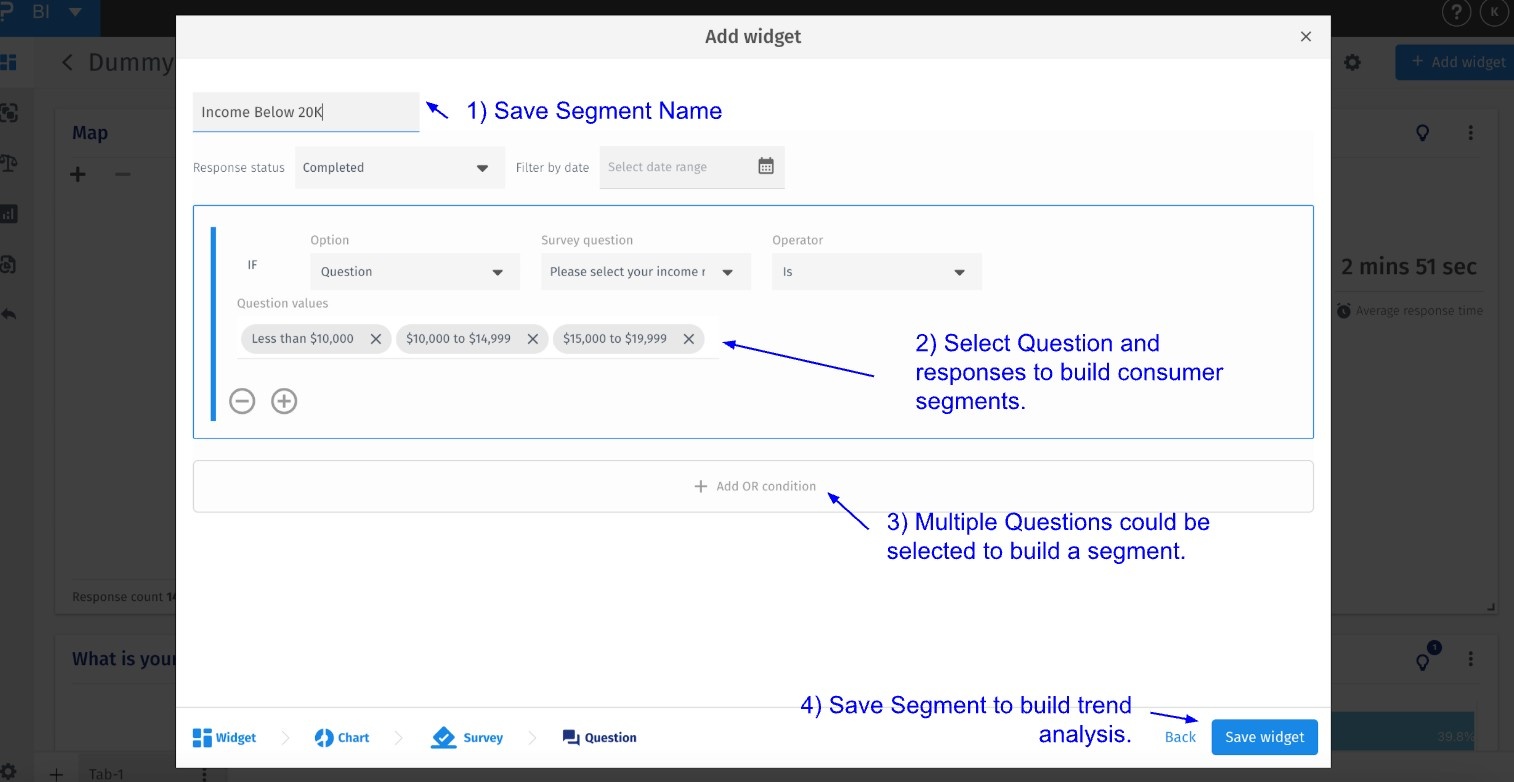
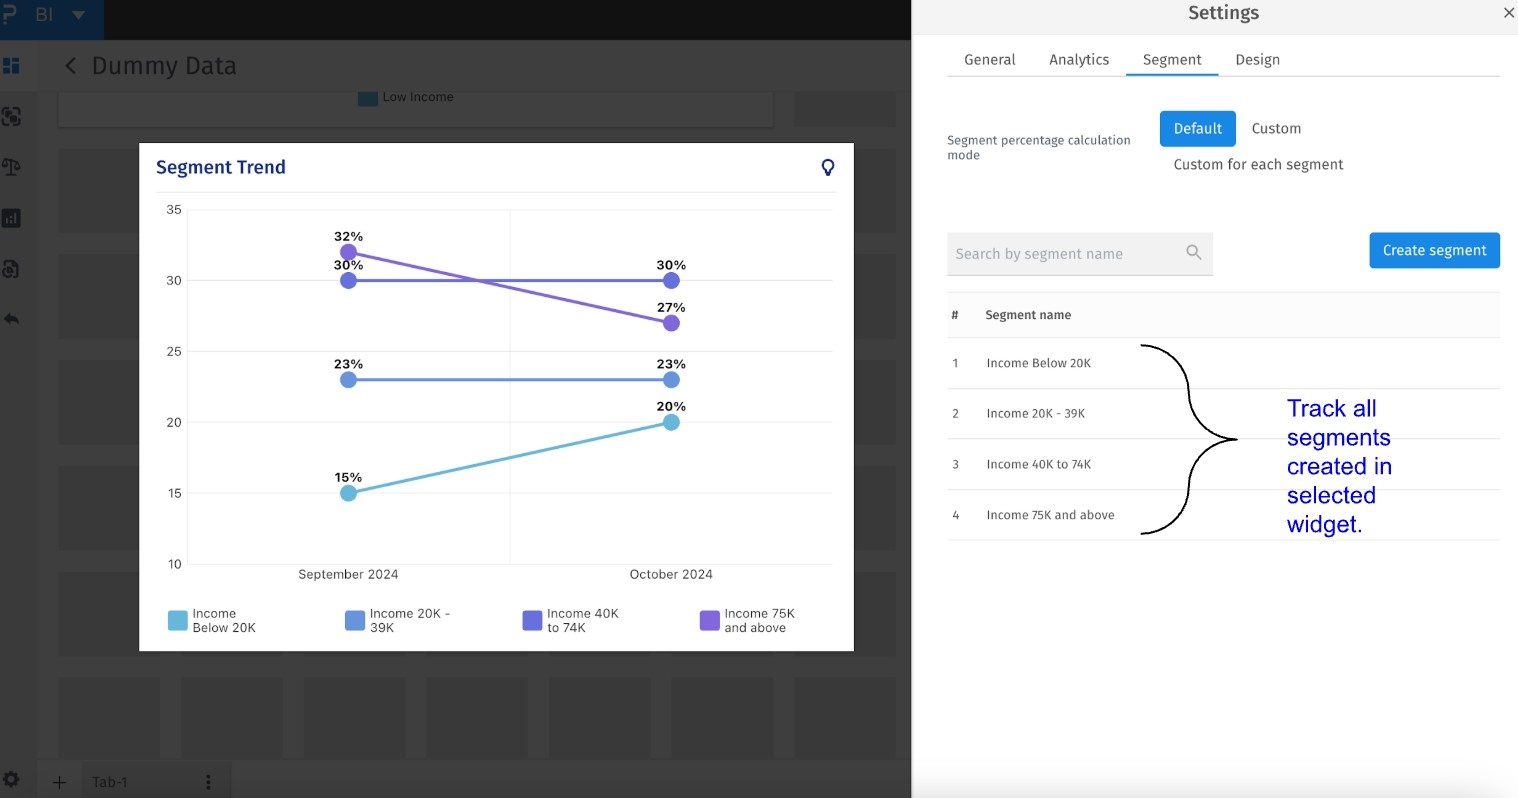
Segment formation is based on the hypothesis you would like to test through your analysis. QP’s BI platform allows you to build complex consumer segments by combining demographics, preferences, psychographics, and usage questions to track patterns among critical user personas.
By leveraging the data and insights provided by QuestionPro's BI platform, companies can develop a deeper understanding of their customers and create strategies that drive growth and success.
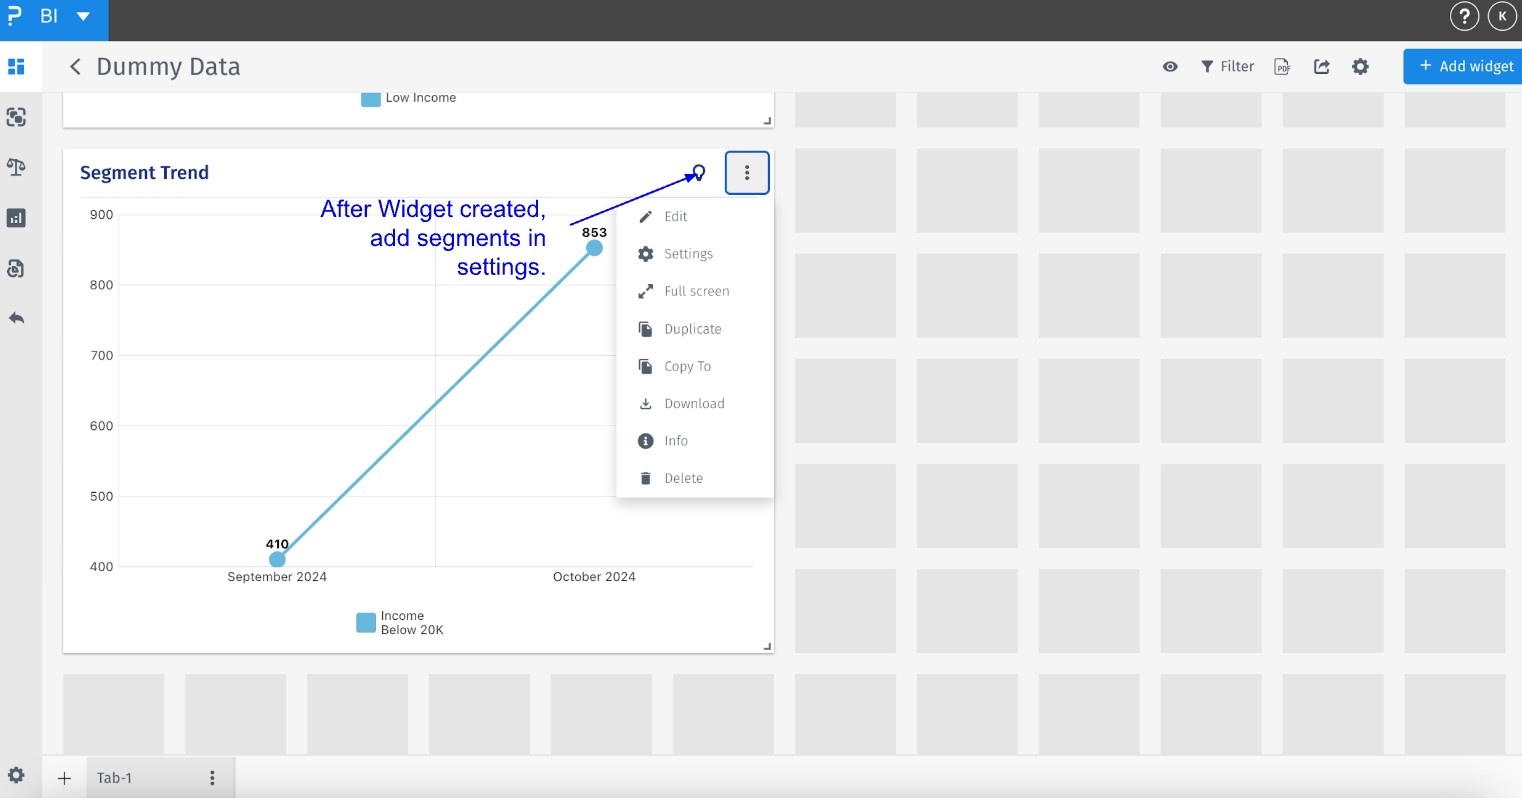
- Step 1: BI Segment Trend Widget > Settings
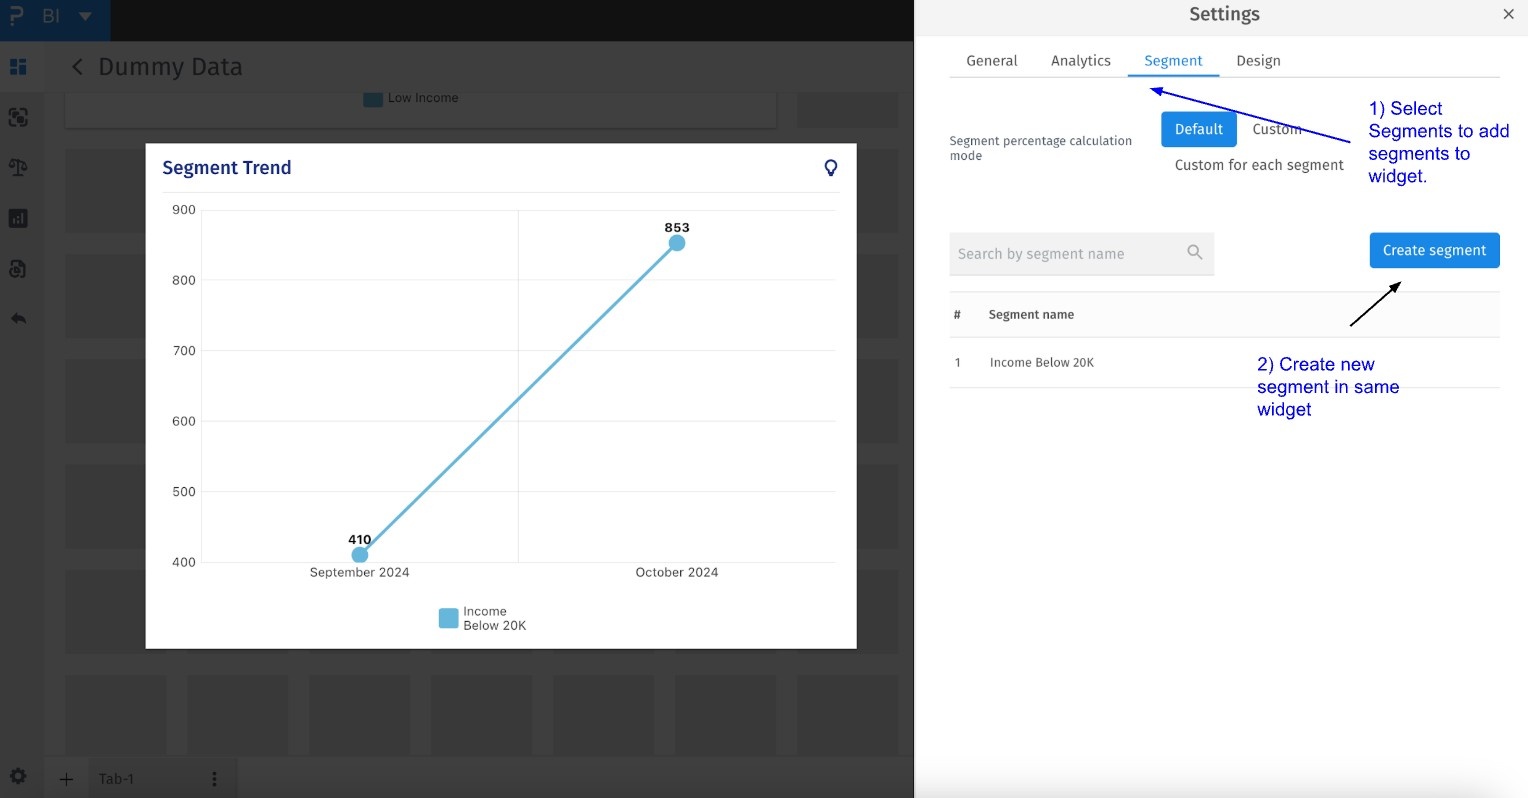
- Step 2: BI Segment Trend Widget > Settings > Segment > Create Segment
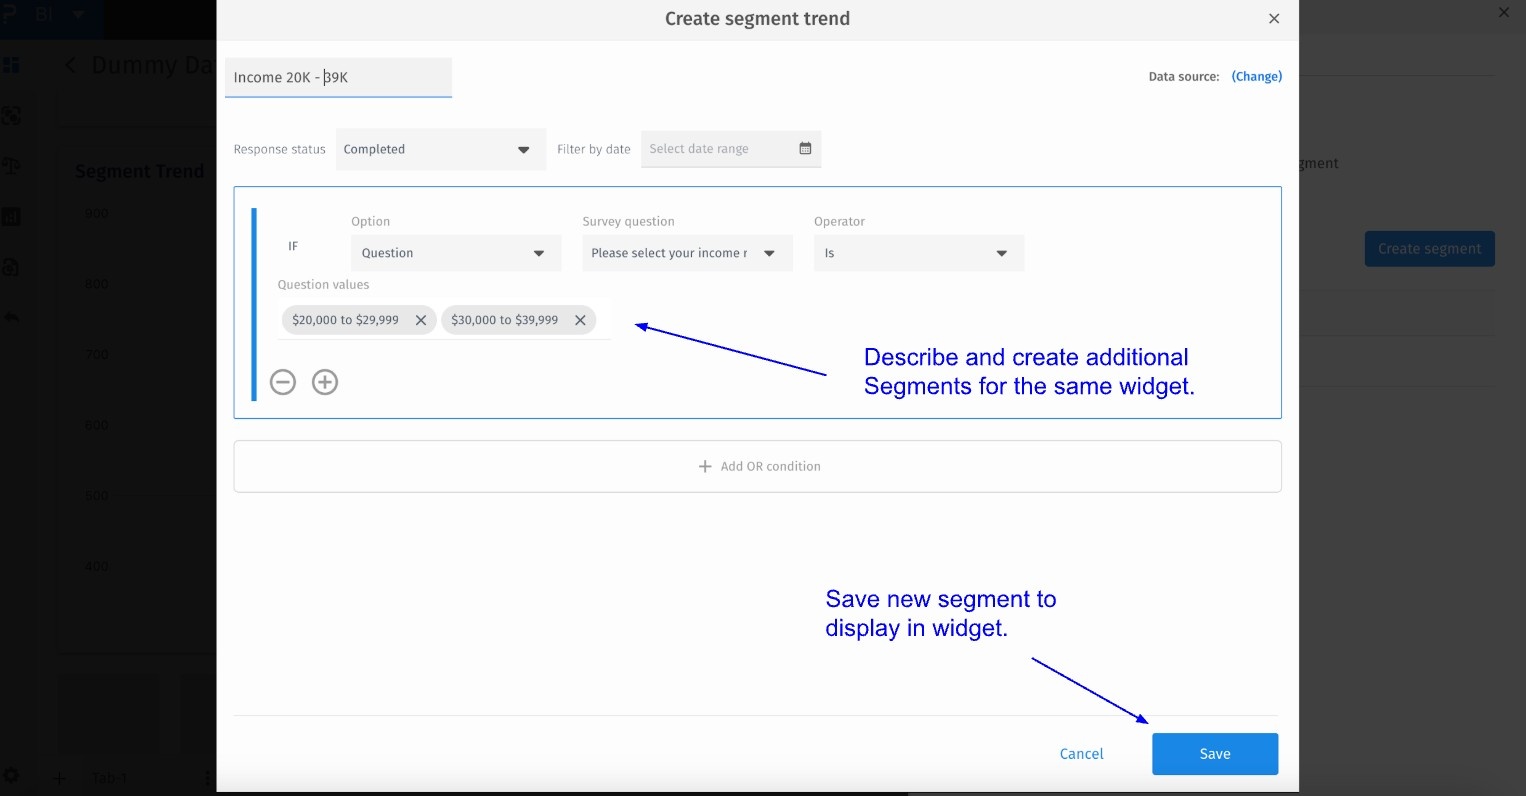
- Step 3: BI Segment Trend Widget > Settings > Segment > Create Segment > Save
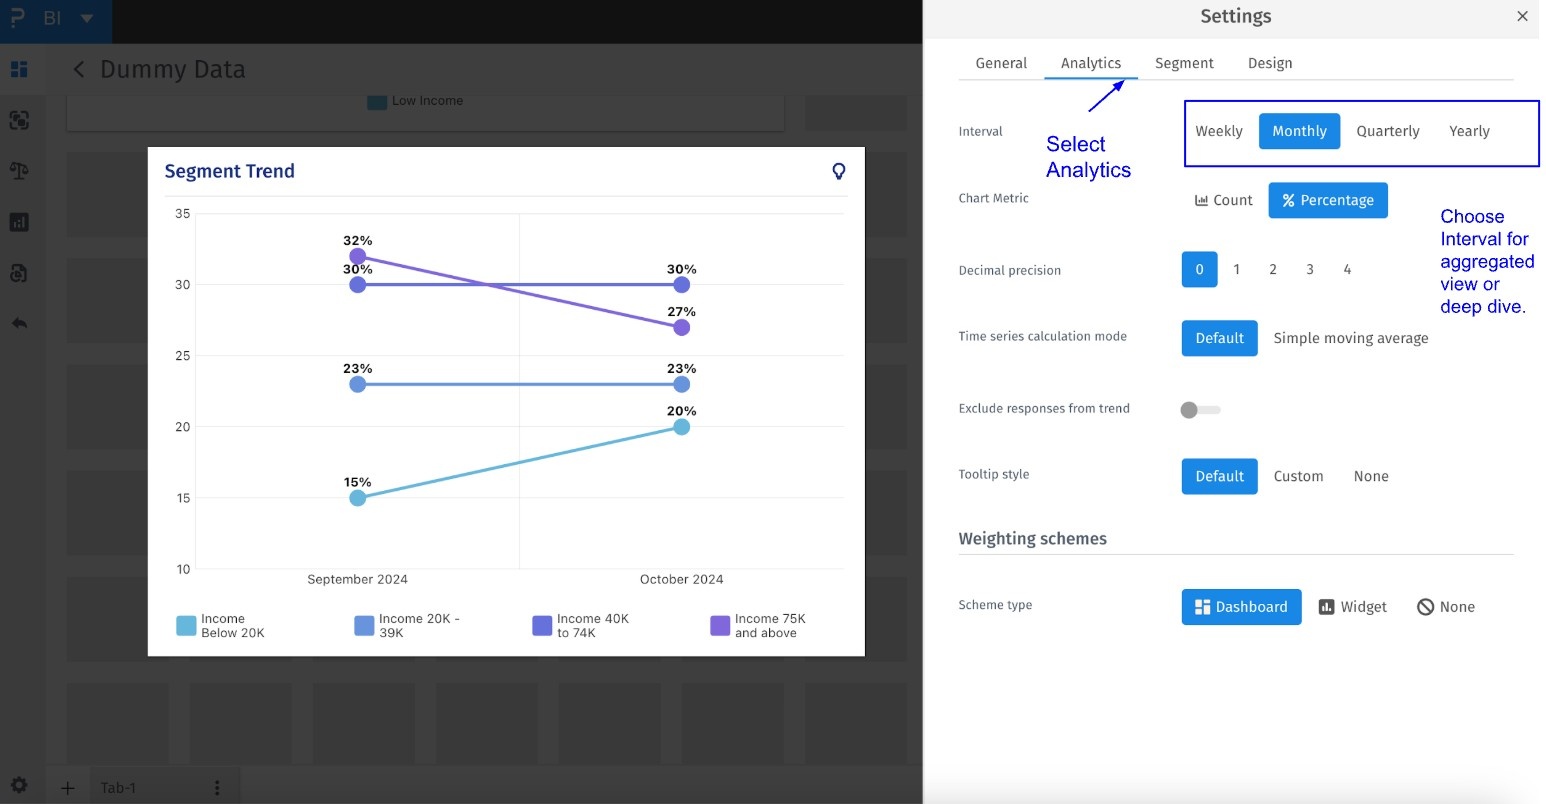
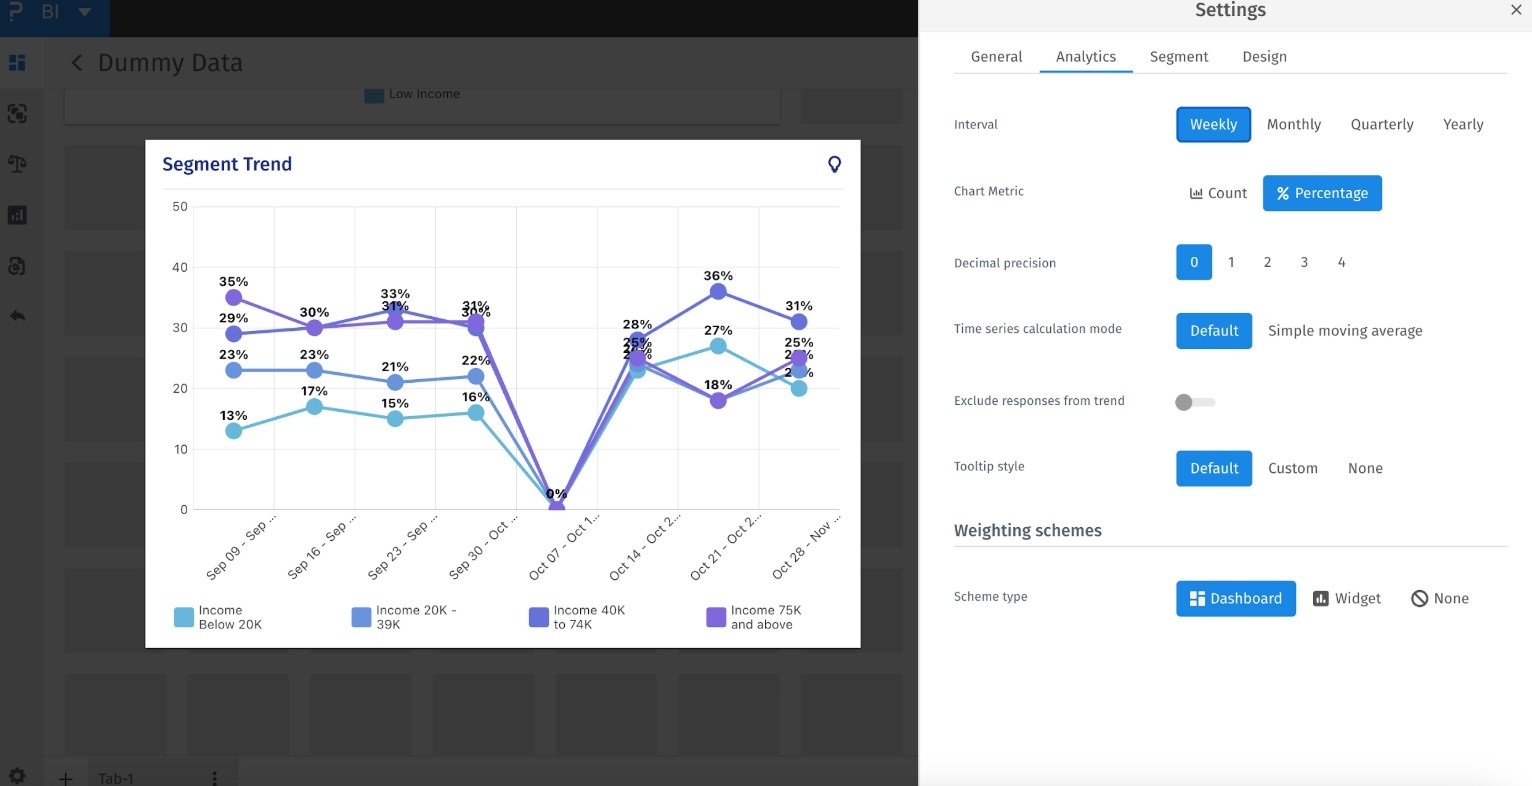
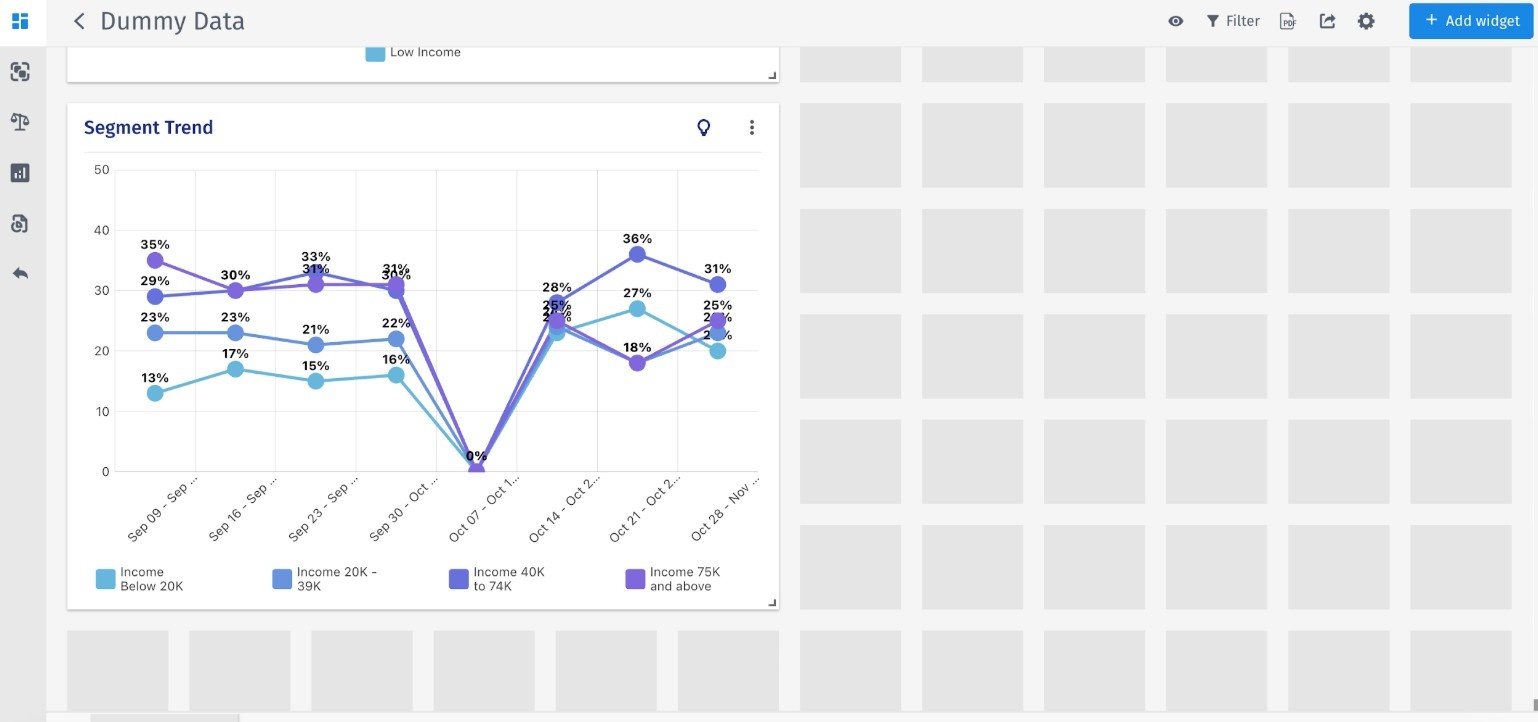
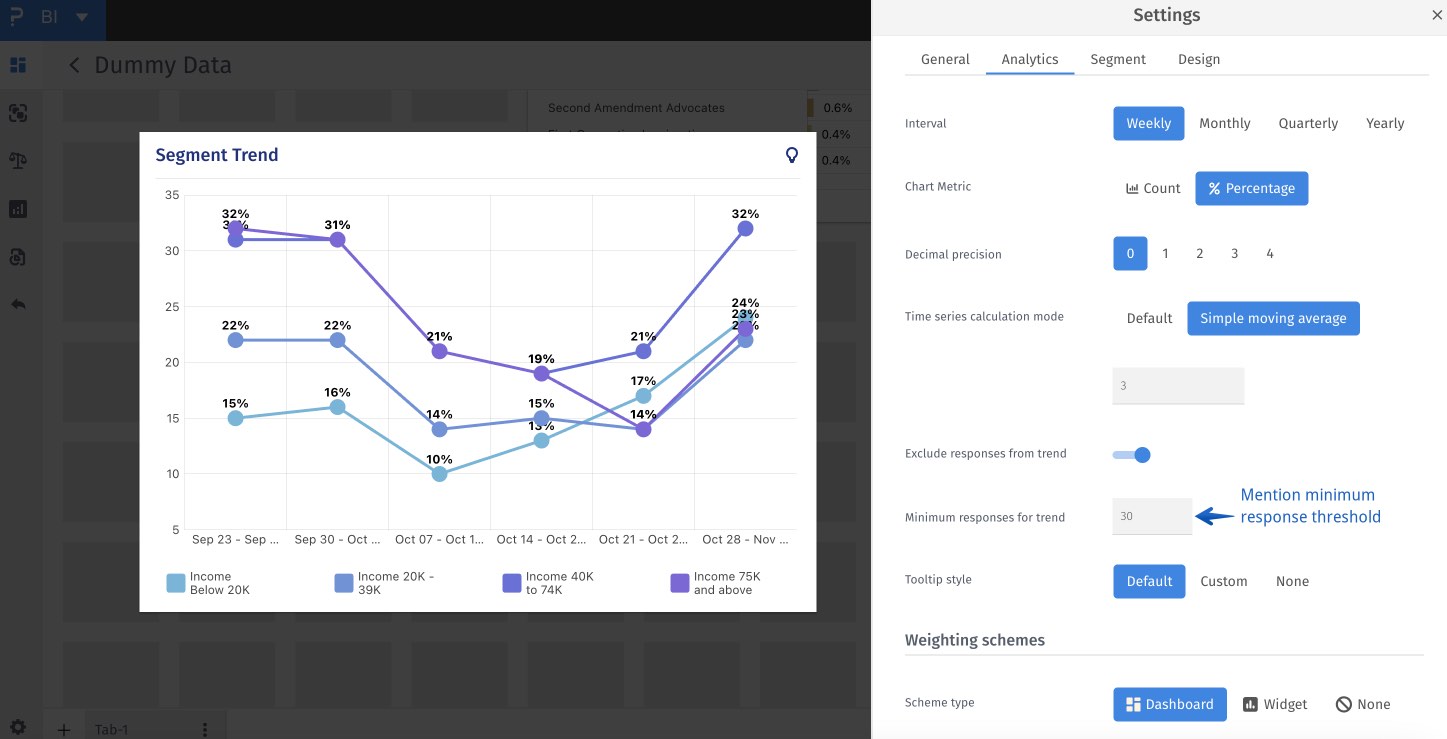
While analysing trends it becomes essential to zoom out to have an overall understanding of changing trends or zoom in to a specific time period to see if there is any correlation between an event and consumer behavior. The following capability is available in the Segment Trends → Analytics section where the user could either choose if they would zoom on to yearly / quarterly trends or zoom in to monthly and weekly trends.
- Step 1: BI Segment Trend Widget > Settings
- Step 2: BI Segment Trend Widget > Settings > Analytics > Weekly (Interval)
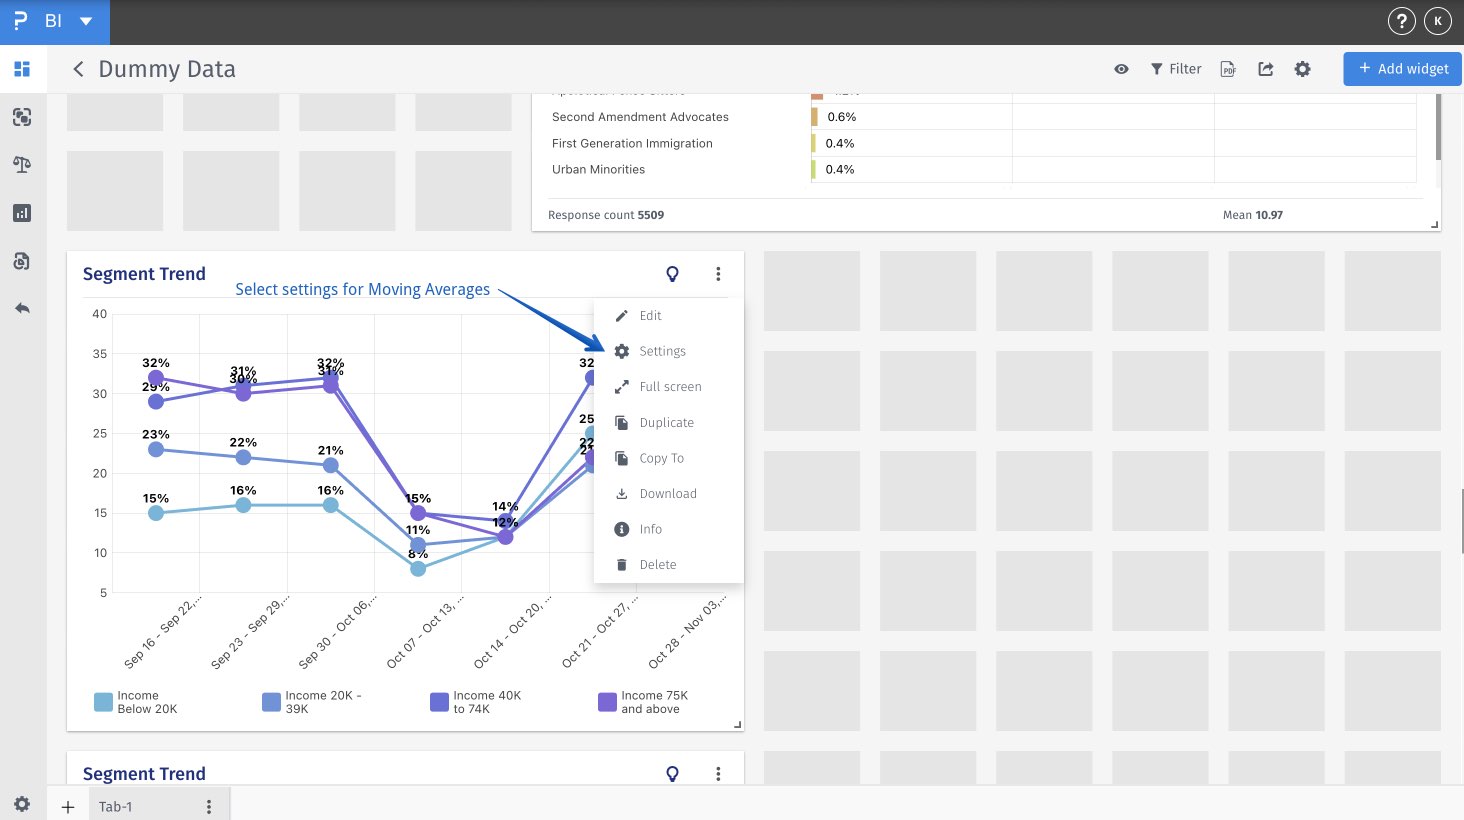
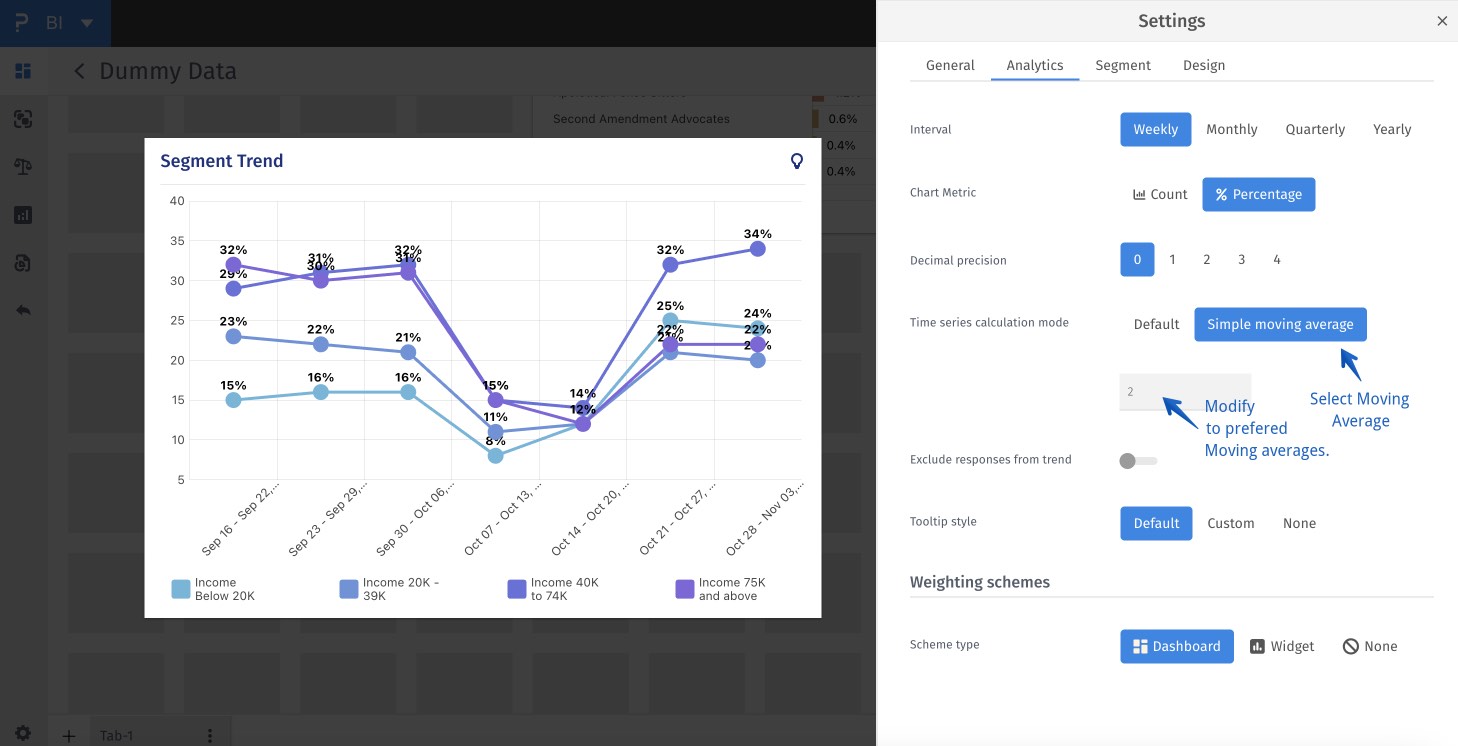
Moving averages are used to smooth time-series data by calculating a continuously updated average price, which helps to mitigate temporary fluctuations. Time-series data can sometimes show sharp increases or decreases in trends that aren't caused by a specific event or factor. In these cases, using moving averages can help to reduce these abnormal variations.
The system's default configuration includes the calculation of two moving averages i.e. the current period and the preceding two periods, within the time-series data. The duration for calculating the moving average is configurable to align with the specific parameters of the research.
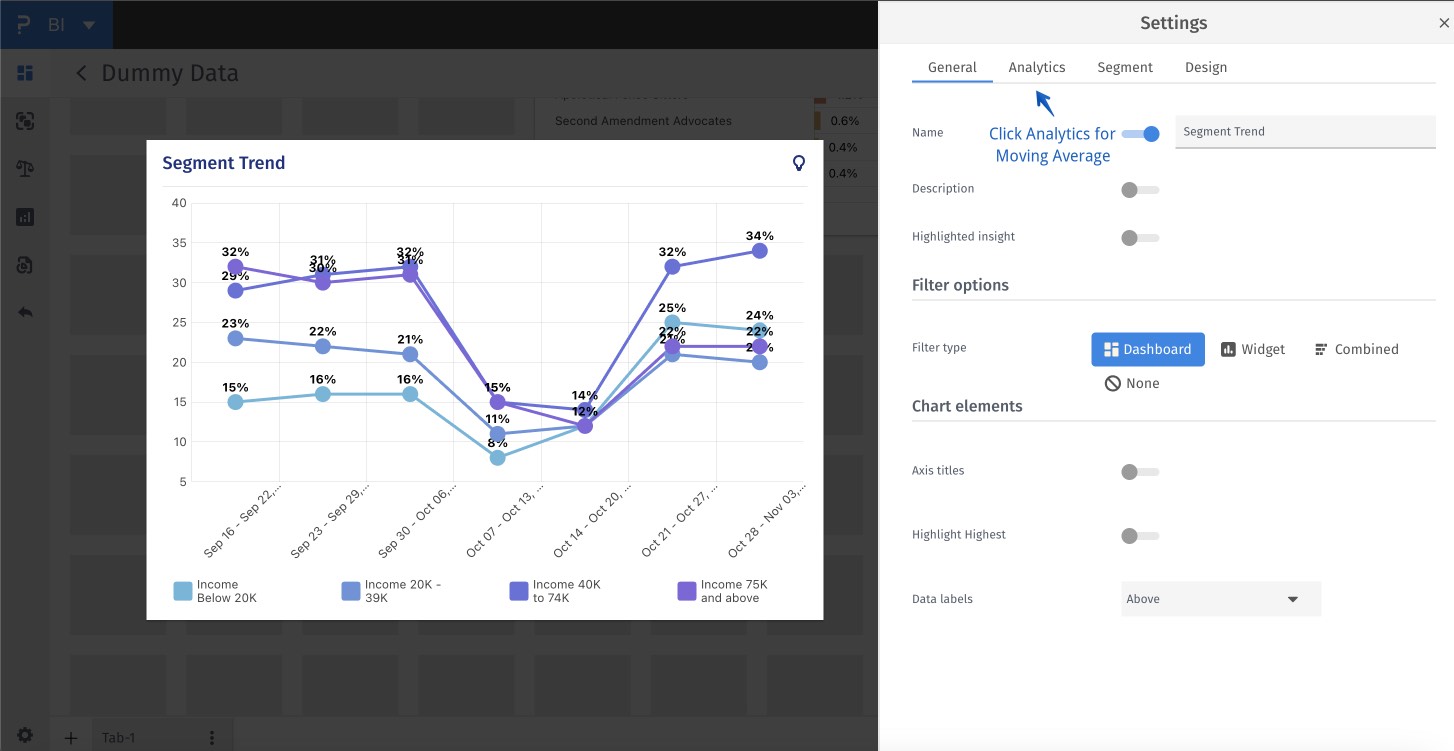
- Step 1: BI Segment Trend Widget > Settings
- Step 2: BI Segment Trend Widget > Settings > Analytics
- Step 3: BI Segment Trend Widget > Settings > Analytics > Moving Average
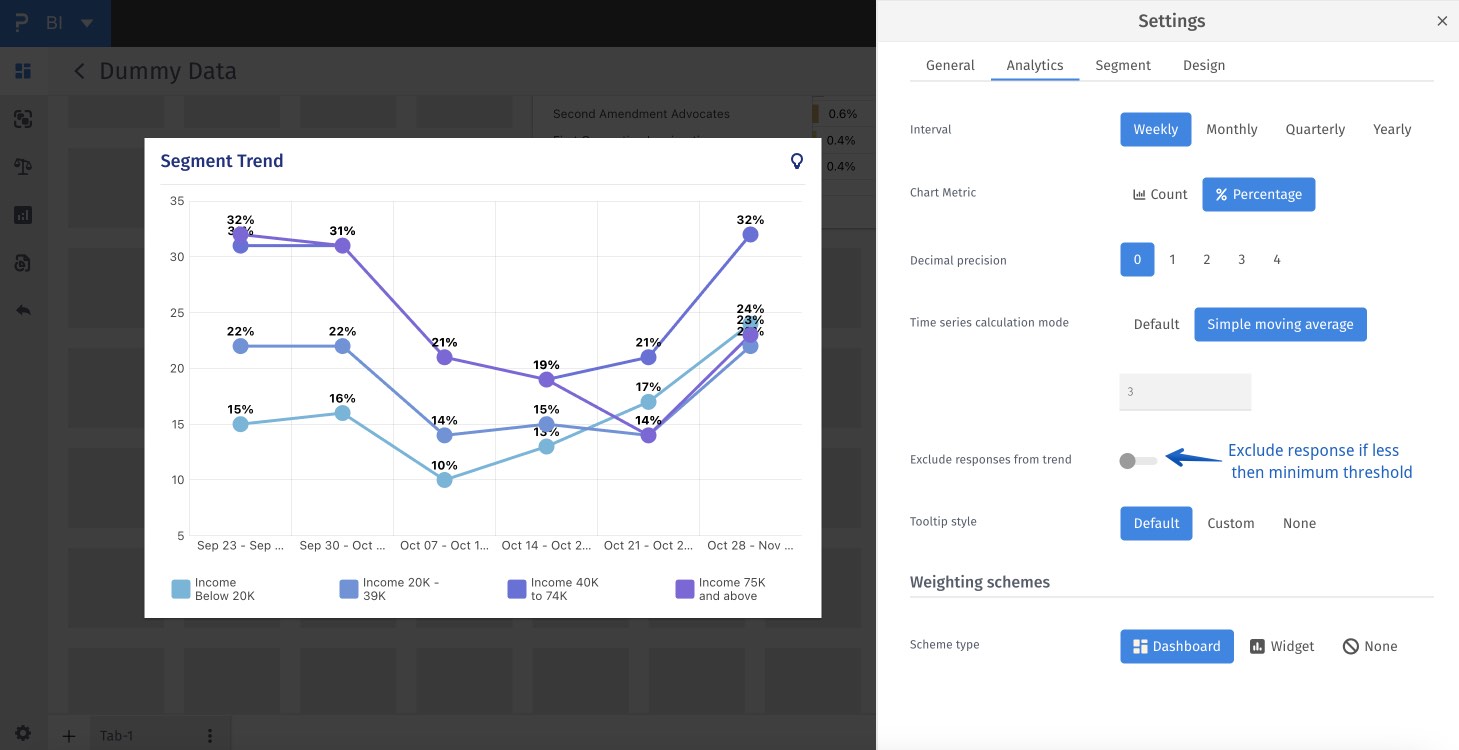
Certain time intervals might have low responses for no specific reason, potentially affecting moving average computations. If the objective is to maintain a minimum base per period and mitigate this impact, select the 'Exclude Responses from Trend' feature.
- BI Segment Trend Widget > Settings> Analytics > Exclude Responses from Trend
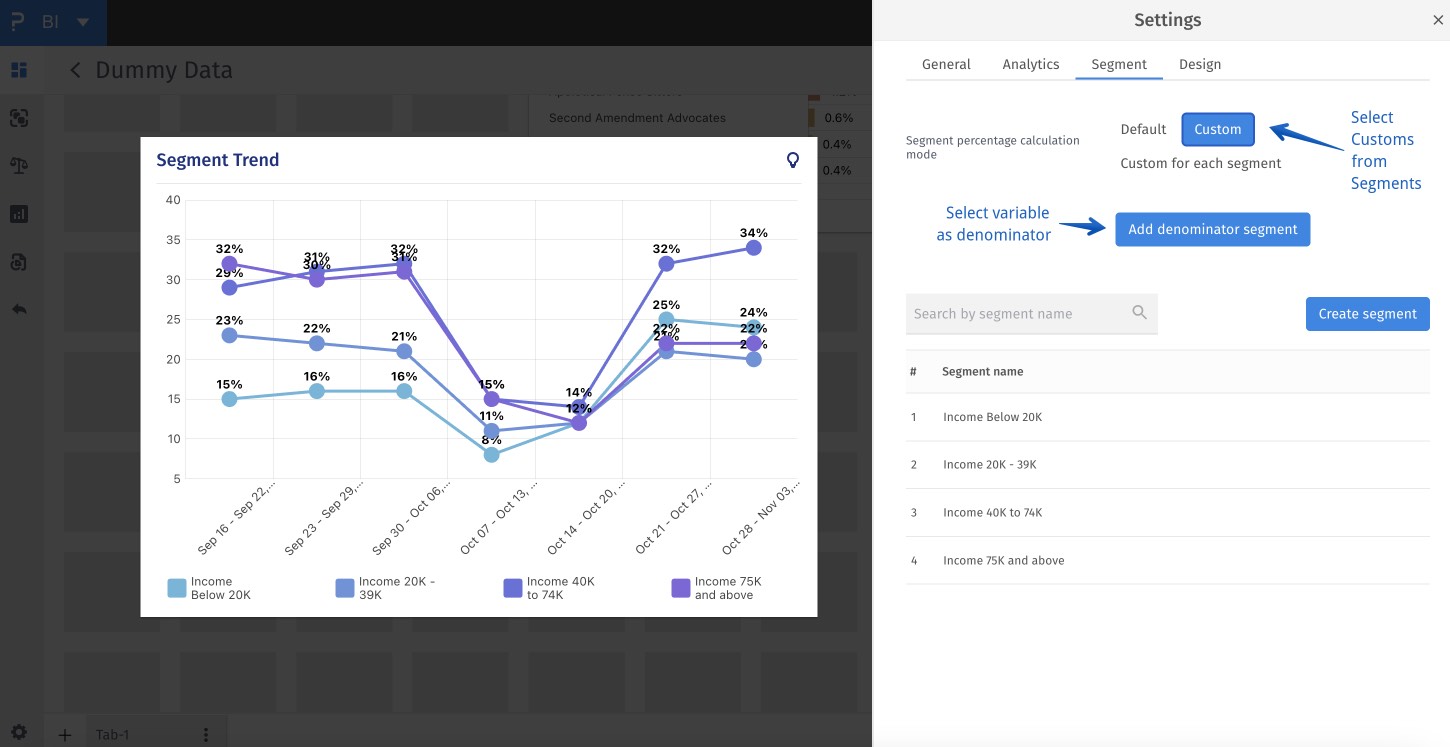
By default the system calculates proportions on the total number of completed responses. However with Custom Segment, we could further carve the segment by adding the denominator to any variable. The default calculation for proportions within the system is based on the total number of completed responses.
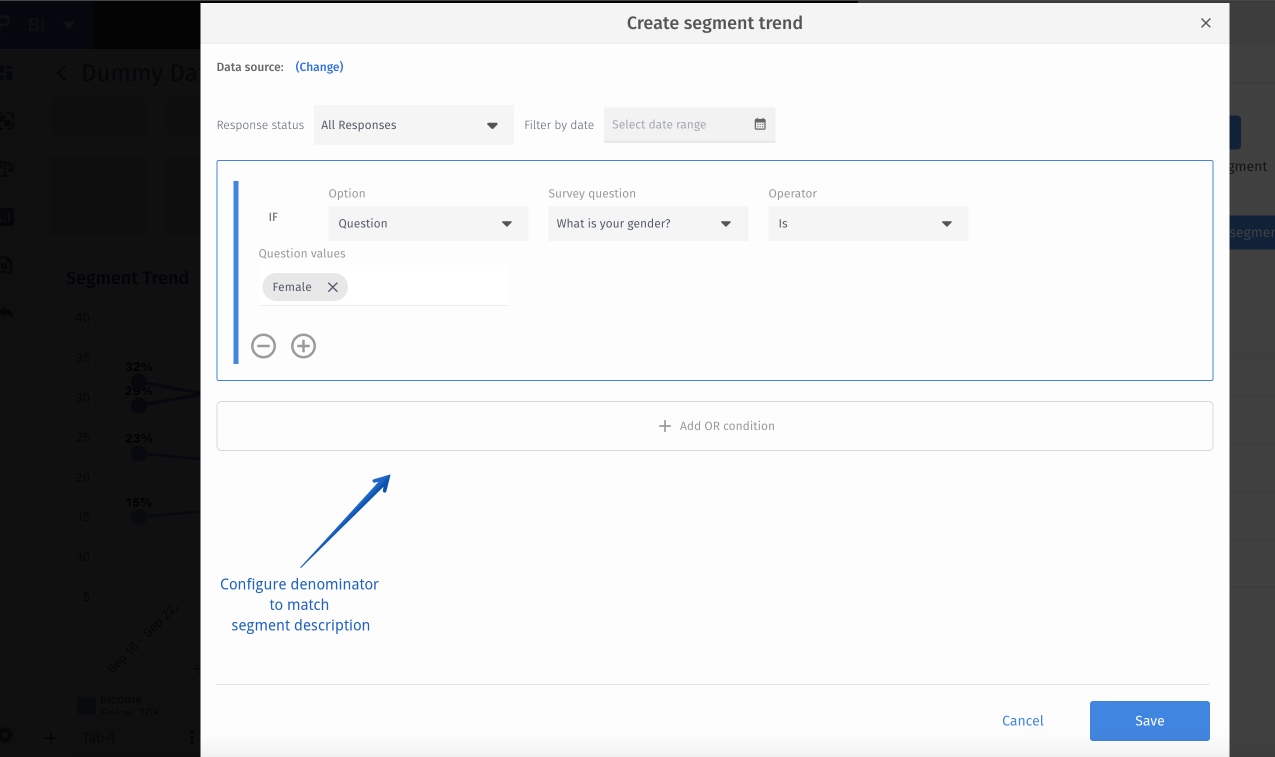
However, the Custom Segment feature offers more flexibility. With Custom Segment, you can create a more specific segment by defining a denominator based on any variable to all the segments shown in the widget. The following allows you to focus on specific groups within your data and gain more targeted insights.
- Step 1: BI Segment Trend Widget > Settings> Segment
- Step 2: BI Segment Trend Widget > Settings > Segment > Add denominator
- Step 3: BI Segment Trend Widget > Settings > Segment > Add denominator >
- Step 4: BI Segment Trend Widget > Settings > Segment > Add denominator > Save
- Interval: Measured along a numerical scale that has equal distances between adjacent values, mostly periodical scale in Segment Trends.
Can I use external BI variables in segment charts?
Yes. Segment Trend and Segment Bar support compatible external BI variables as well as survey questions. Choose the appropriate source and variable in the widget's selection workflow, then define the segments you want to compare. Availability depends on the selected source and variable type.
What is the difference between Segment Trend and Segment Bar?
Segment Trend compares segment results across time intervals, helping you see how a measure changes over time. Segment Bar compares segment results in a bar chart. Choose the visualization that matches whether time-based change or a segment comparison is the main question.
When should I use a custom segment?
Use a custom segment when you need a defined subset of responses or a specific denominator for a proportion. Review the segment criteria and base before comparing results, especially when different segments overlap or have different sample sizes.
How can I change the time interval shown in a trend?
Use the widget's trend settings to choose the available reporting interval, such as daily, weekly, monthly, or yearly. Read each point in the context of that interval and the active segments; changing the interval changes how the time-based results are grouped.
This feature is available with the following licenses :
Research Edition Communities Customer Experience Employee Experience University - Research Edition
