


Add advanced report to BI dashboard
The add report feature allows users to bring together multiple analytical reports, including BI widgets, Cross Tab reports, and Text AI reports — into a single, consolidated BI dashboard.
With this feature, users no longer need to switch between multiple report tabs or interfaces. Instead, they can centralize all key insights in one place, ensuring a seamless and holistic view of their data.
Centralized Insight Hub – Combine data visualizations, cross tab analyses, and text AI summaries into one comprehensive dashboard.
Improved Efficiency – Save time by viewing and comparing multiple report types without navigating across tabs.
Customizable Dashboards – Users can choose which reports to add as widgets, tailoring dashboards to their unique analytical needs.
Collaborative Reporting – Share one unified BI report instead of multiple separate ones, making data storytelling simpler and more effective.
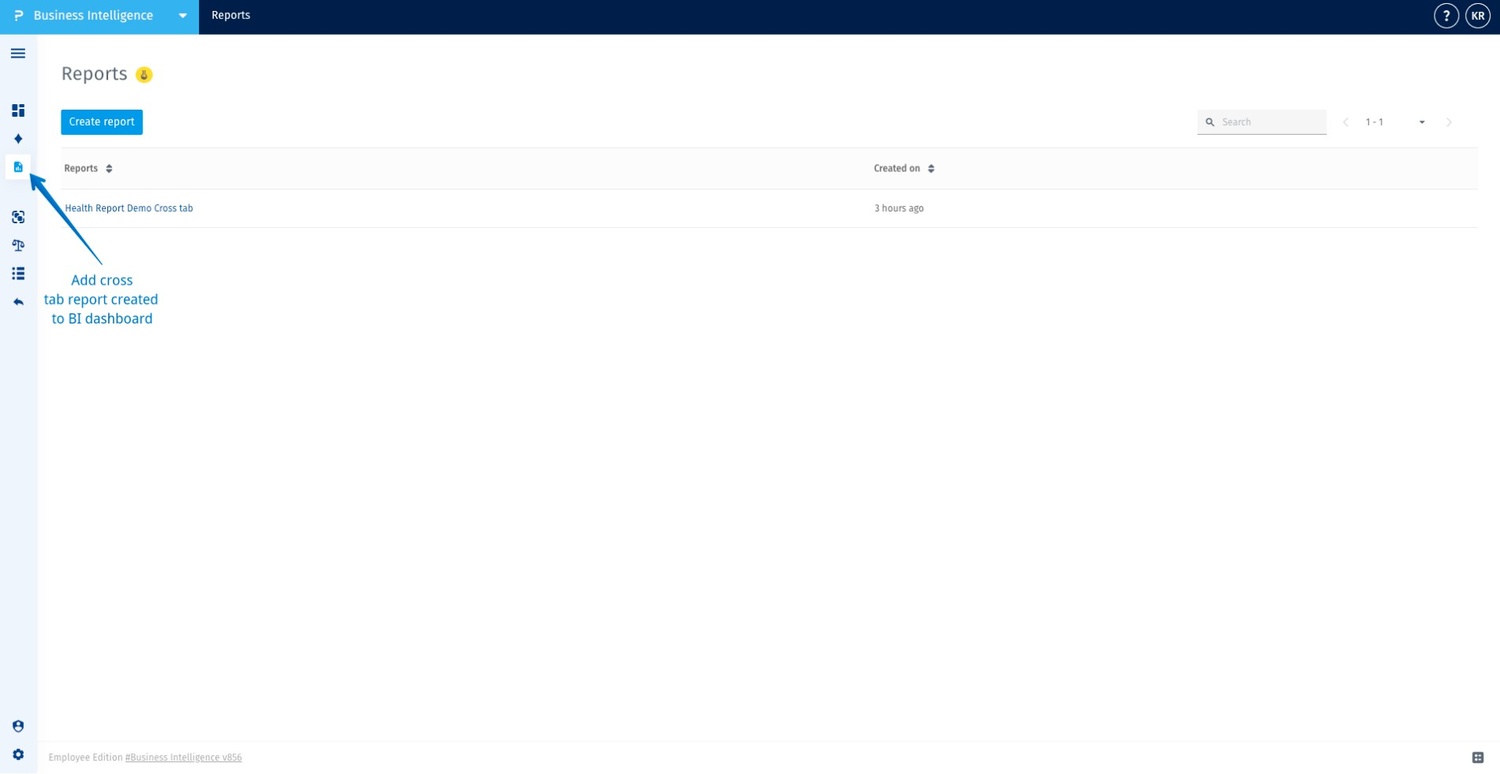
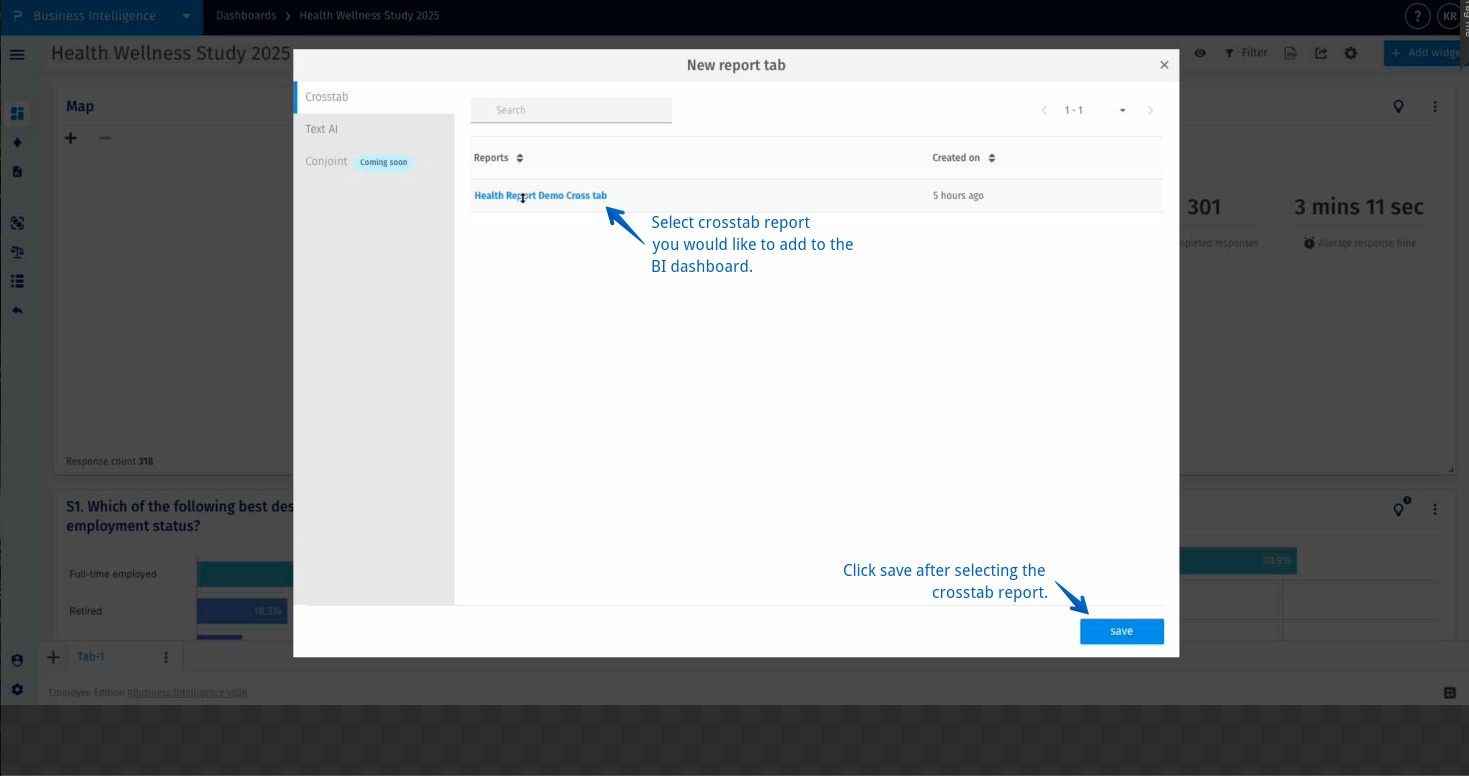
Step 1 Identify crosstab report: Navigate to the 'Reports' section. Here, you can view all existing reports created. Identify the crosstab report you’ve created to add it to your BI Dashboard.
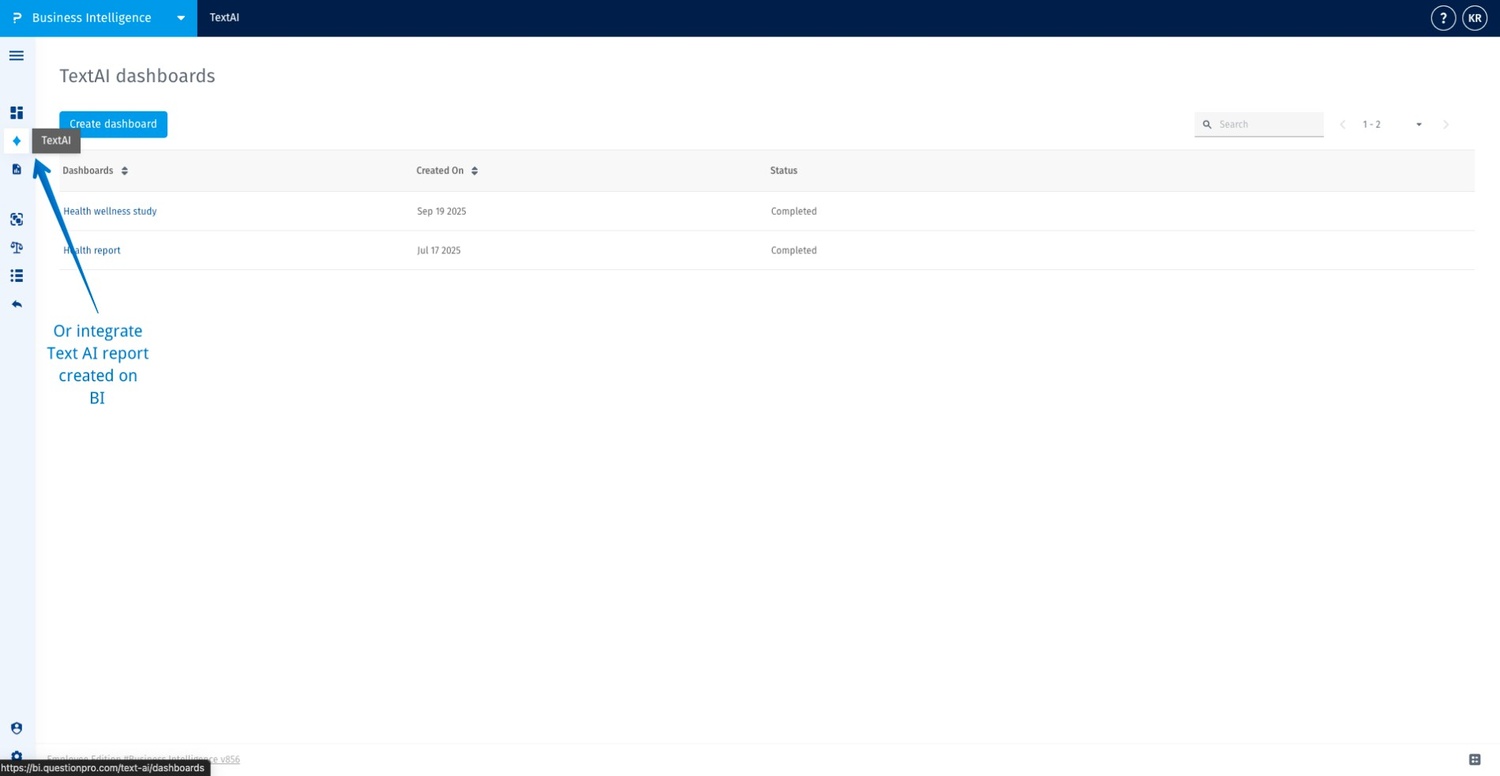
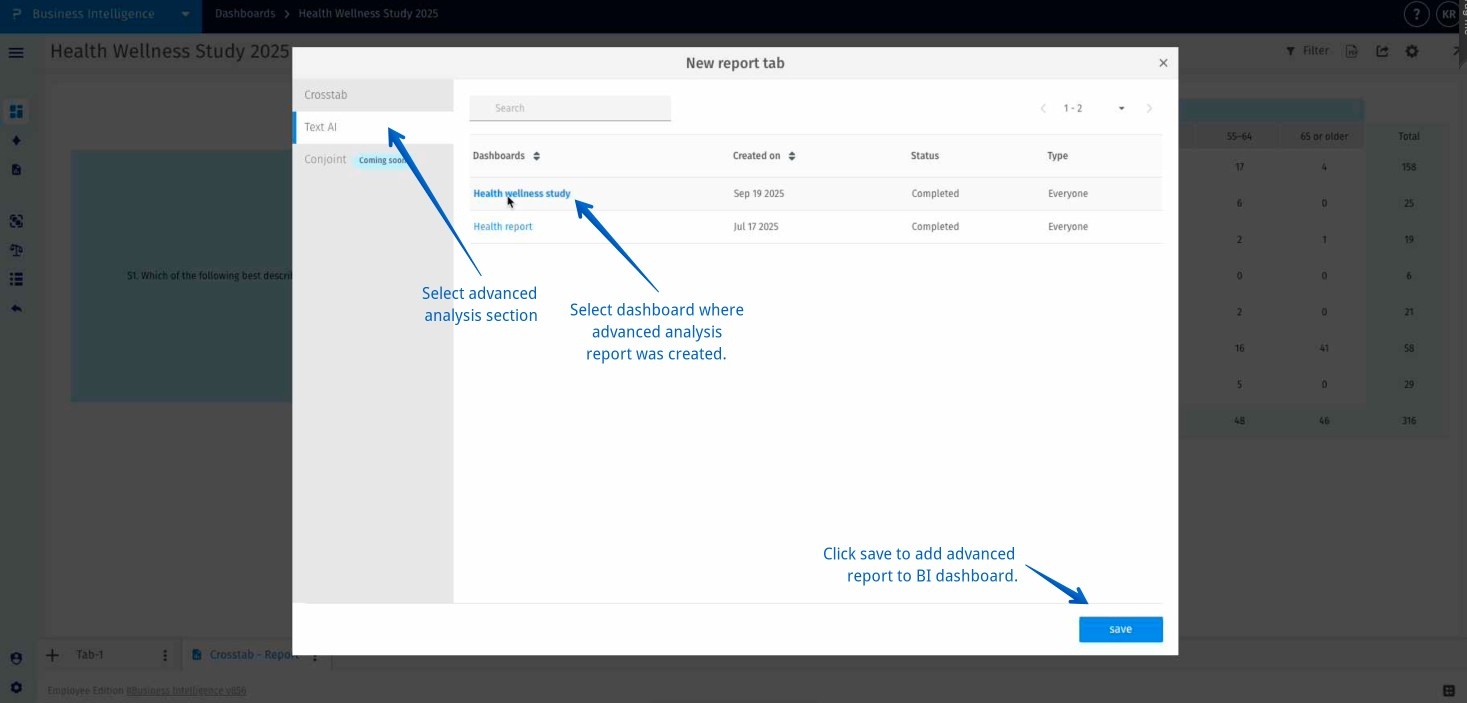
Step 2 Identify text AI report to add to BI report: Open the TextAI Dashboards section. Identify the Text AI report that you want to integrate with your main BI Dashboard for consolidated analysis.
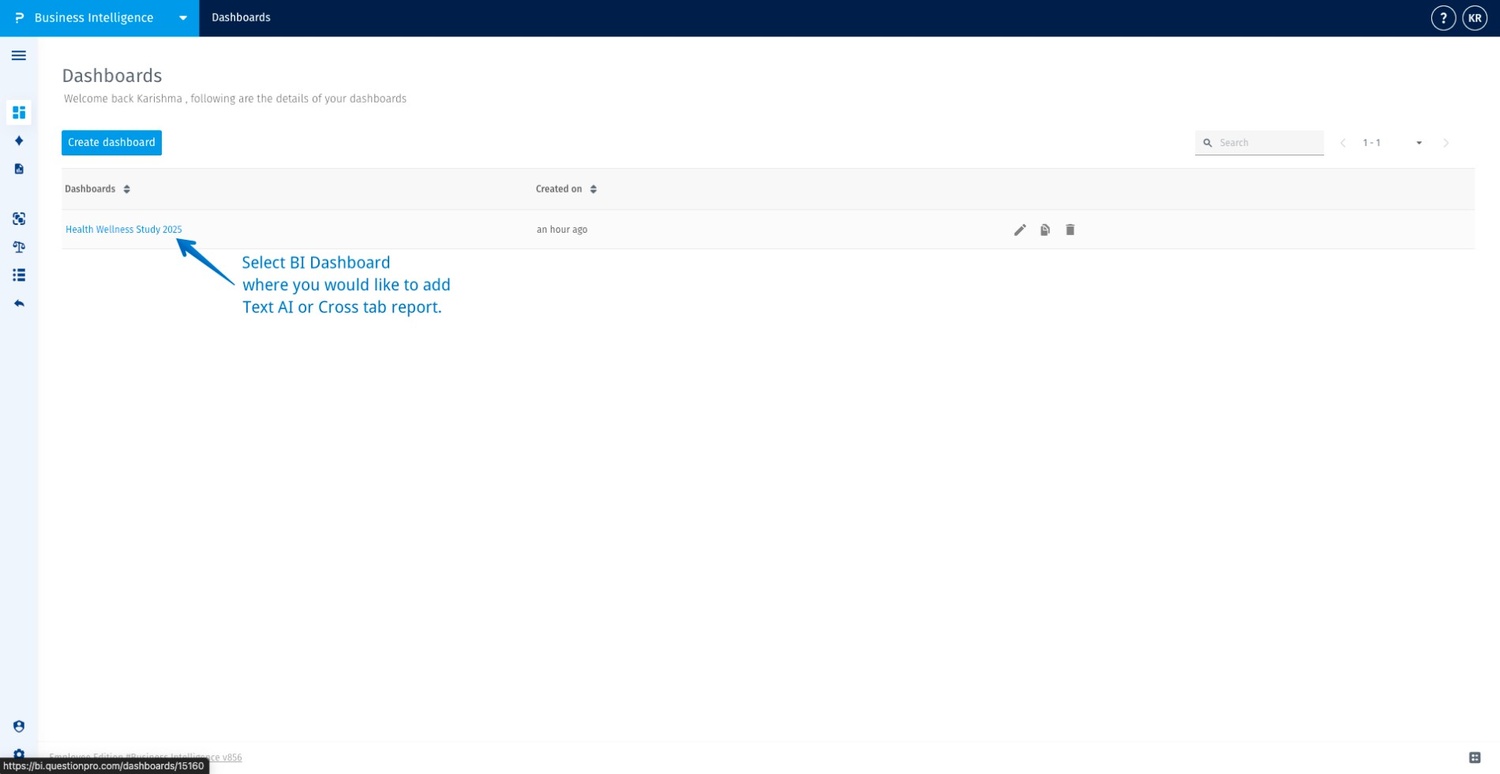
Step 3 Select BI dashboard: Identify the BI dashboard where you want to add your Crosstab or Text AI report. This determines where your consolidated report will appear.
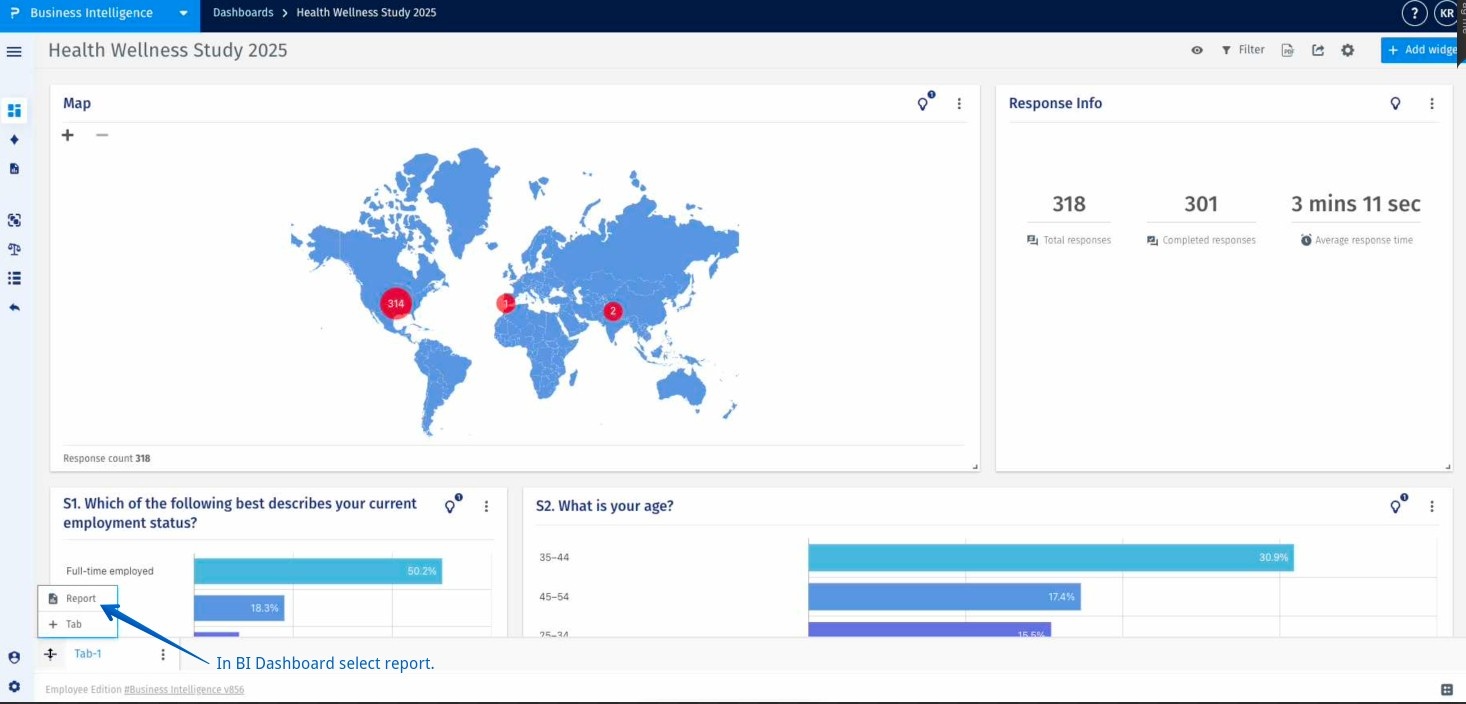
Step 4 Add report on BI dashboard: Once inside your BI Dashboard, click the “+” icon and select 'Report' to begin adding a crosstab or text AI report as a new tab or widget within the dashboard.
Step 5 Select crosstab to be added to the BI report: In the New Report Tab window, choose the Crosstab section, select the report you want to add, and click Save. This will integrate your selected Crosstab report into the BI dashboard.
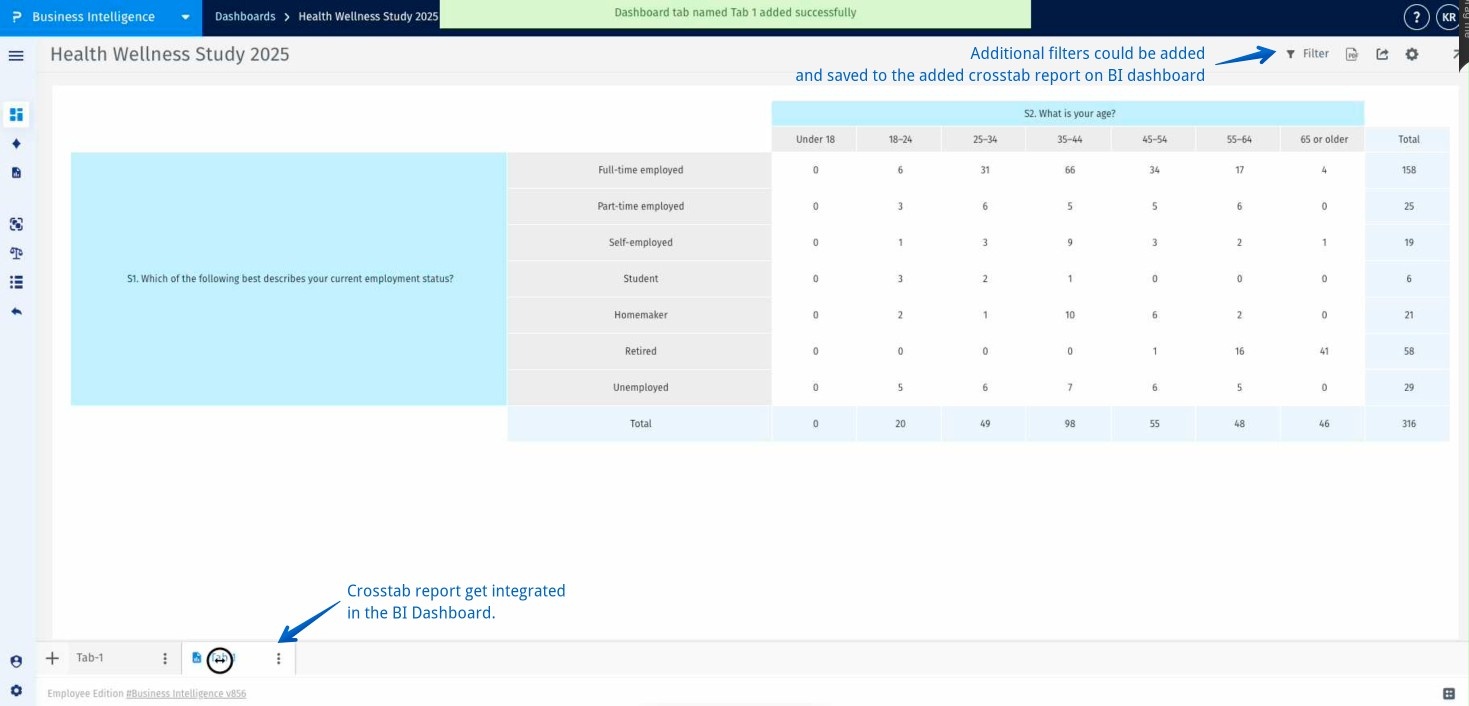
Step 6 Crosstab report added to BI dashboard: Your selected crosstab report is now successfully added to the BI dashboard. You can apply additional filters or modify settings as needed to refine the displayed data.
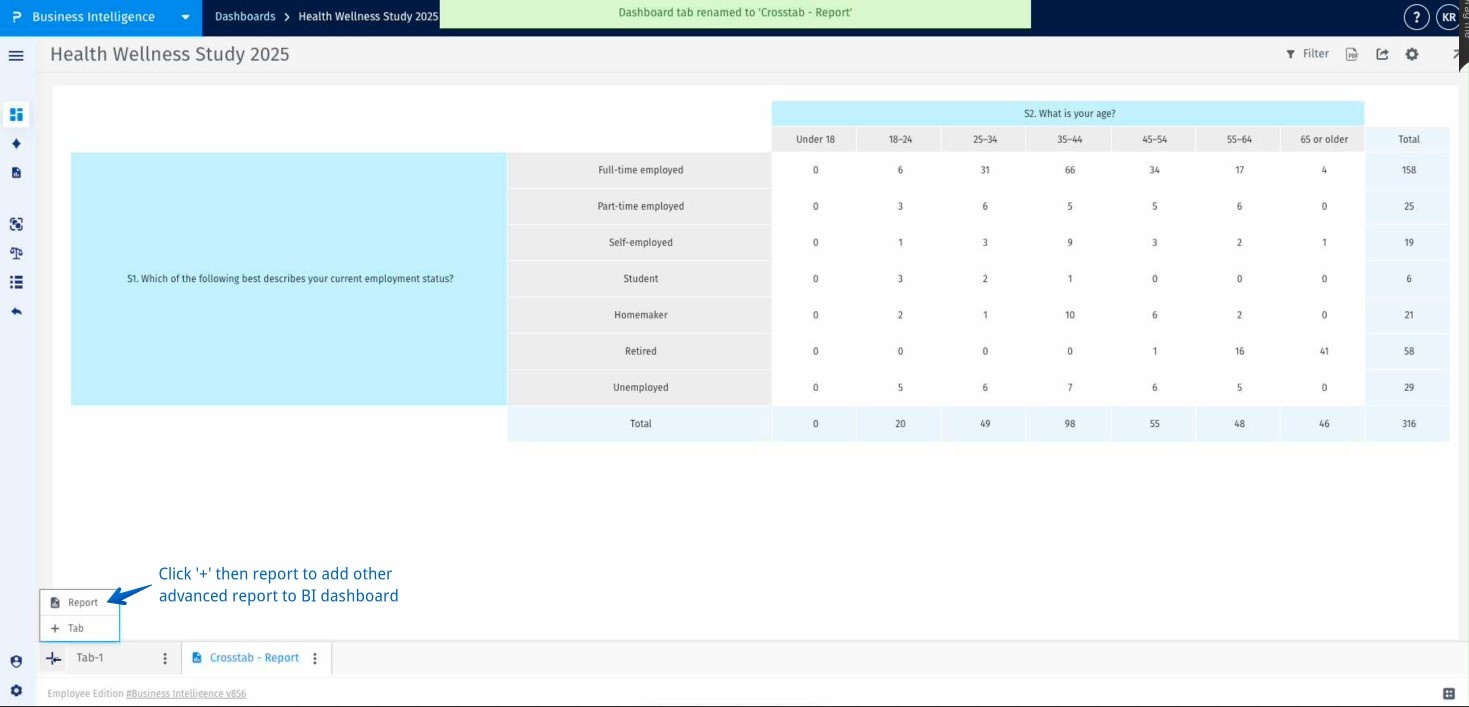
Step 7 Click report to add more advanced reports: To add more analytics, click the “+” icon again and choose Report. This allows you to integrate additional advanced reports such as Text AI into your BI dashboard.
Step 8 Add text analytics to BI dashboard: In the new report tab window, switch to the Text AI tab, select the dashboard where your Text AI analysis was created, and click Save to add it to your BI dashboard.
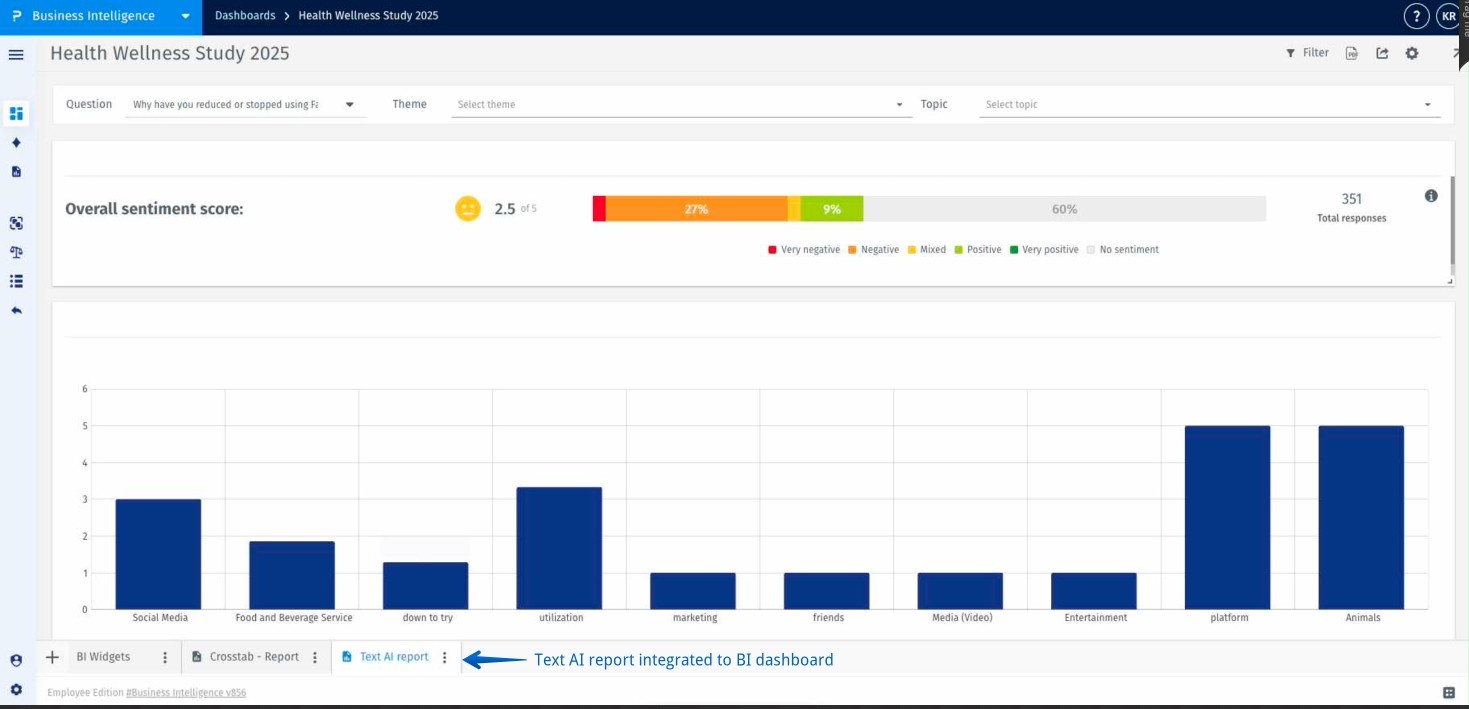
Step 9 Text AI report integrated to BI dashboard: The Text AI report is now integrated into your BI Dashboard alongside your crosstab report. Users can easily switch between tabs to view all insights—quantitative and qualitative—in one unified dashboard.
Below are definitions of key terms used in this help file:
BI Dashboard – A centralized workspace for visualizing multiple data sources and reports in one place.
Widget – A modular visual component (e.g., chart, table, text summary) added to the BI Dashboard for analysis.
Cross Tab Report – A report that displays data in a matrix format to analyze relationships between variables.
Text AI Report – A report powered by AI that analyzes open-ended responses or textual data for themes, sentiment, and insights.
Unified Dashboard Integration – The process of bringing multiple analytical report types together within one BI Dashboard.
Data Synchronization – Automatic updating of dashboard widgets when underlying report data is modified.