


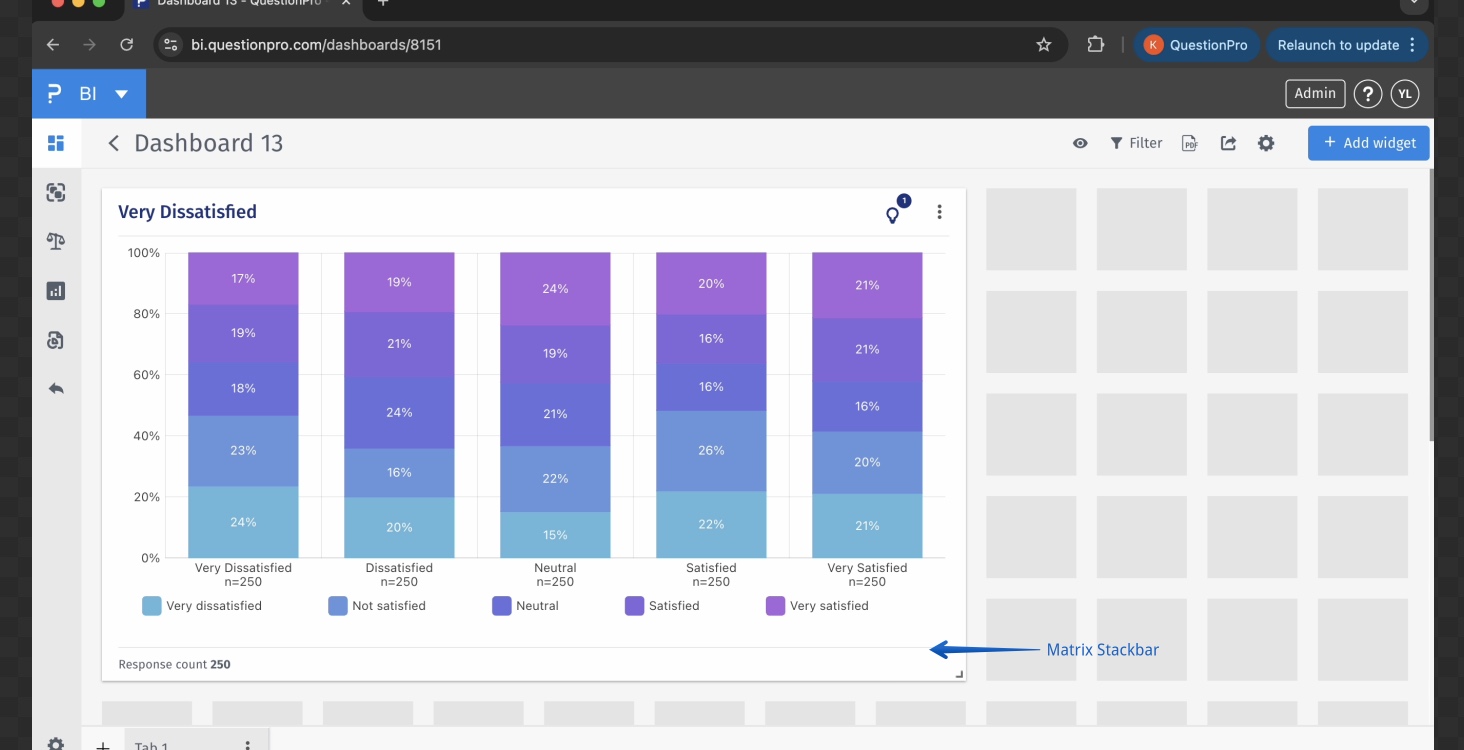
Matrix Stackbar
Matrix Stackbar is a powerful visualization feature within the BI dashboard that enables users to build horizontal or vertical stacked bar charts specifically for matrix-style survey questions. These questions typically involve multiple attributes or items being measured using the same response scale (e.g. Likert scale, awareness option, usage option, ownership option etc.).
The feature provides a clear and comparative view of how different attributes are rated by respondents, helping users identify trends, strengths, and improvement areas across multiple items in one visual.
Key Capabilities of the Matrix Stackbar Feature:
- Matrix-Based Visualization Matrix Stackbar works with questions where multiple attributes share the same response options. Each attribute appears as a separate bar, divided into segments that represent the distribution of responses across the common scale.
- Stacked Bar Layout (Horizontal or Vertical) Users can toggle between horizontal and vertical stacked bars depending on the desired layout for reporting or presentation. Each stack reflects how respondents distributed their answers for a particular attribute.
- Attribute Comparison The feature is ideal for comparing sentiments or ratings across several attributes—making it especially useful for brand perception, service evaluation, or product feature assessments.
- Consistent Scale Handling The chart automatically aligns and colors segments consistently across all bars, allowing quick interpretation of positive, neutral, or negative tendencies.
Common Tasks:
- Compare satisfaction levels across different service attributes in a customer experience survey.
- Visualize how various brands are perceived on the same set of traits (e.g., affordability, quality, innovation).
- Analyze employee feedback across different departments or processes using a common feedback matrix.
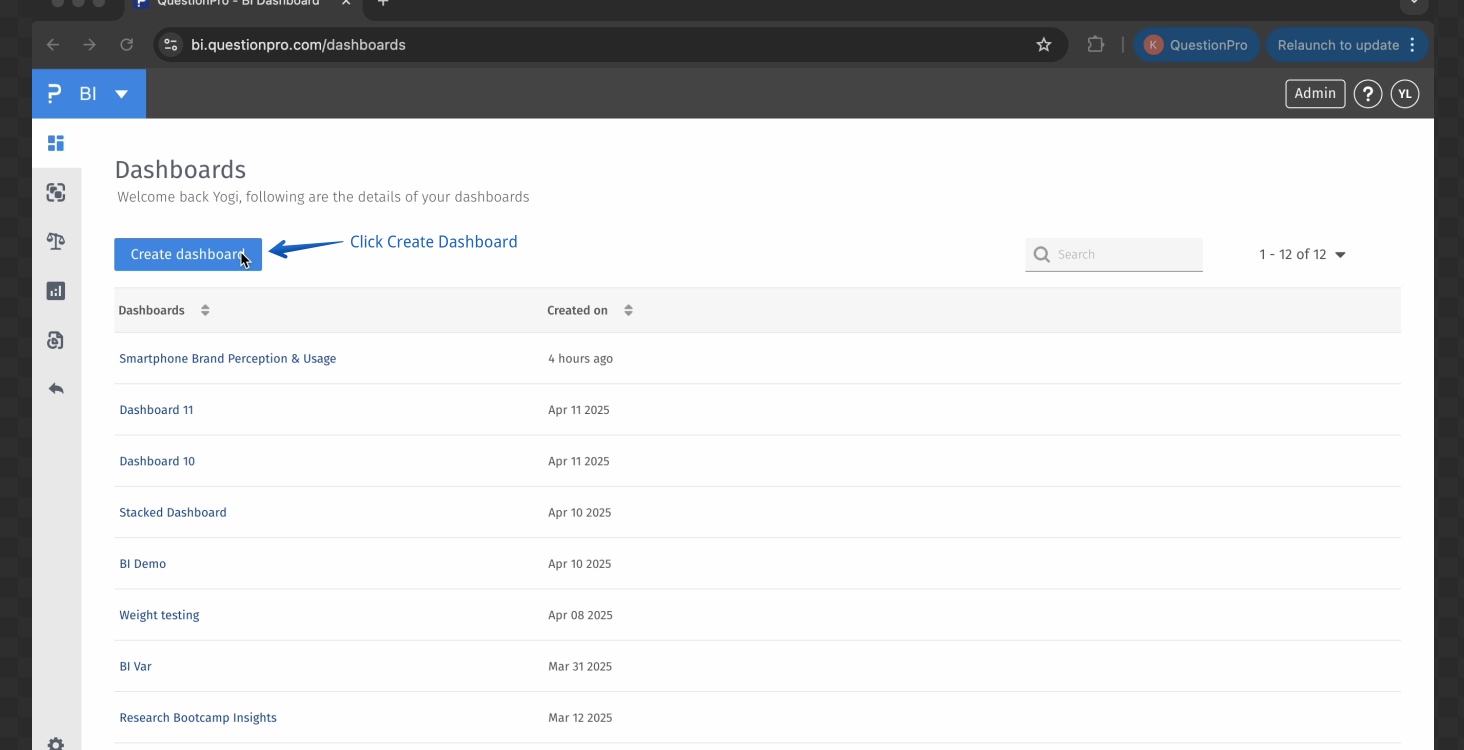
BI > Create Dashboard
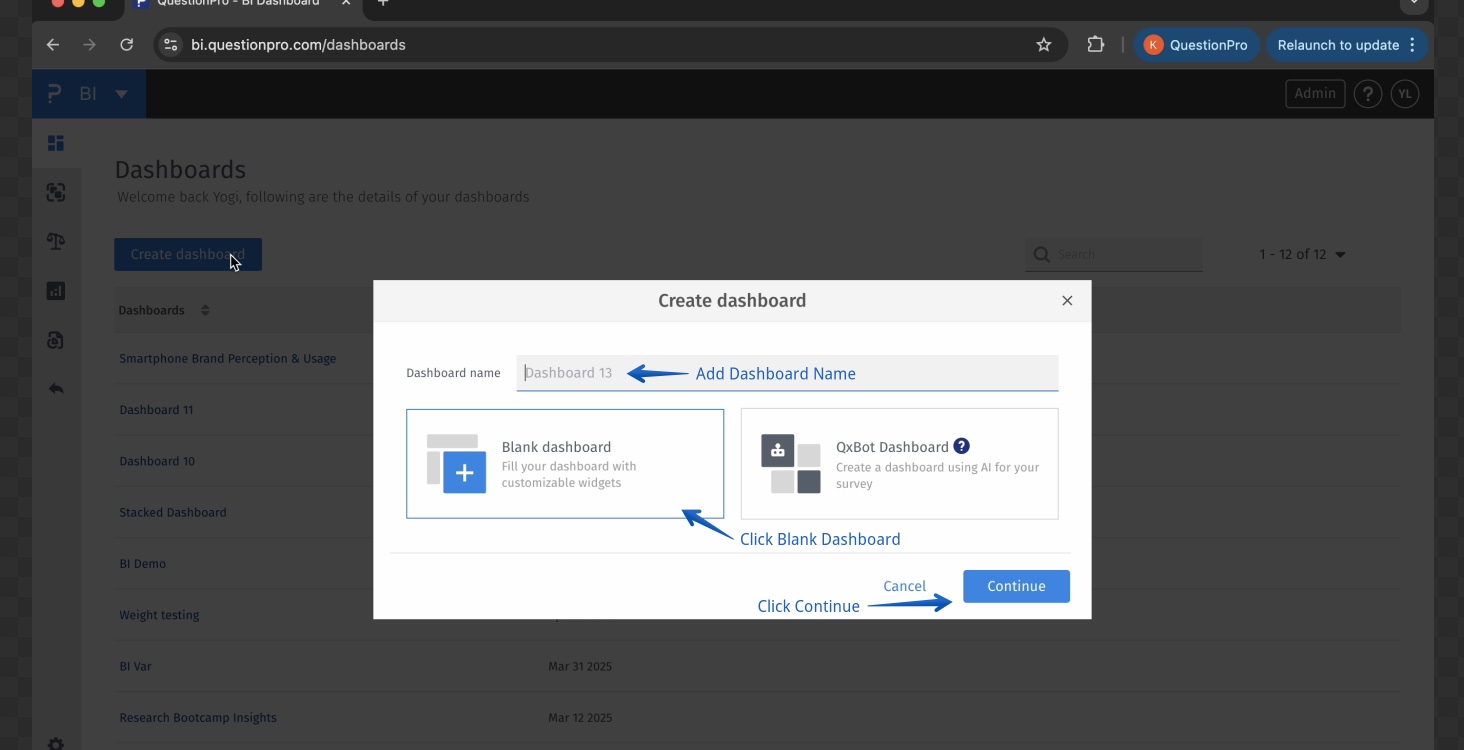
BI > Create Dashboard > Dashboard Name > Blank Dashboard > Continue
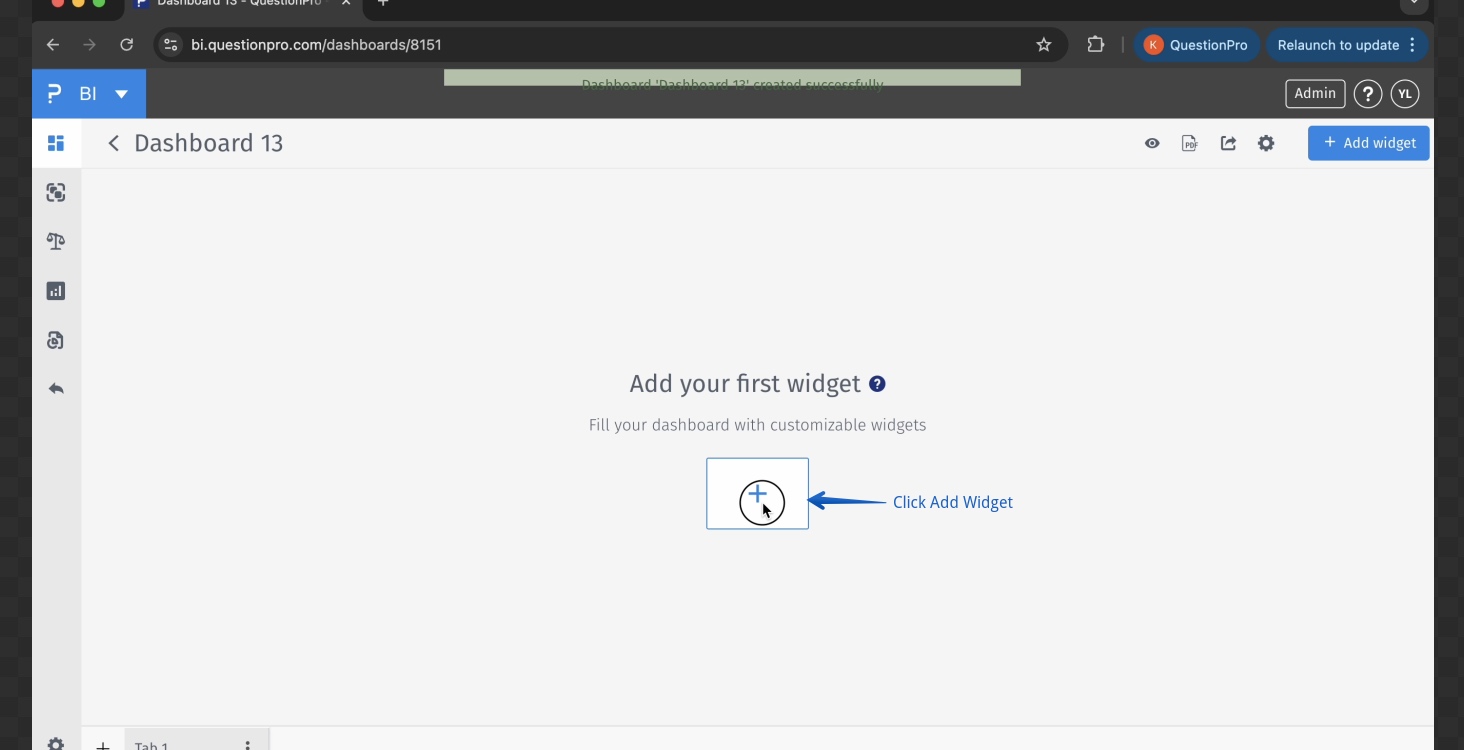
BI > Create Dashboard > Dashboard Name > Blank Dashboard > Continue > Add Widget
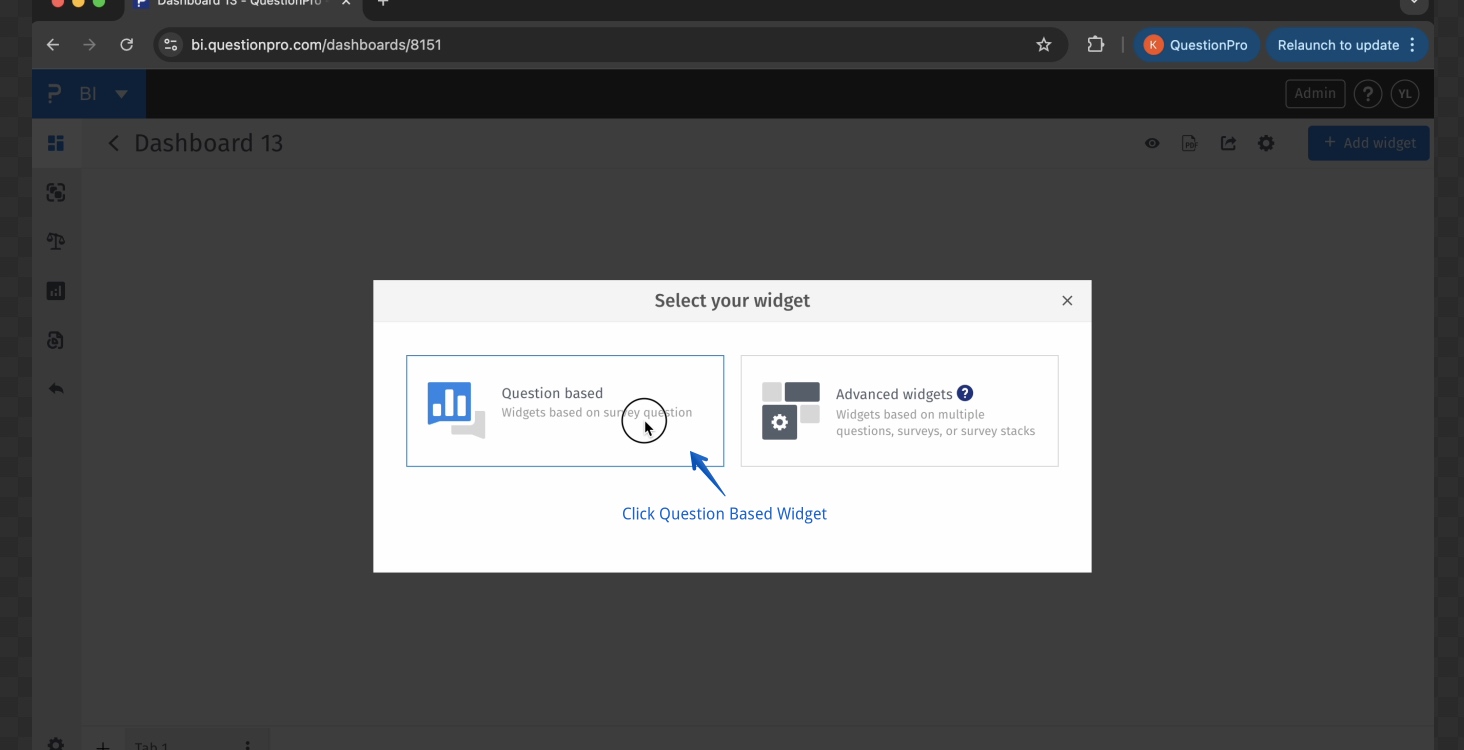
BI > Create Dashboard > Dashboard Name > Blank Dashboard > Continue > Add Widget > Question Based
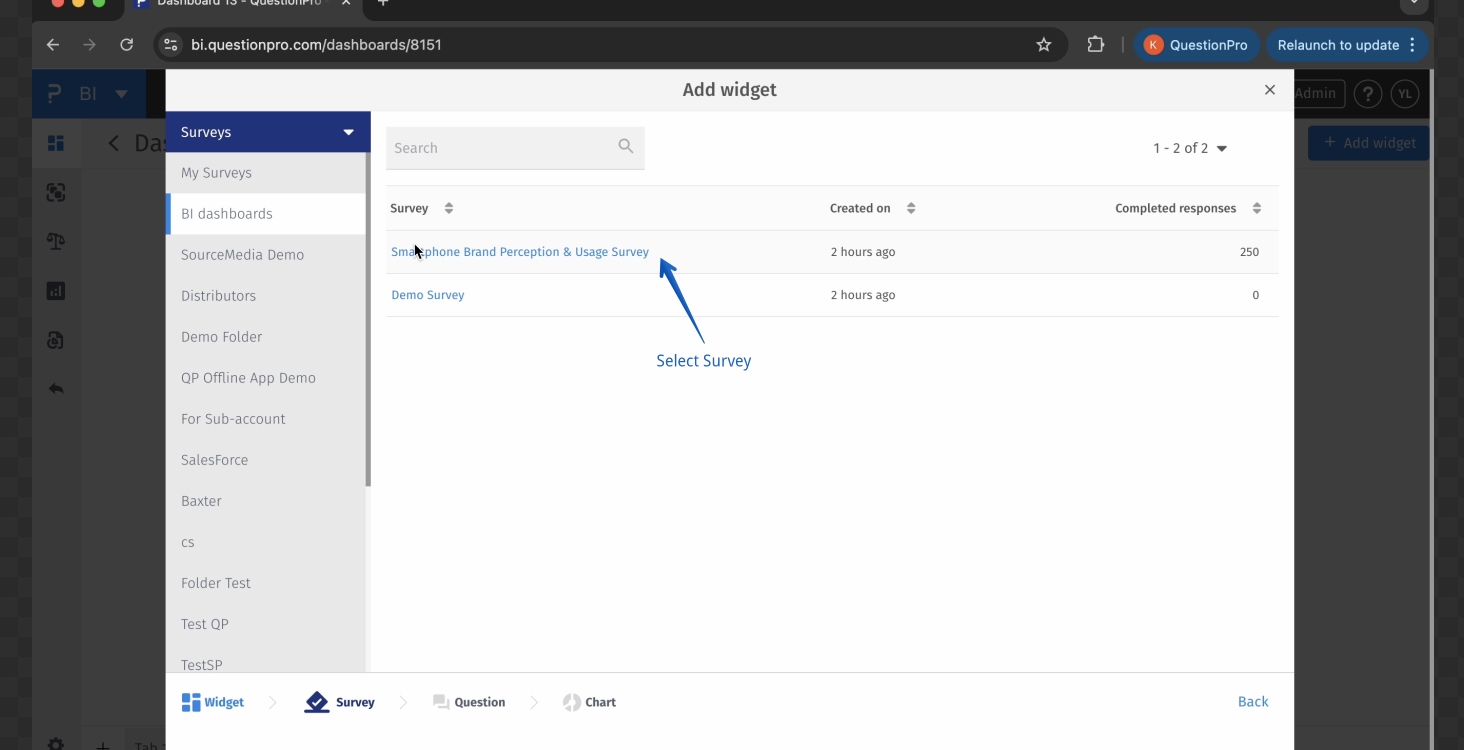
BI > Create Dashboard > Dashboard Name > Blank Dashboard > Continue > Add Widget > Question Based > Select Survey
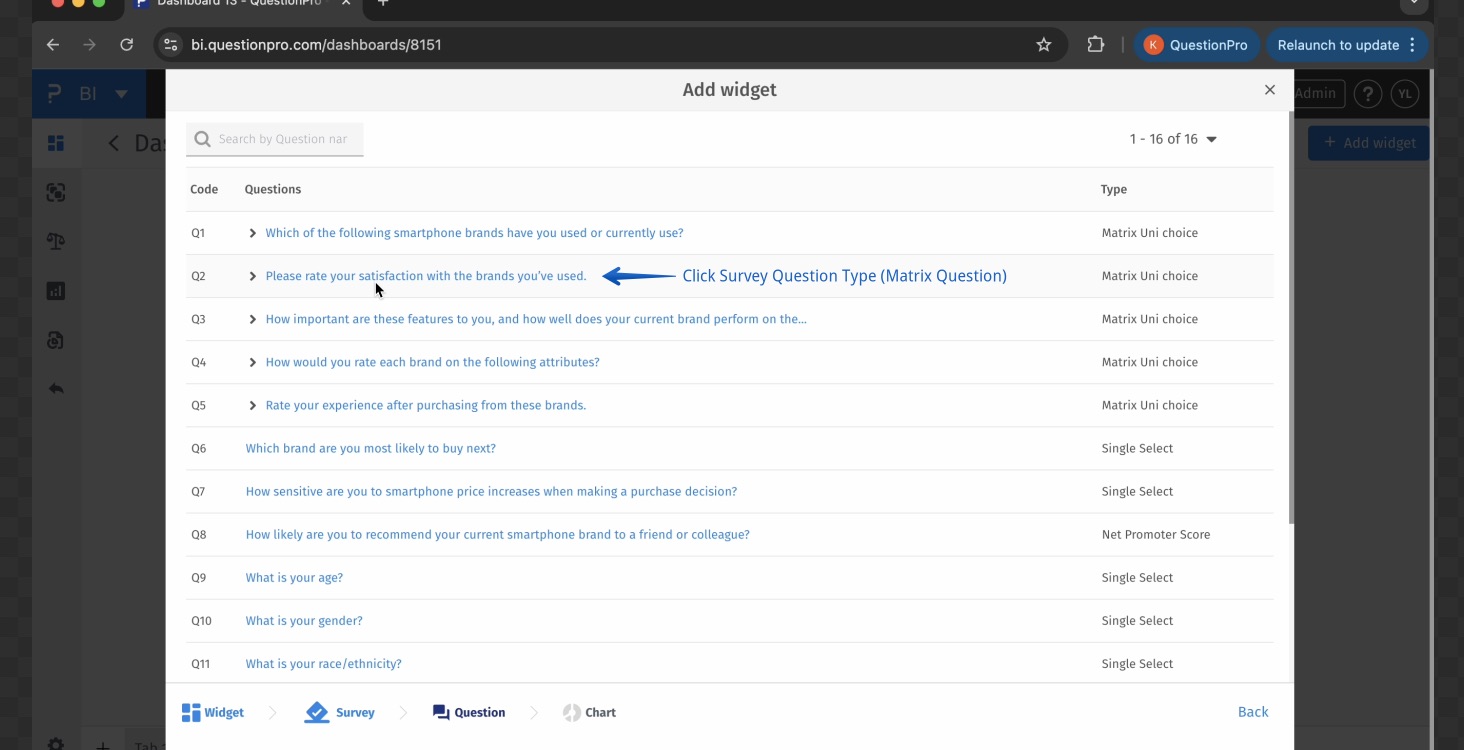
BI > Create Dashboard > Dashboard Name > Blank Dashboard > Continue > Add Widget > Question Based > Select Survey > Select Question (Type - Matrix)
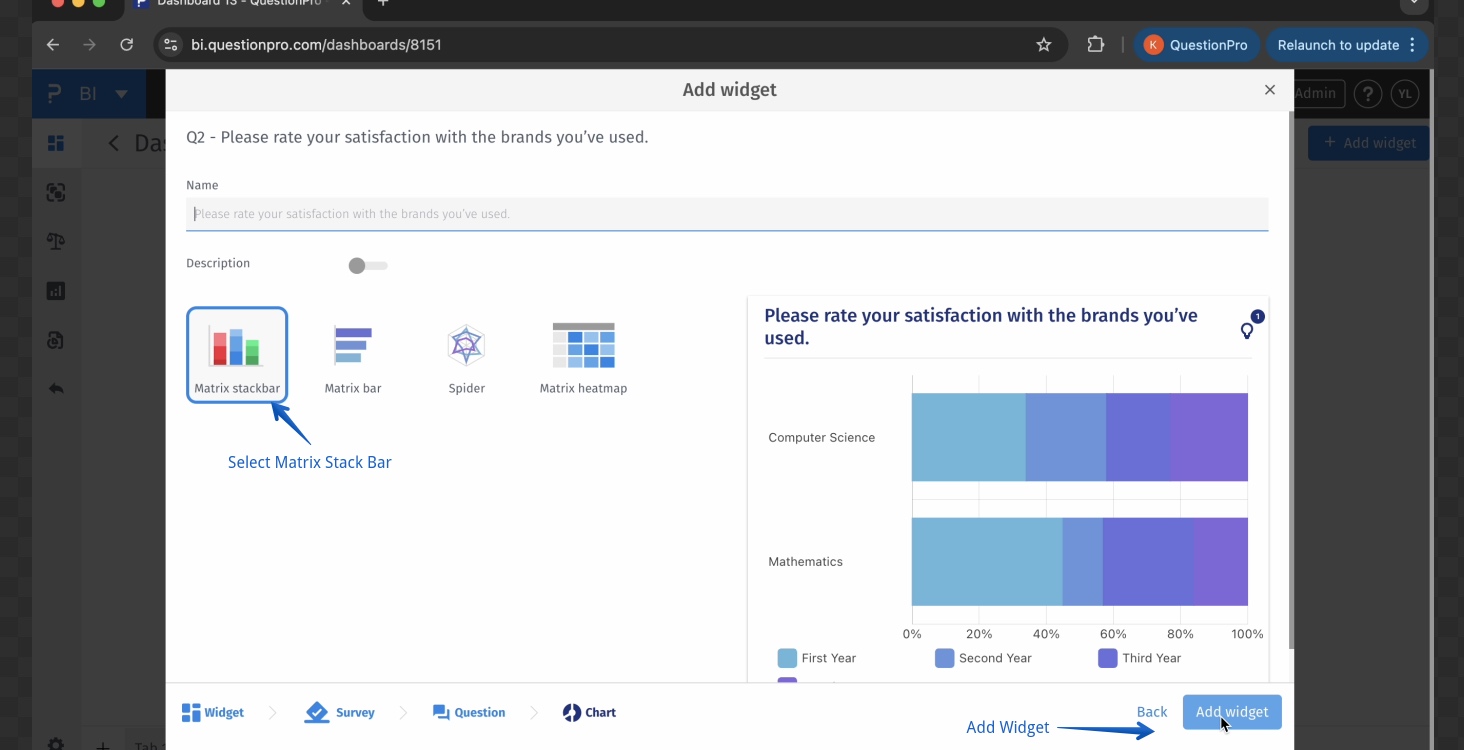
BI > Create Dashboard > Dashboard Name > Blank Dashboard > Continue > Add Widget > Question Based > Select Survey > Select Question (Type - Matrix) > Matrix Stackbar > Add Widget
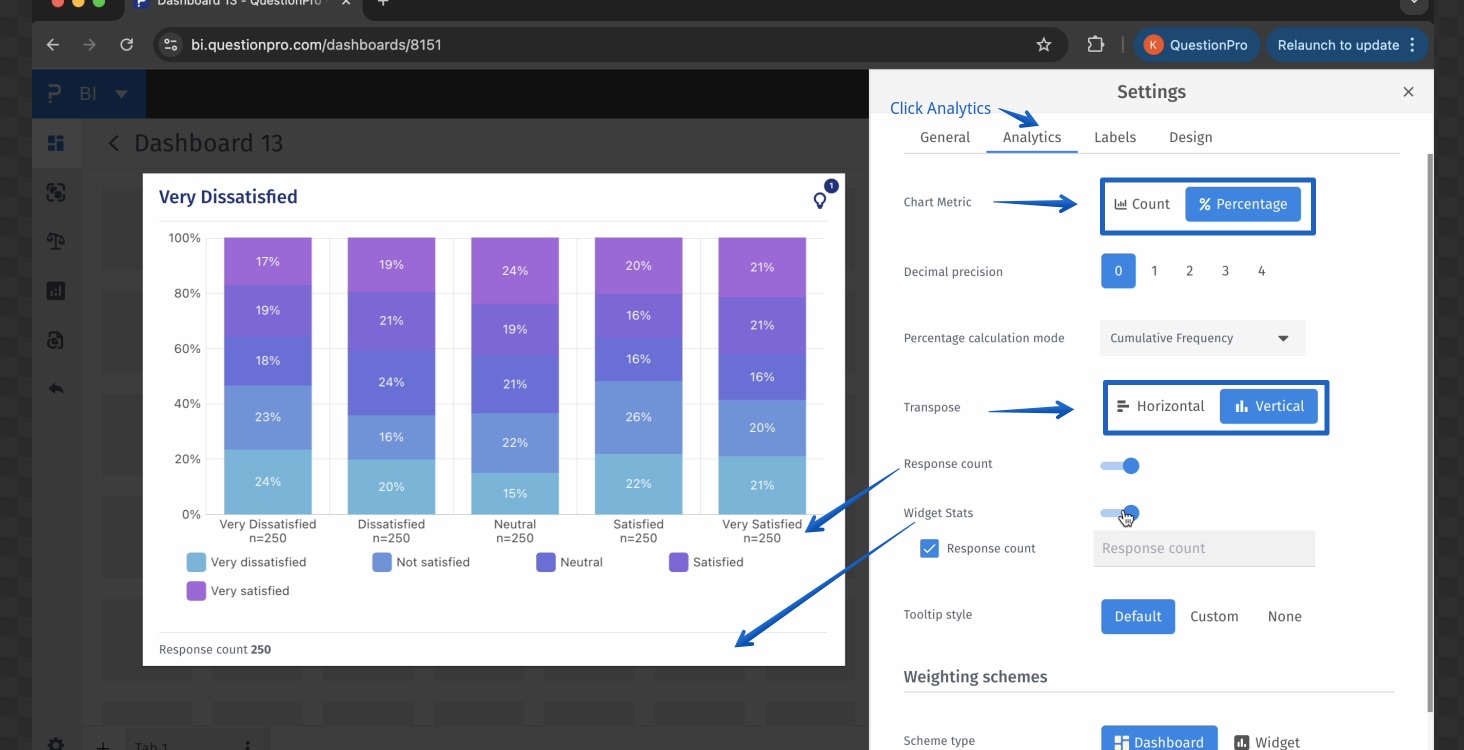
BI > Matrix Stackbar > 3 Dots > Settings
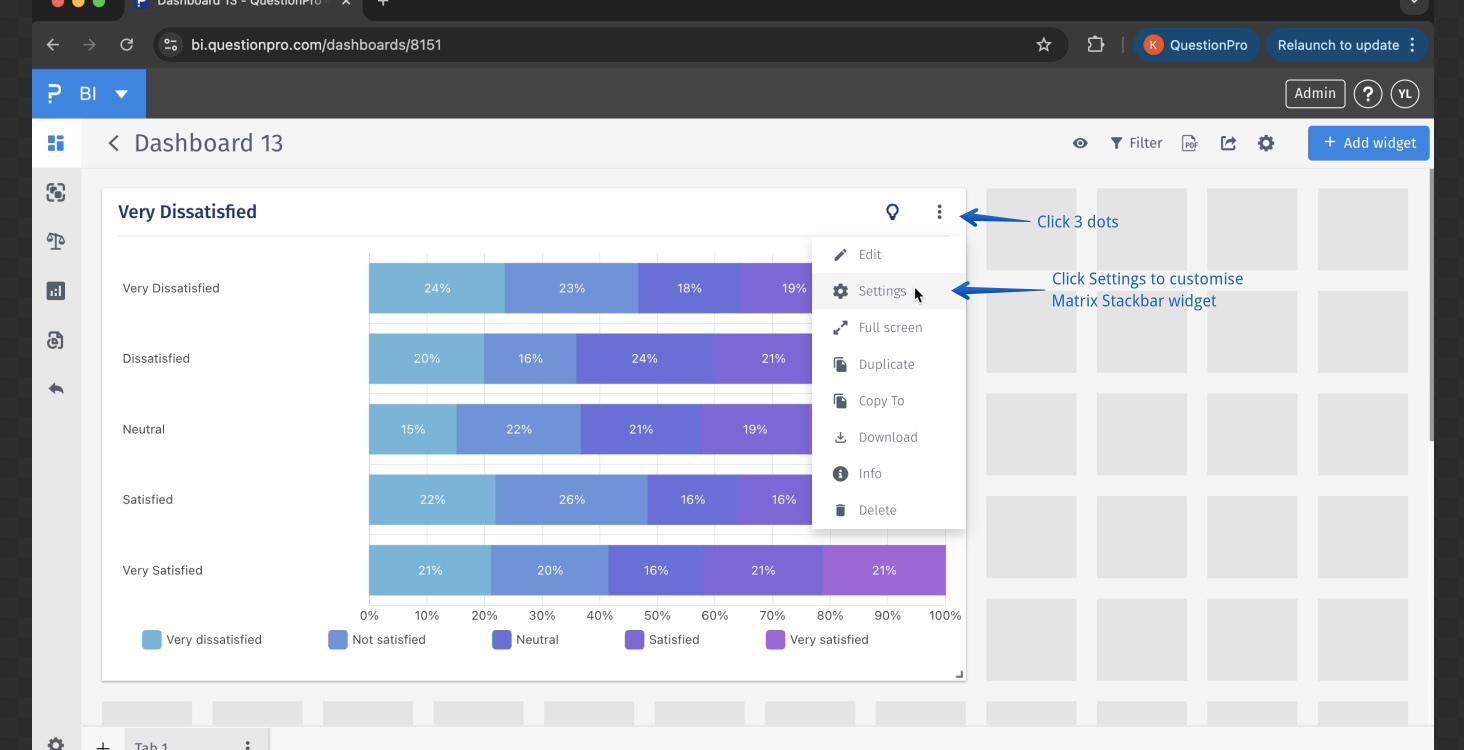
BI > Matrix Stackbar > 3 Dots > Settings > Analytics (Chart Metric, Transpose,Response Count and Widget Count)
Matrix Stackbar
- Matrix Question A survey question format where multiple items are evaluated using the same response scale.
- Stacked Bar Chart A bar chart where different segments are stacked within a single bar to show the proportional breakdown of response categories.
- Attribute An individual item or characteristic being rated in a matrix question (e.g., “Product Quality”).
- Likert Scale A common survey response scale ranging from one extreme to another (e.g., Strongly Agree to Strongly Disagree).
- Horizontal/Vertical Bar The orientation options for how the stacked bars are displayed—either side-by-side or top-to-bottom.