


Composite variables
Composite variables are a powerful feature that allows users to create new variables by combining two or more data points from an existing survey. It is designed to eliminate manual, offline workarounds and bring composite metric creation directly into the platform.
Click to download the video
-
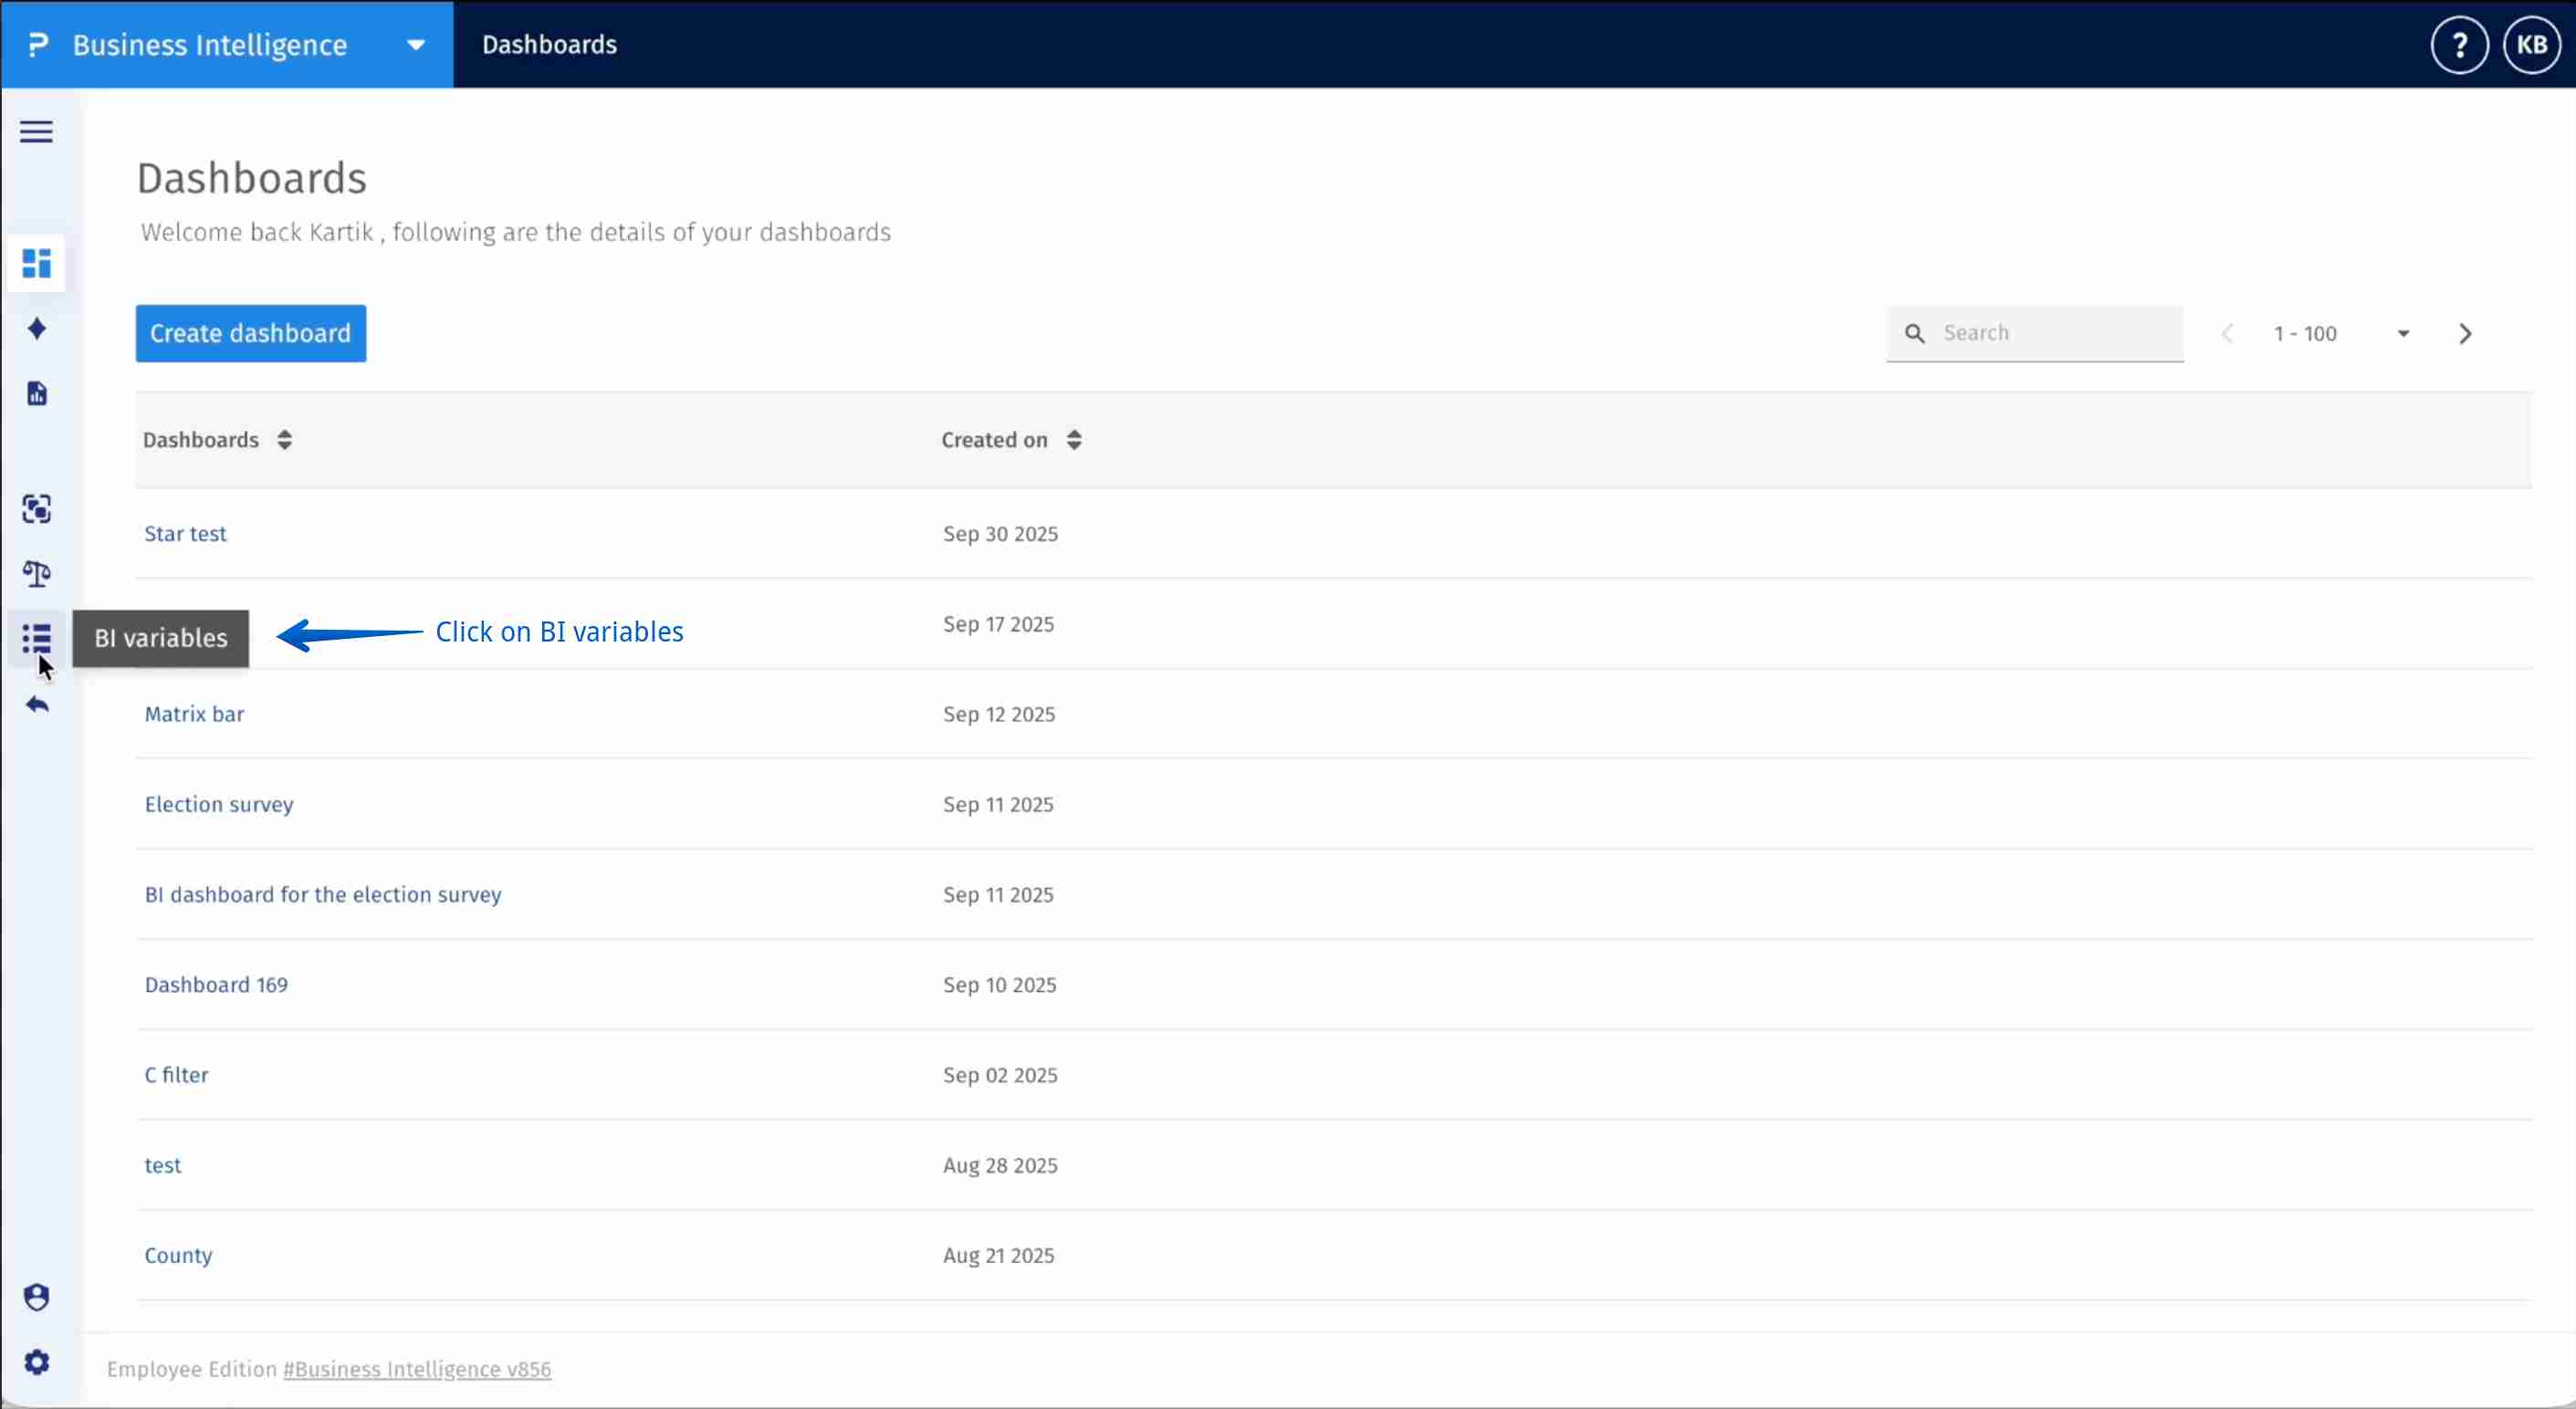
Step 1: Navigate to: BI Variables

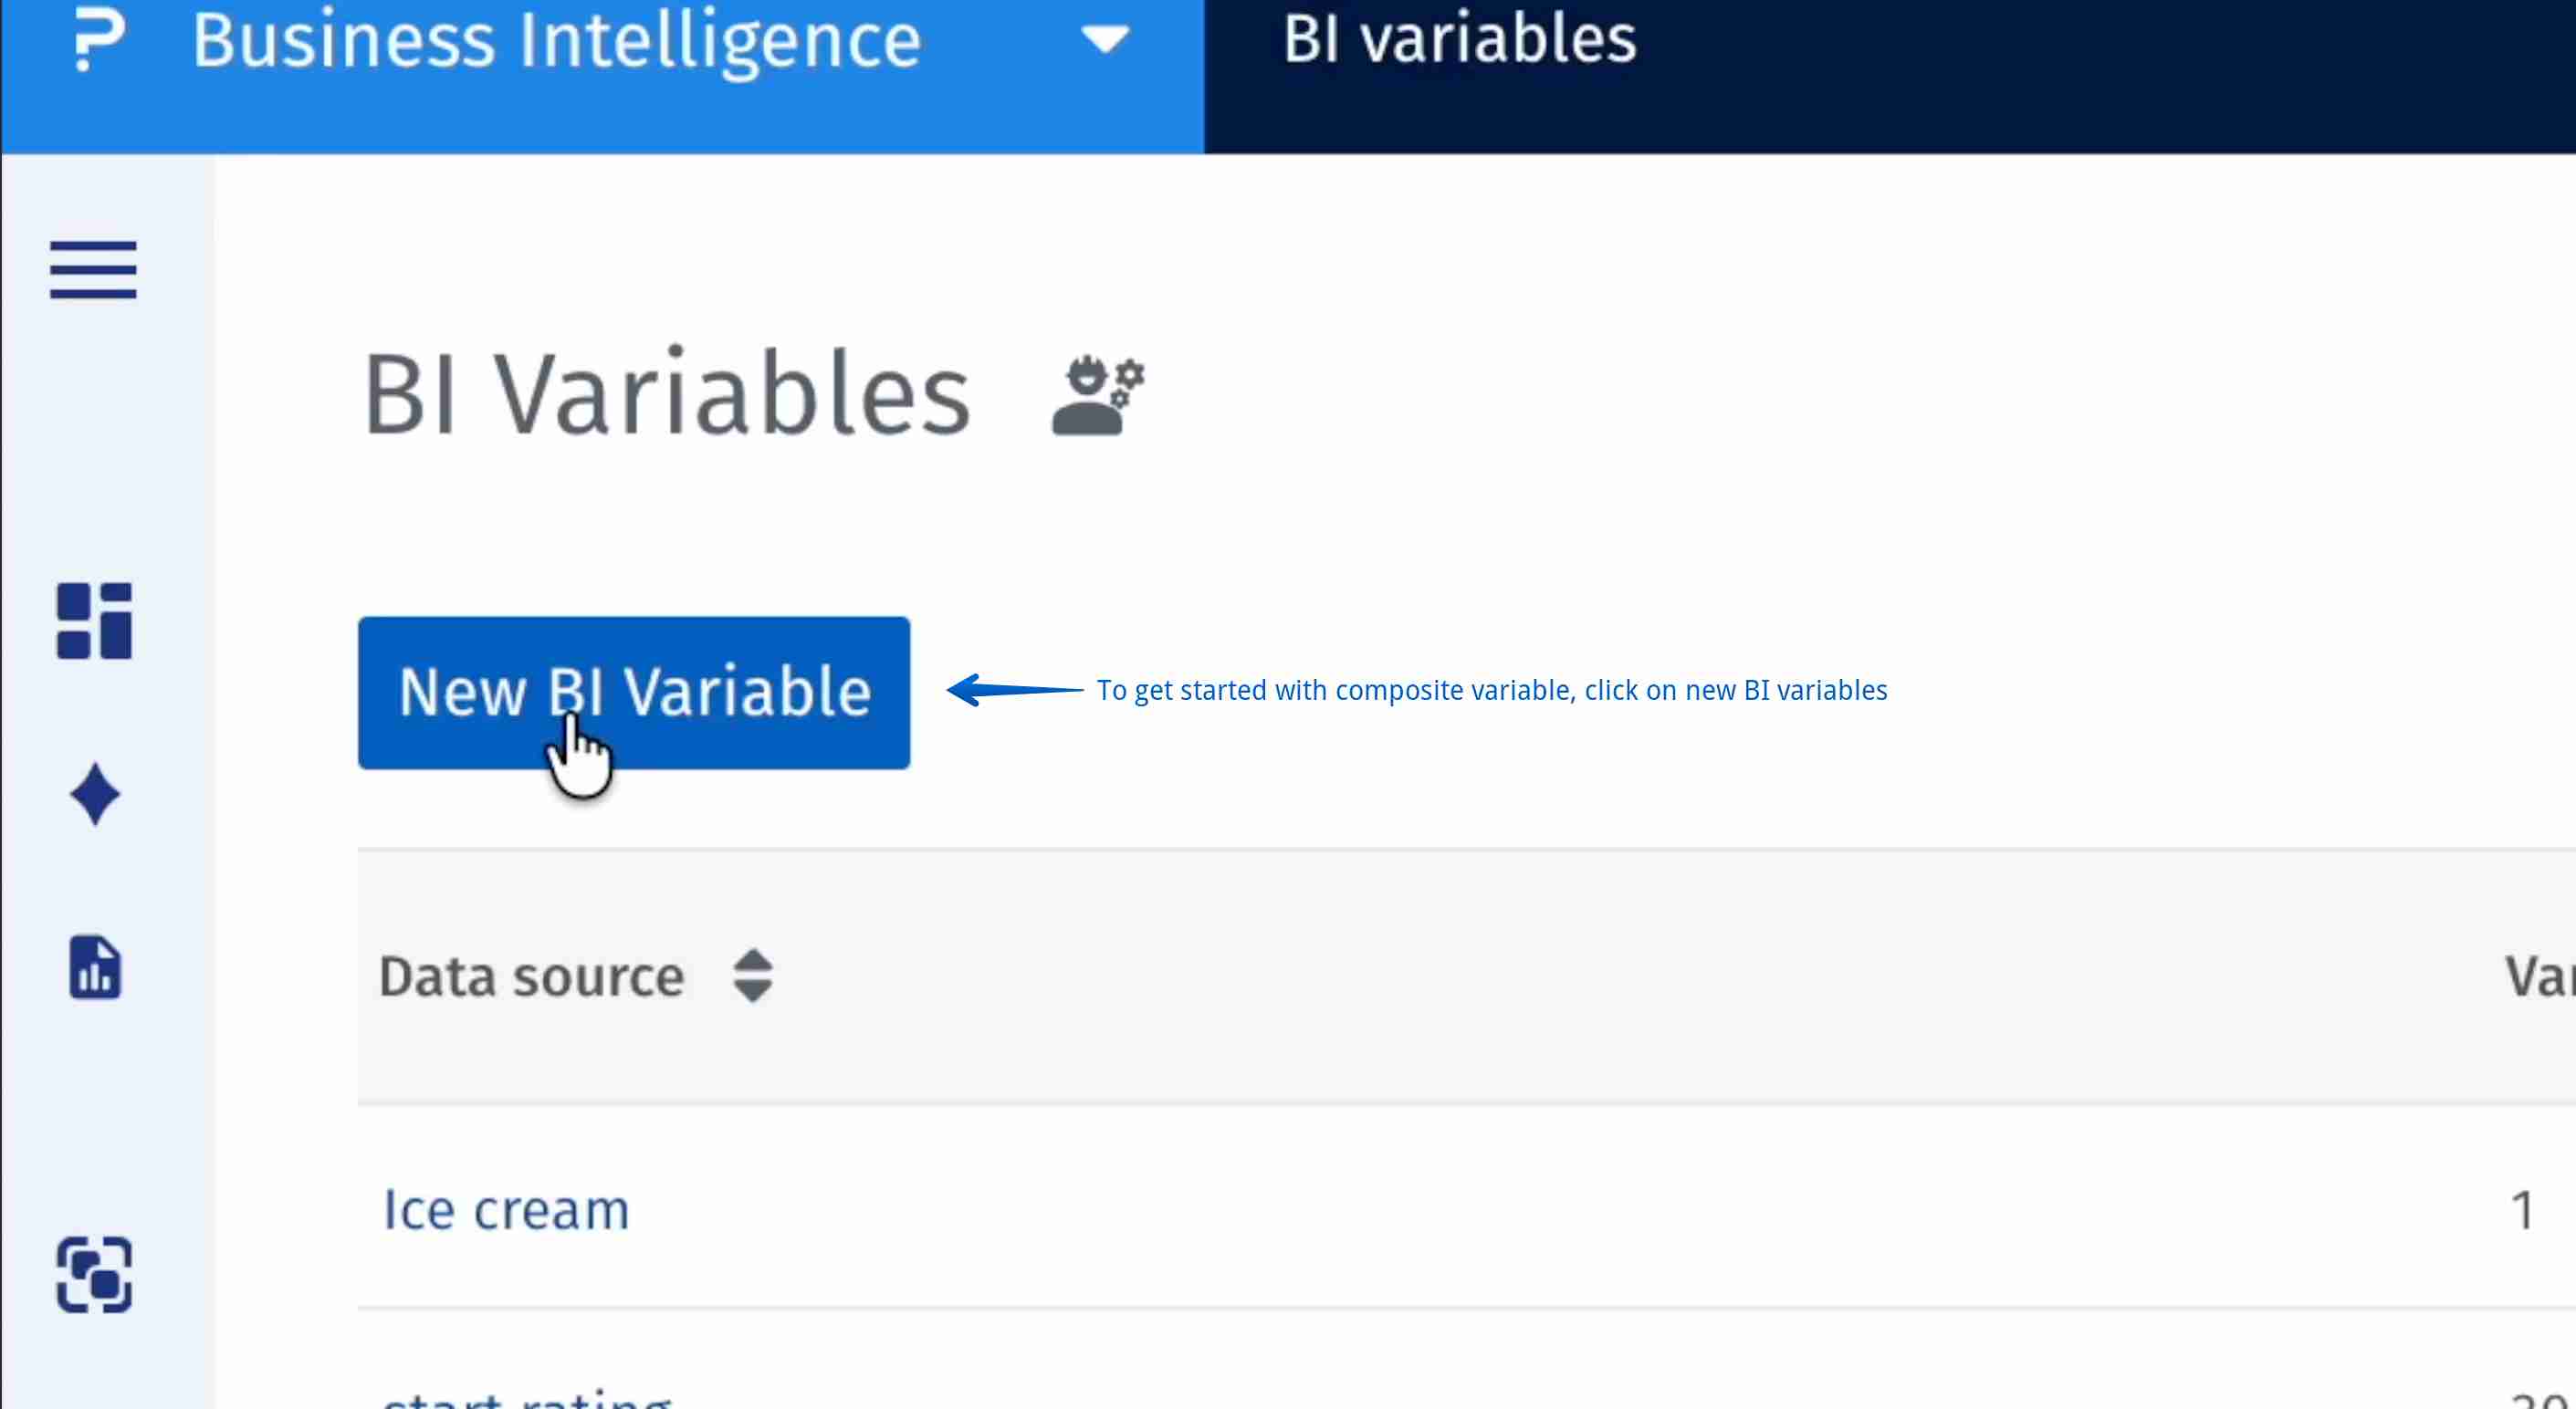
Click on New BI Variable to begin.
-
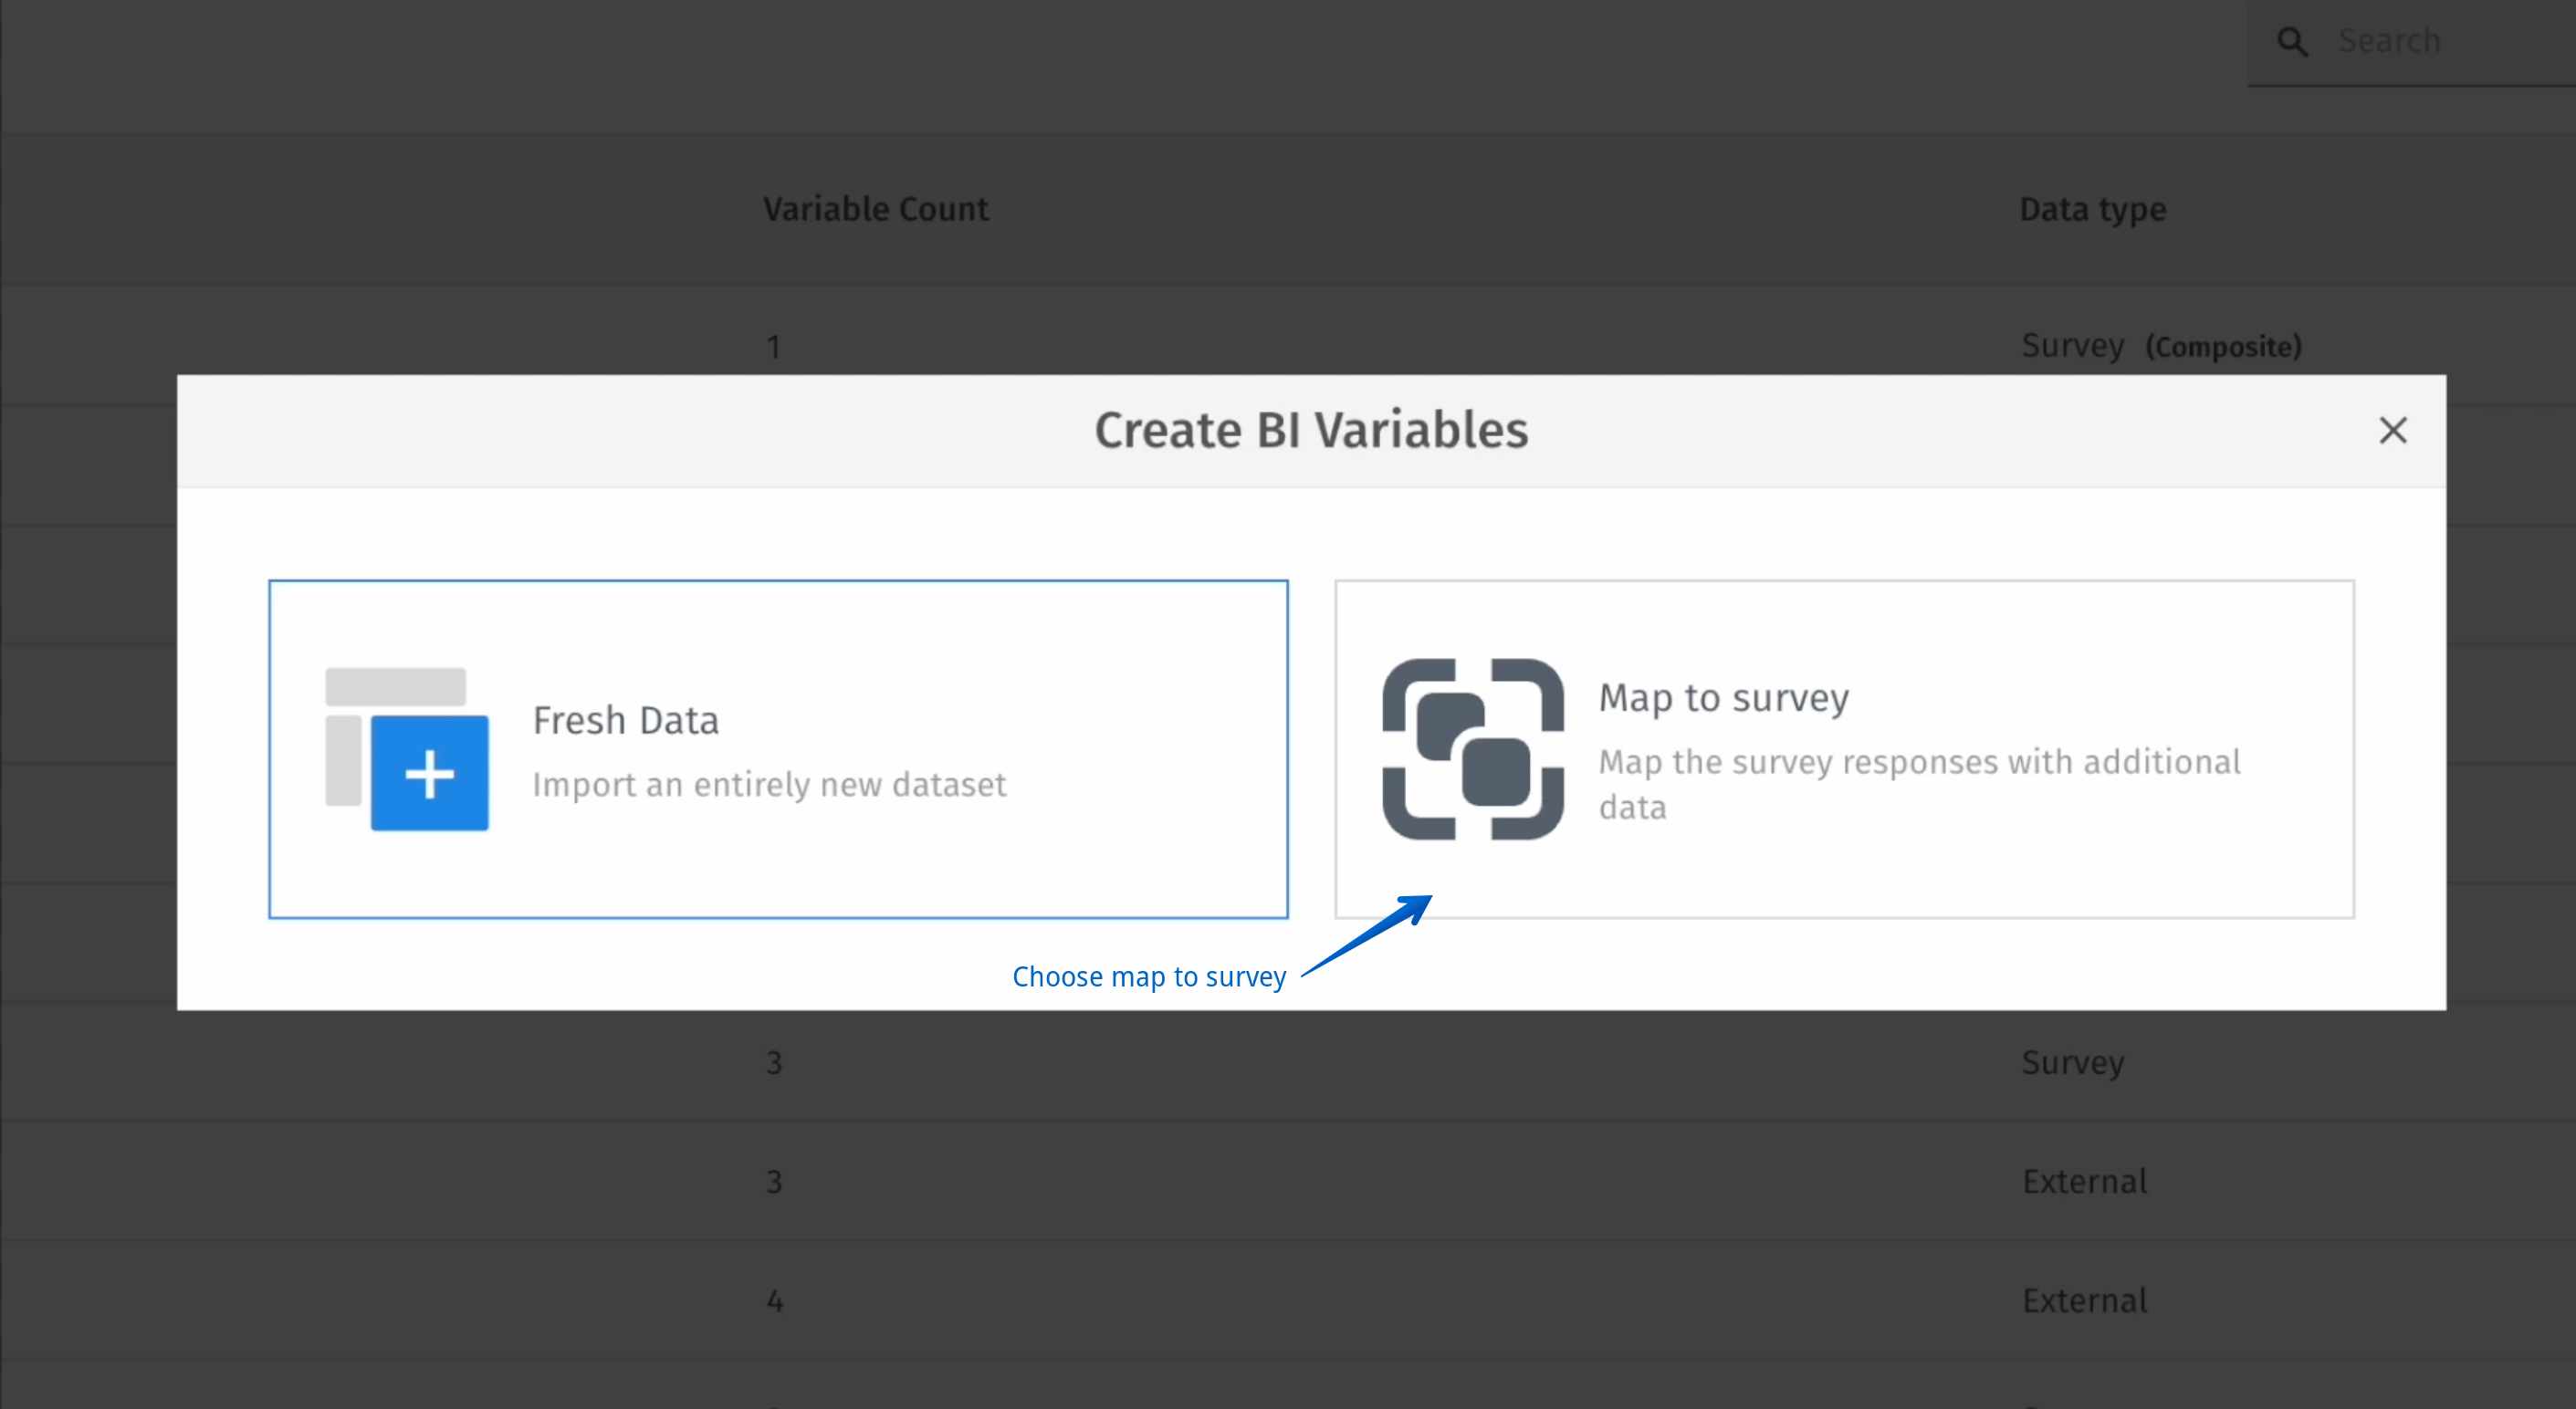
Step 2: Select Map to Survey.
This links the composite variable directly to your survey dataset, allowing it to be used like a survey question in analysis, dashboards, or filters.
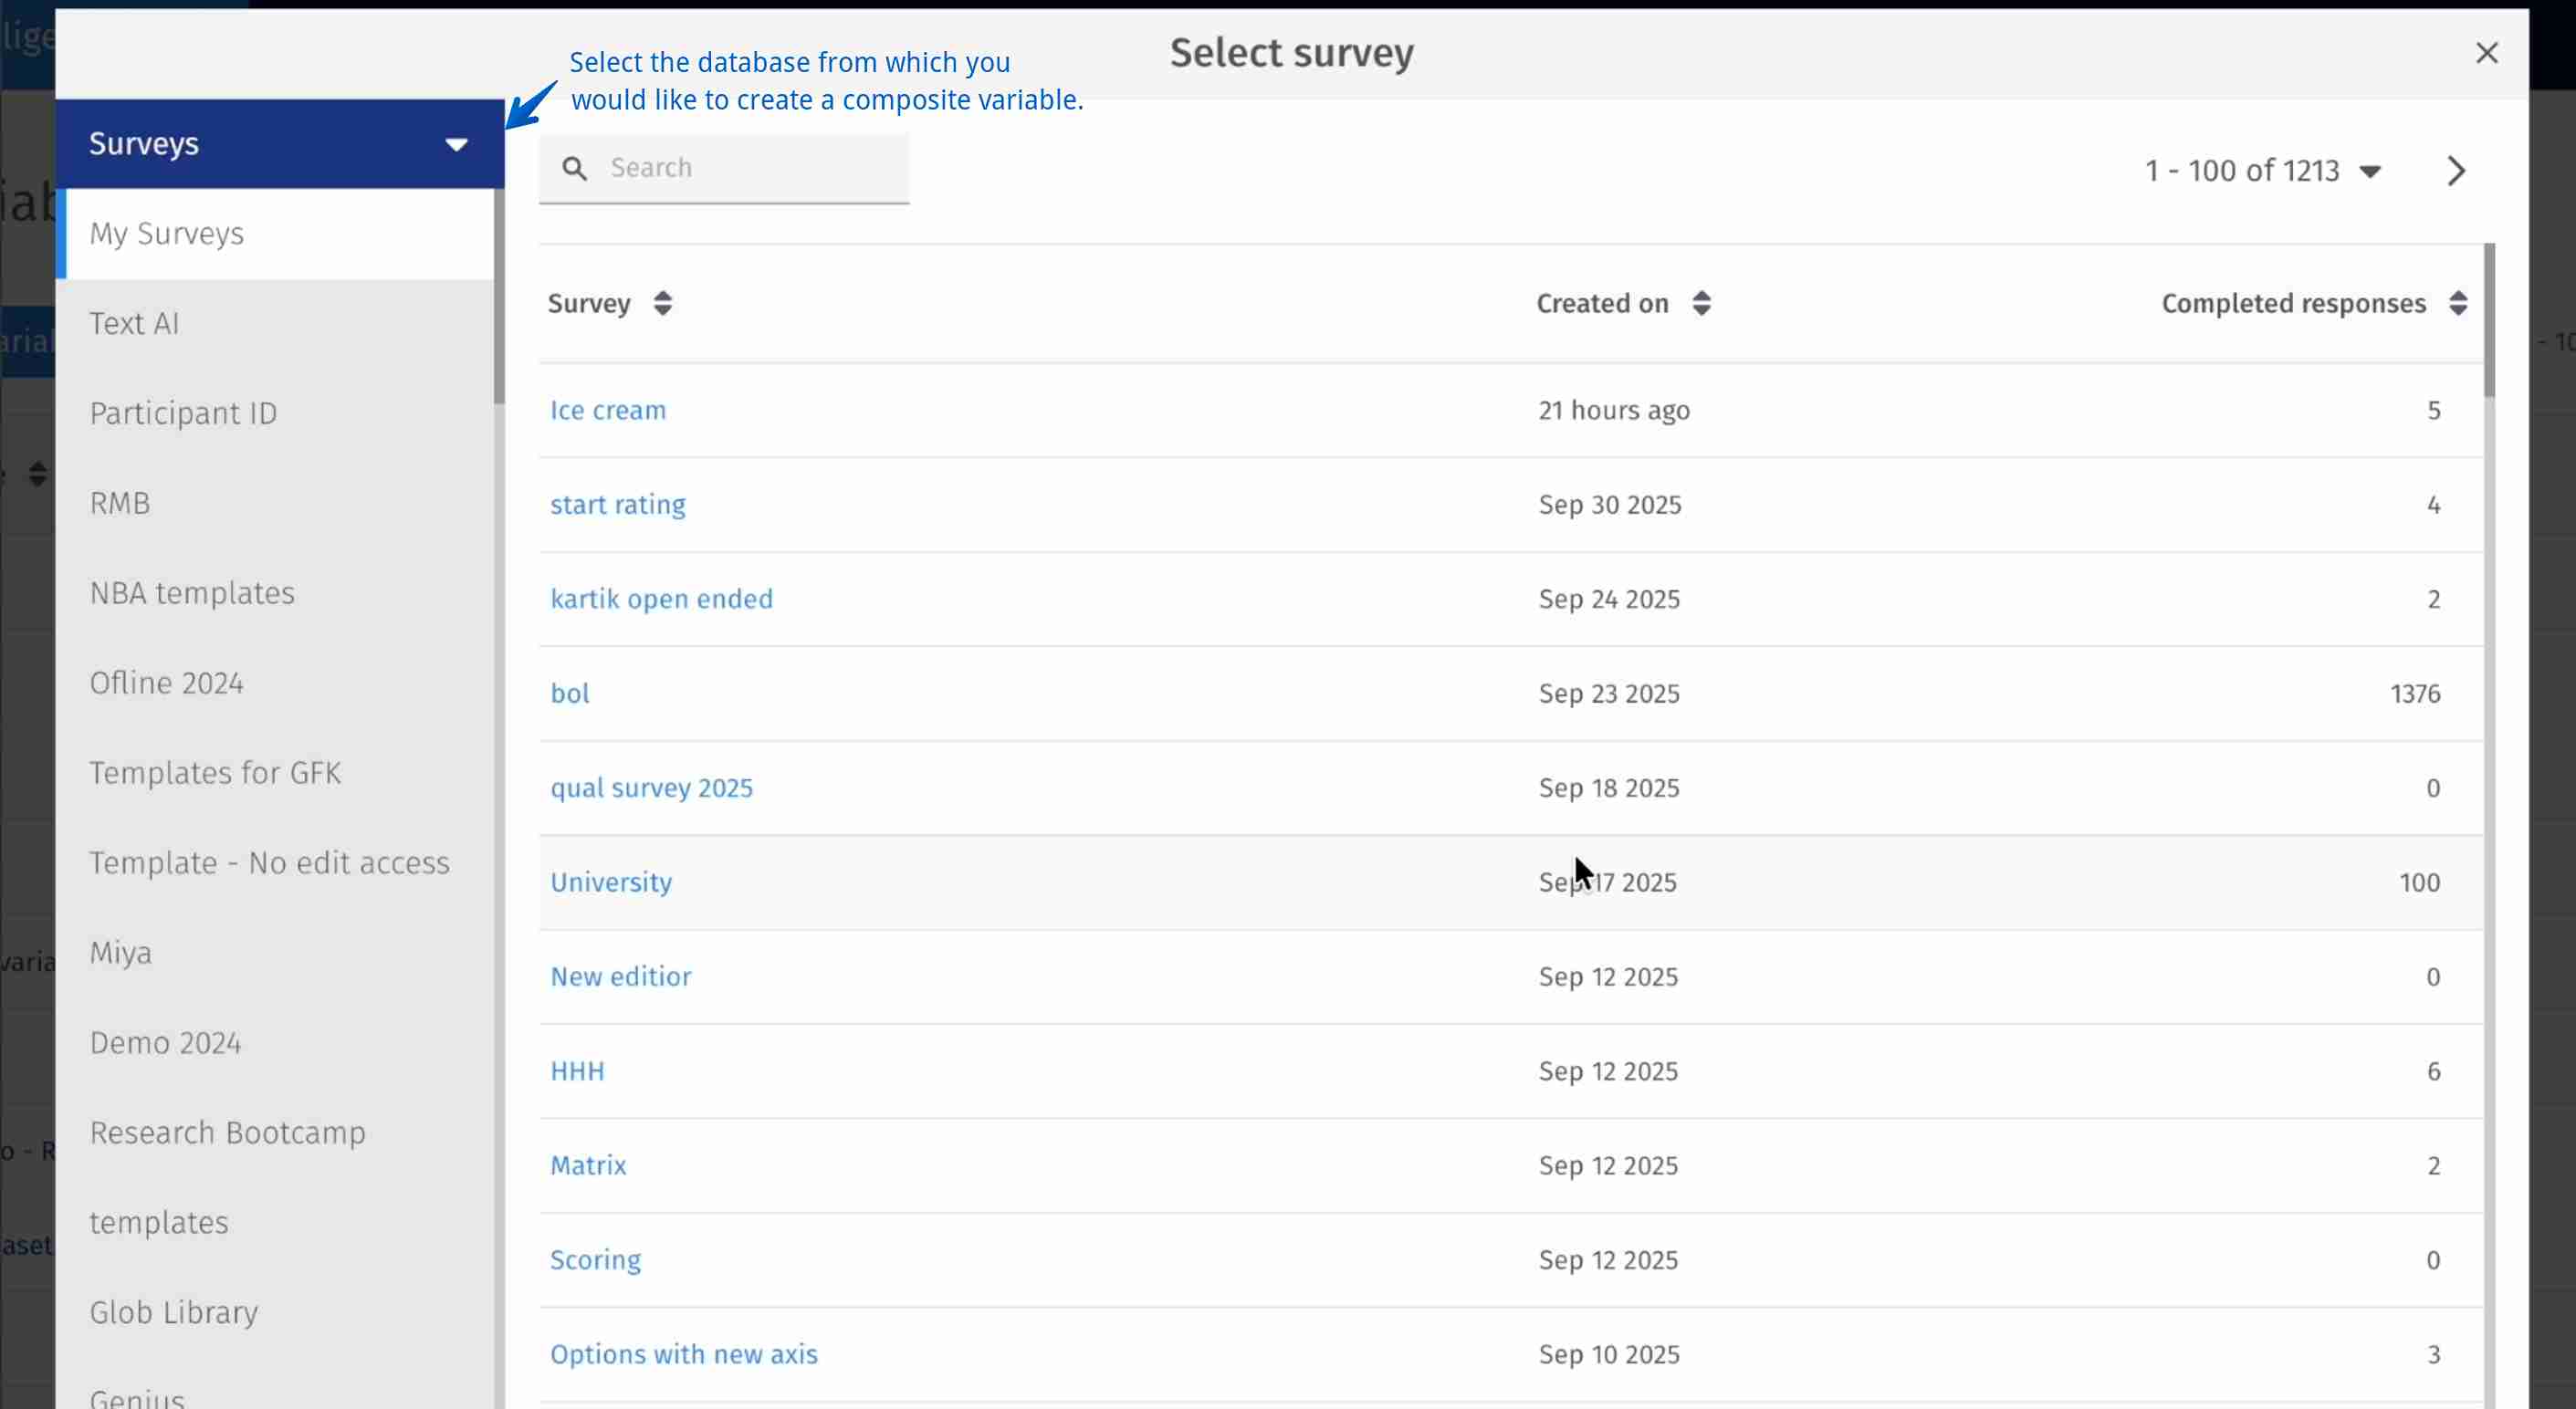
Select the data source
-
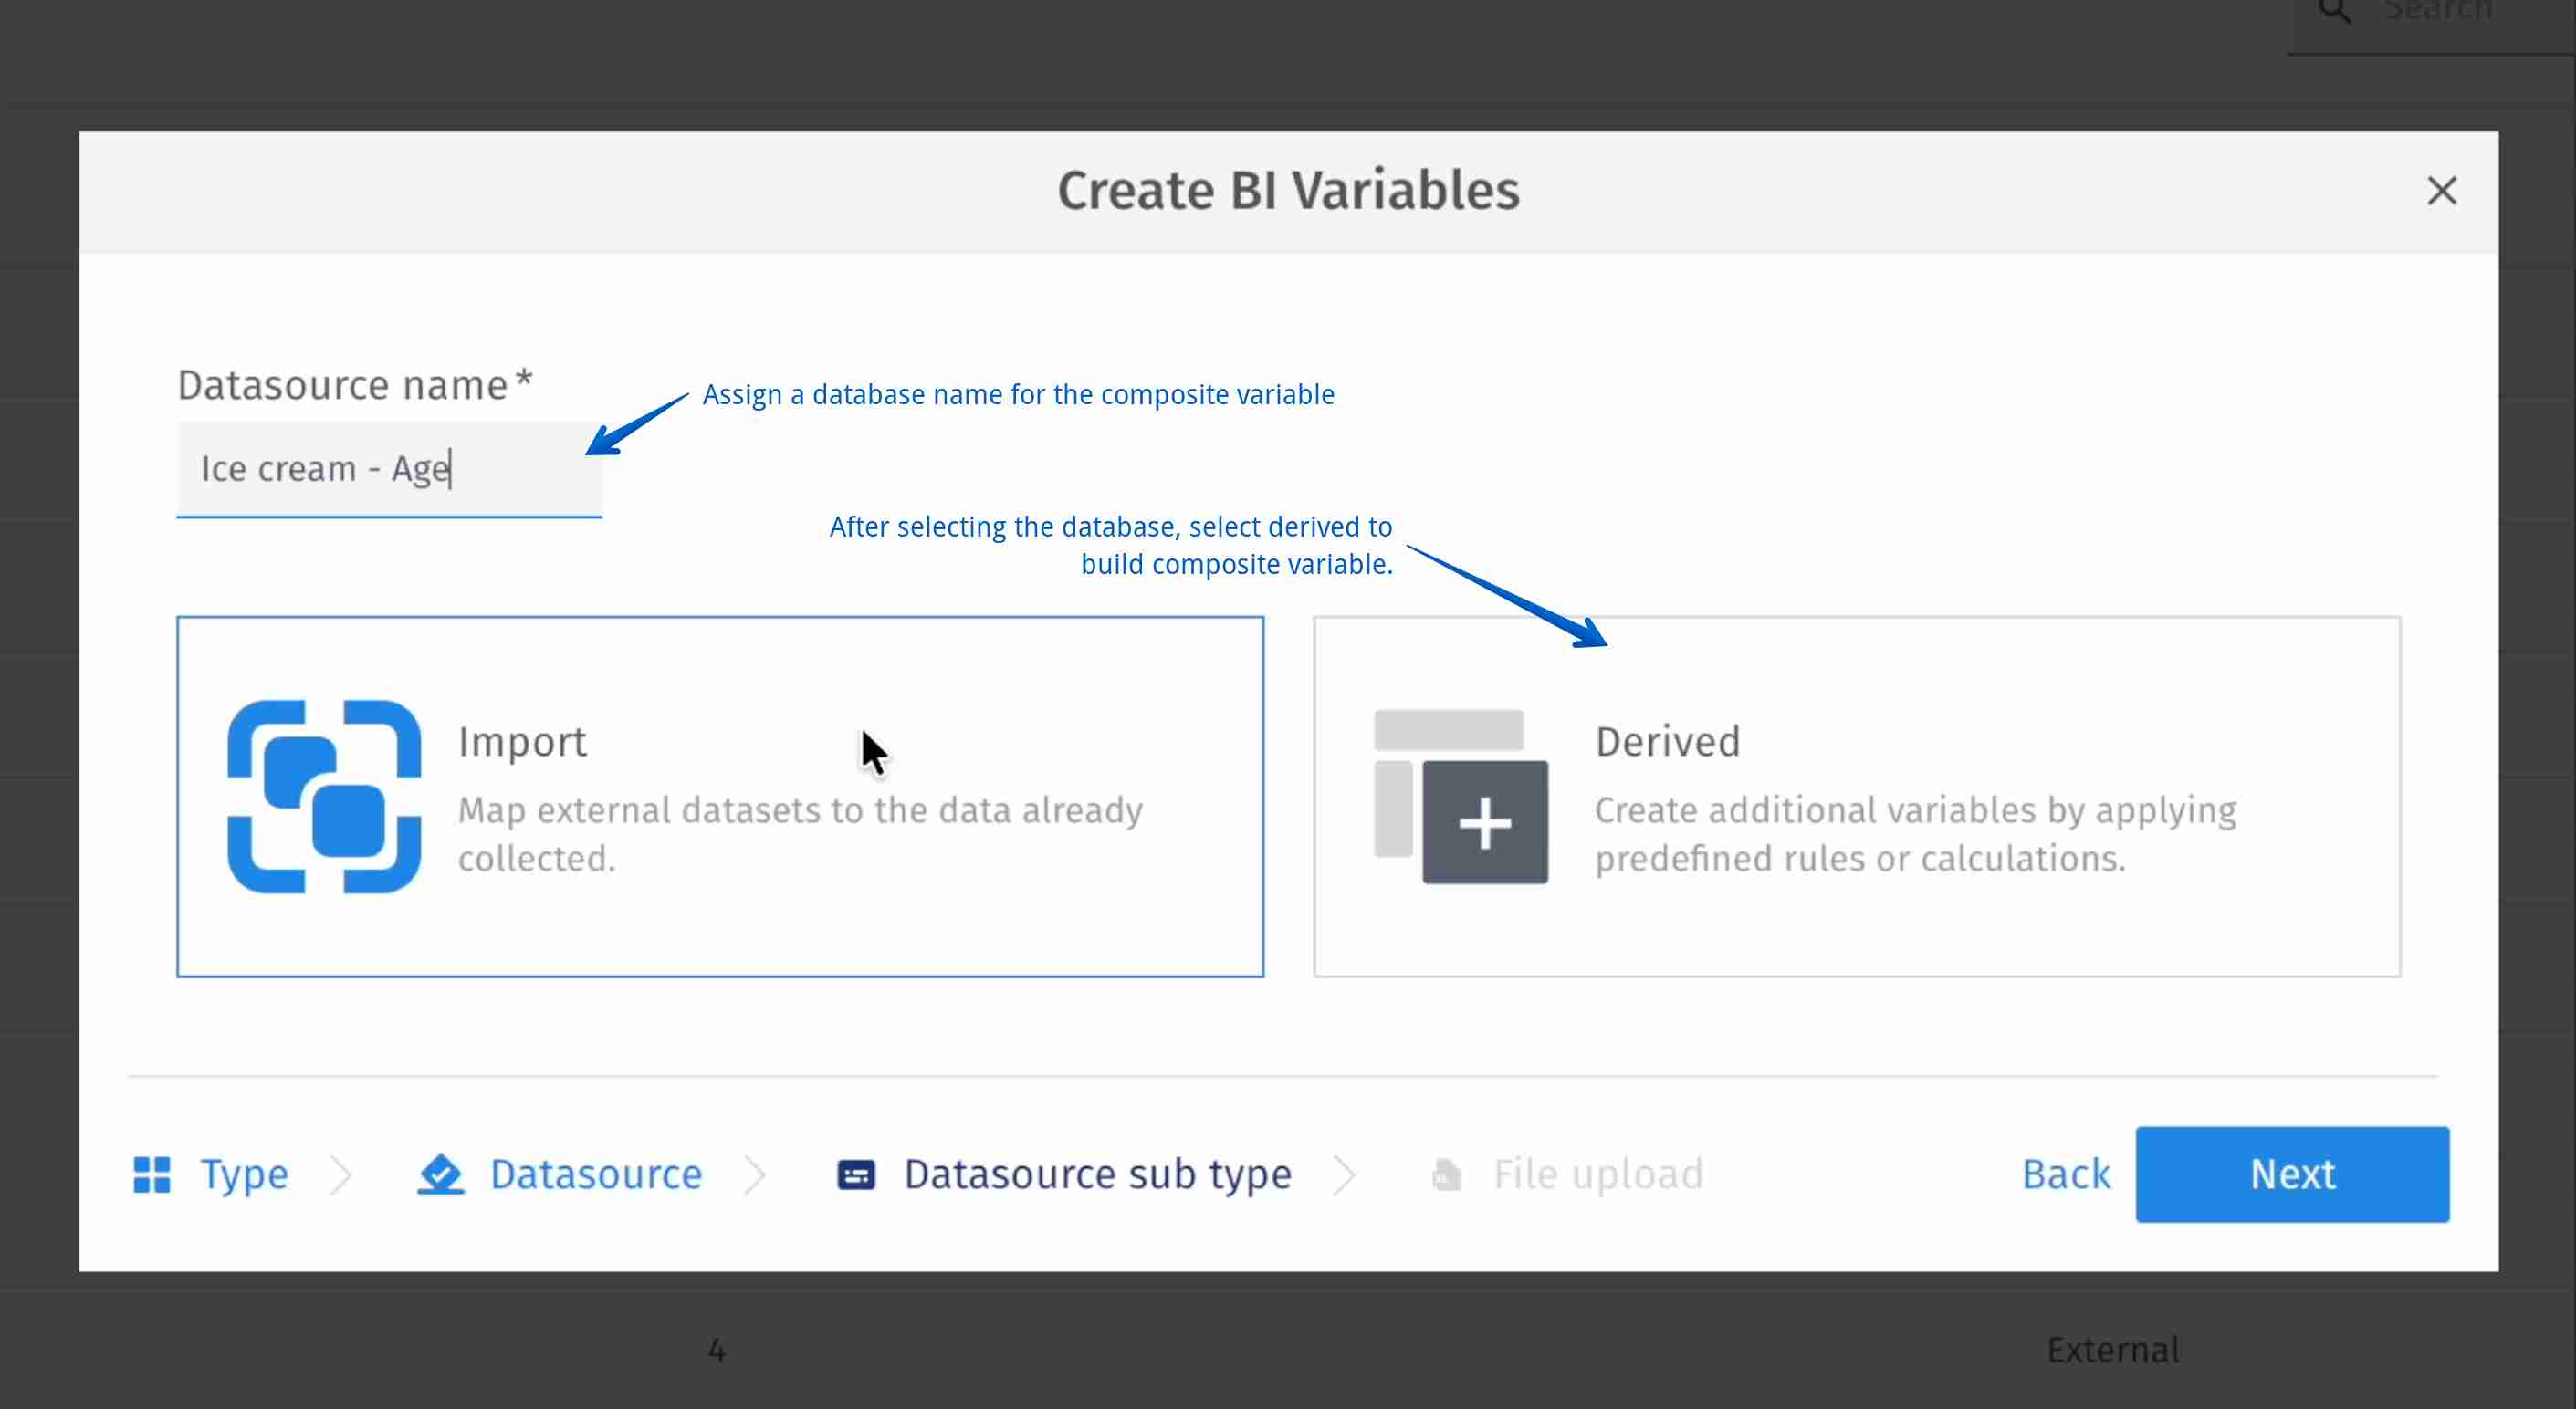
Step 3: Name the dataset and choose Derived.
Give your dataset a clear name such as Demographics Derived Data or Customer Segments. Then select the Derived option, indicating that this dataset will be generated using existing data fields.
-
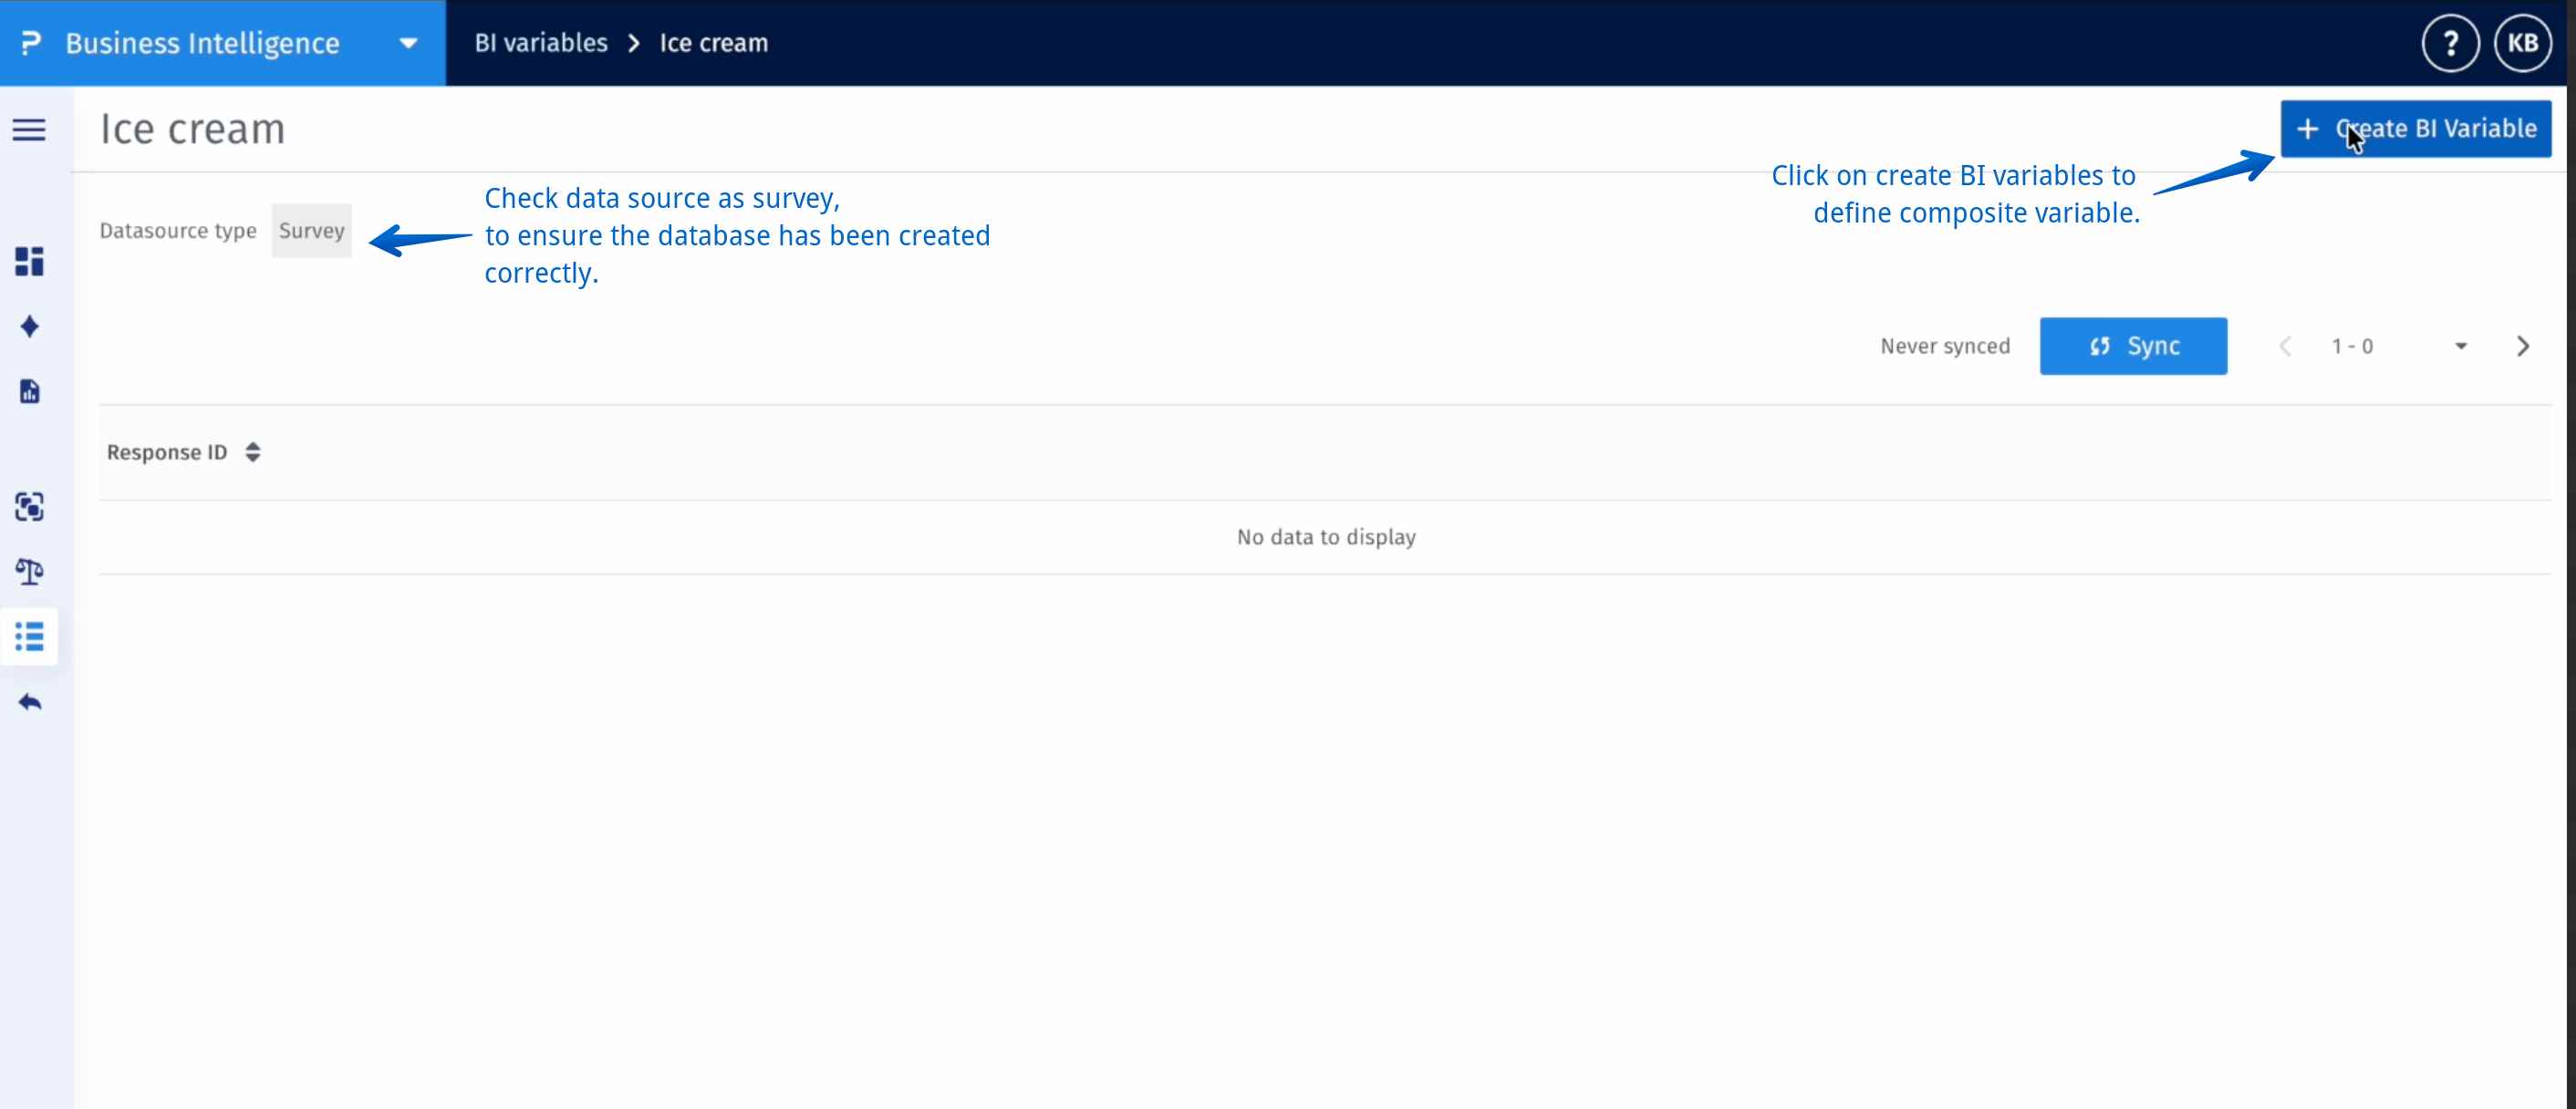
Step 4: Create the BI Variable.
Click Create BI Variable to proceed with defining the new variable. You’ll now specify its name and value ranges.
-
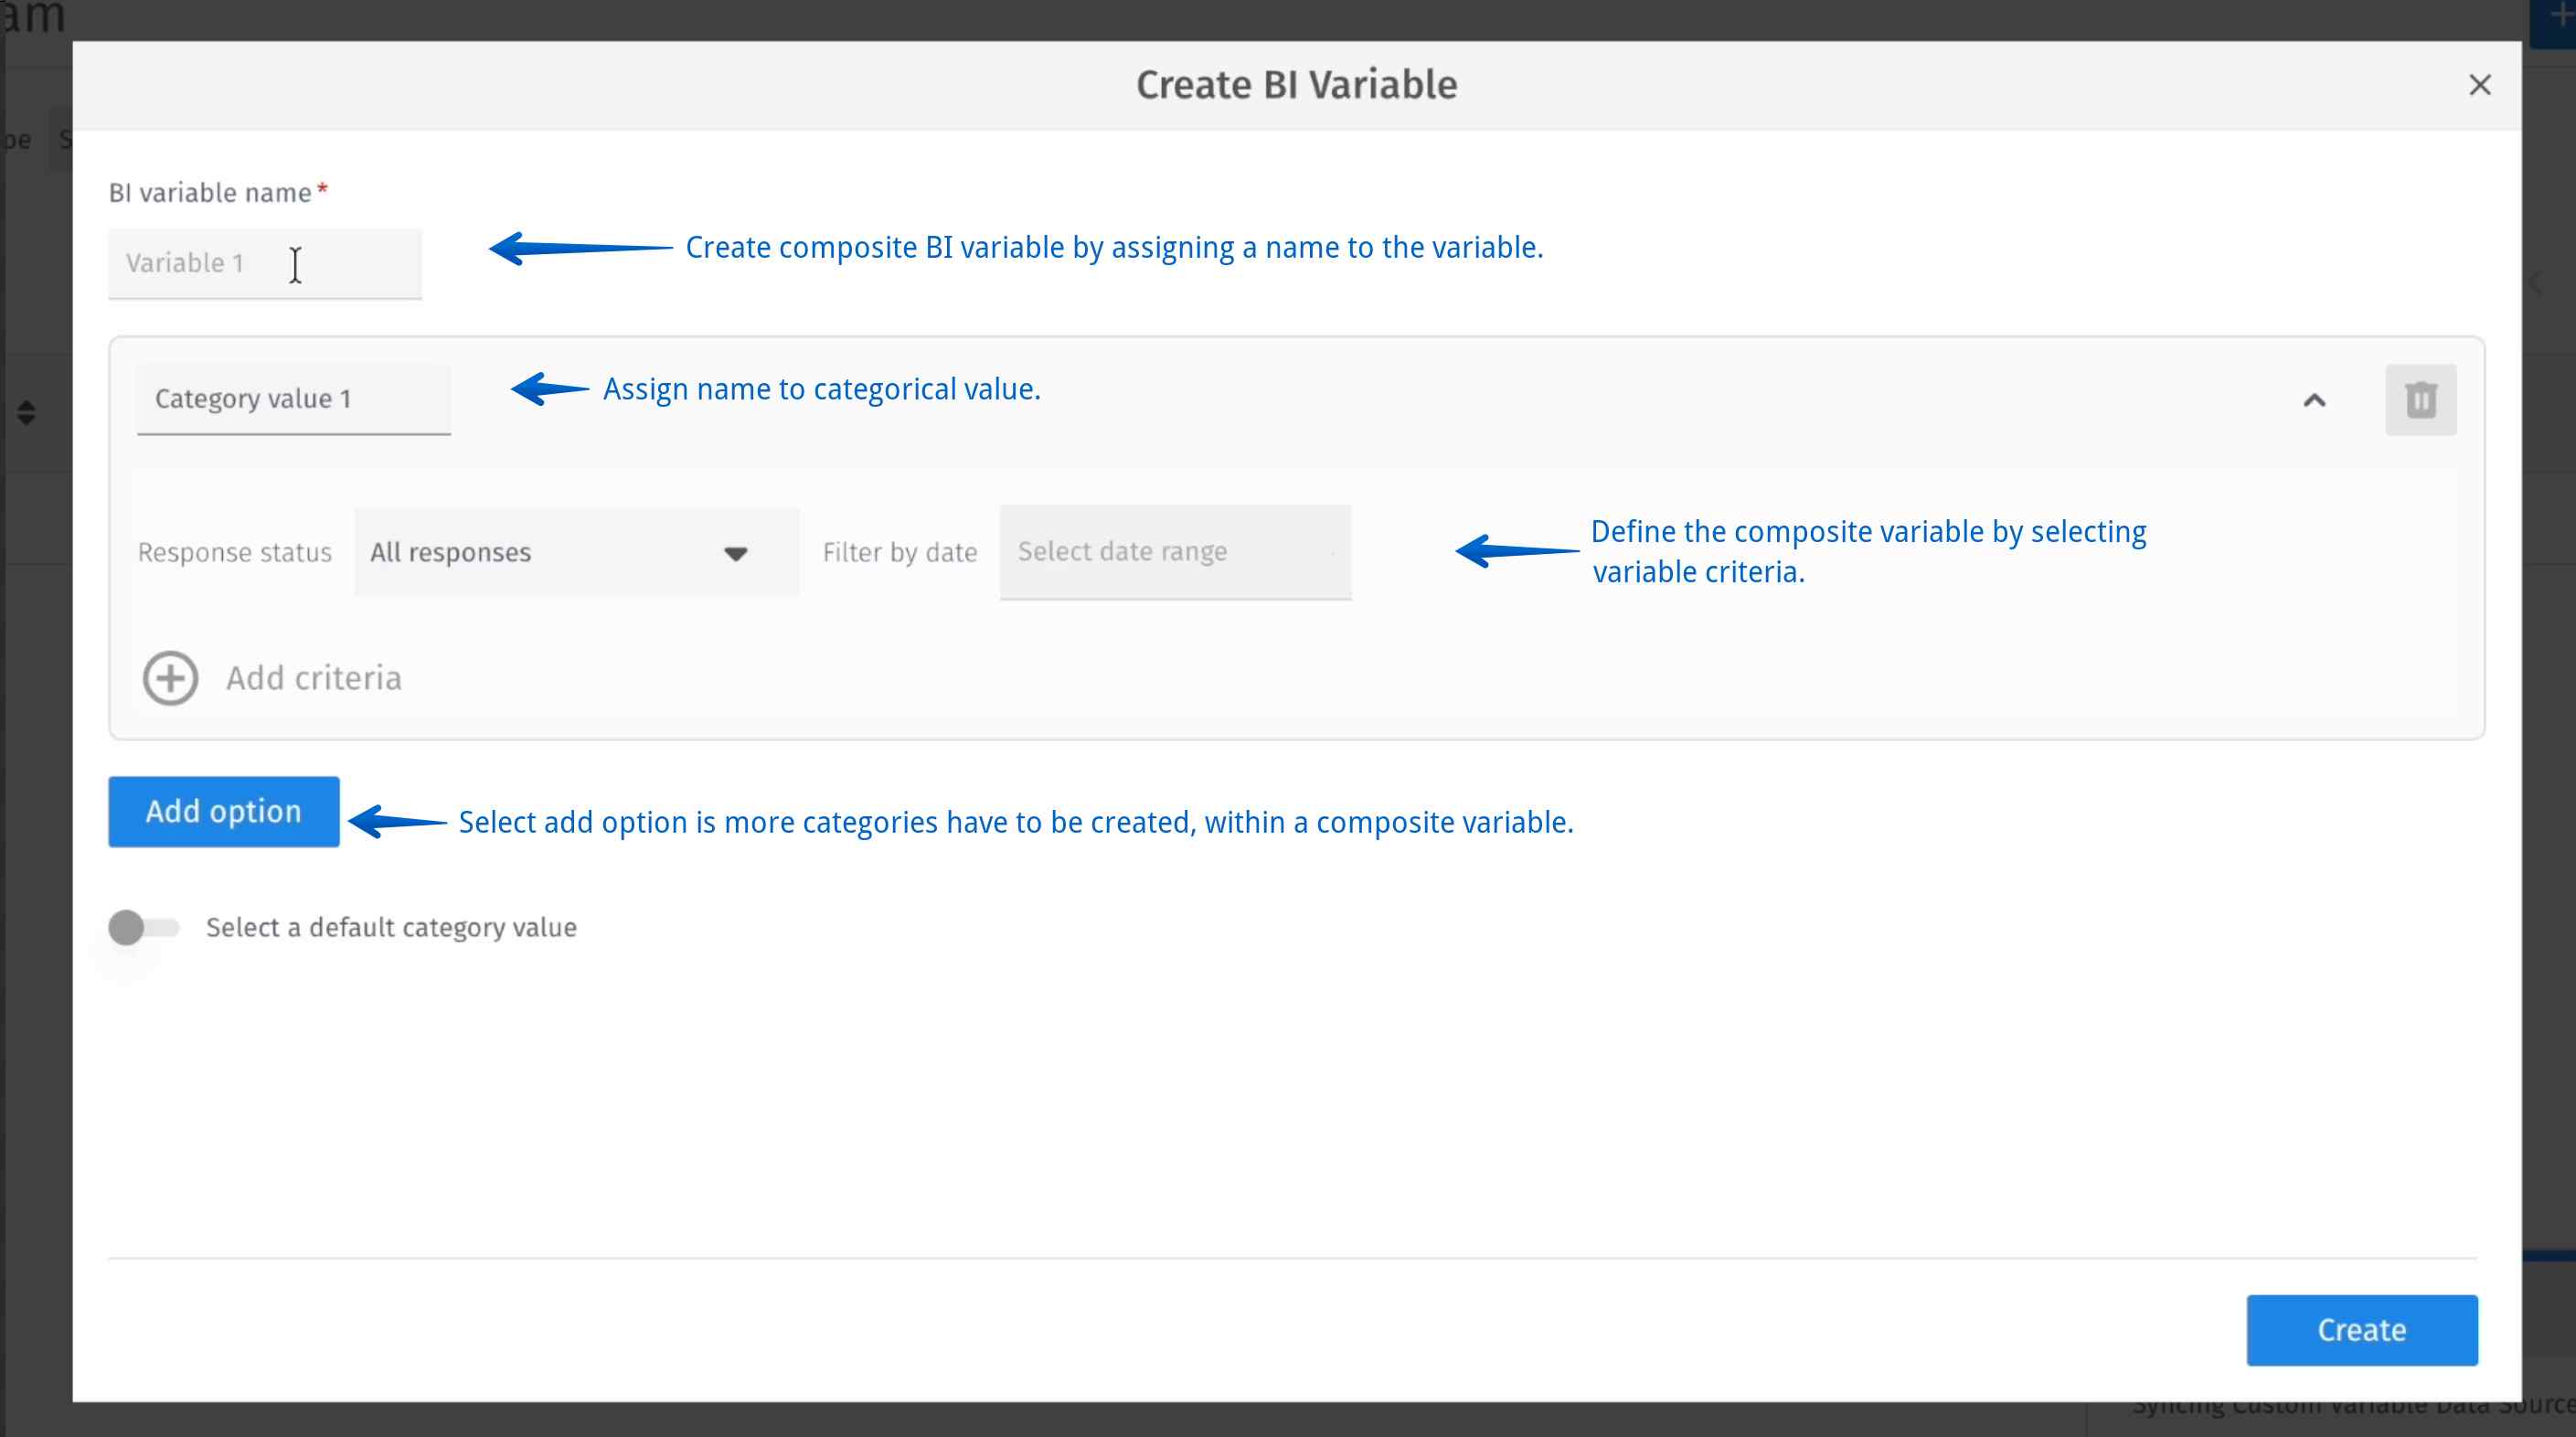
Step 5: Define the variable.
Enter a descriptive name for your new variable — for example, Age Group or Income Band. This name will appear in reports and visualizations.
-
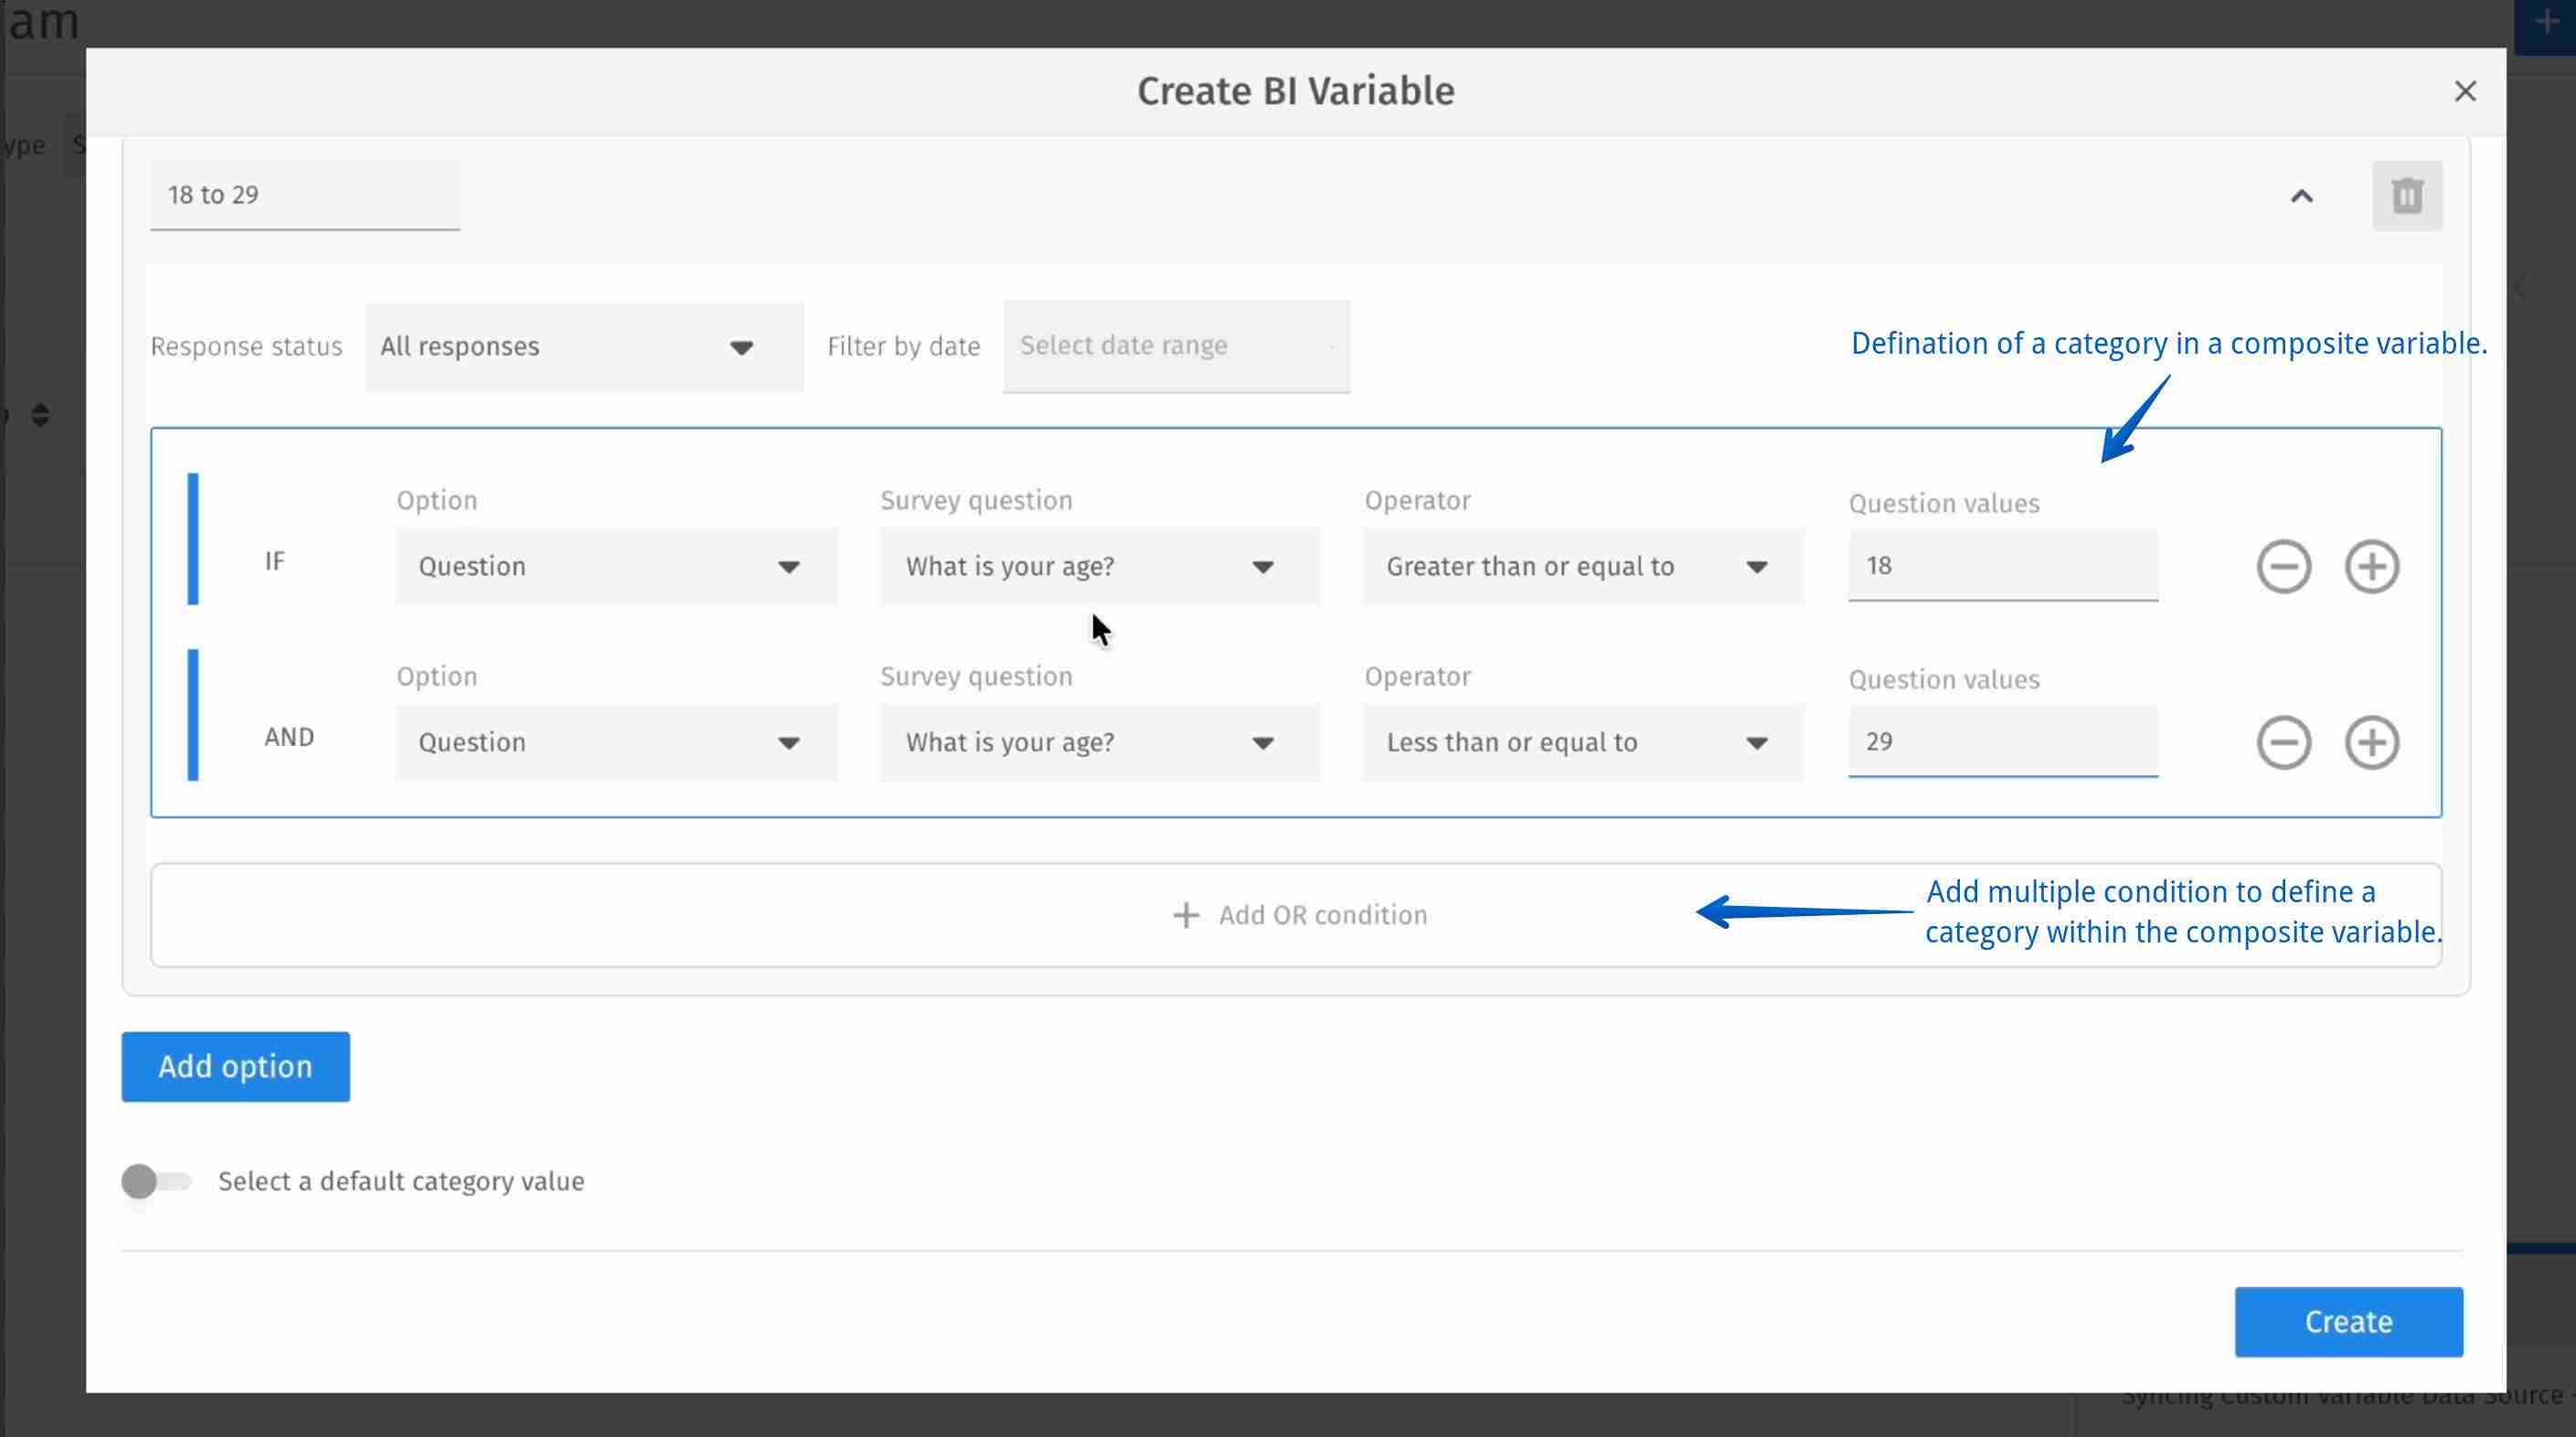
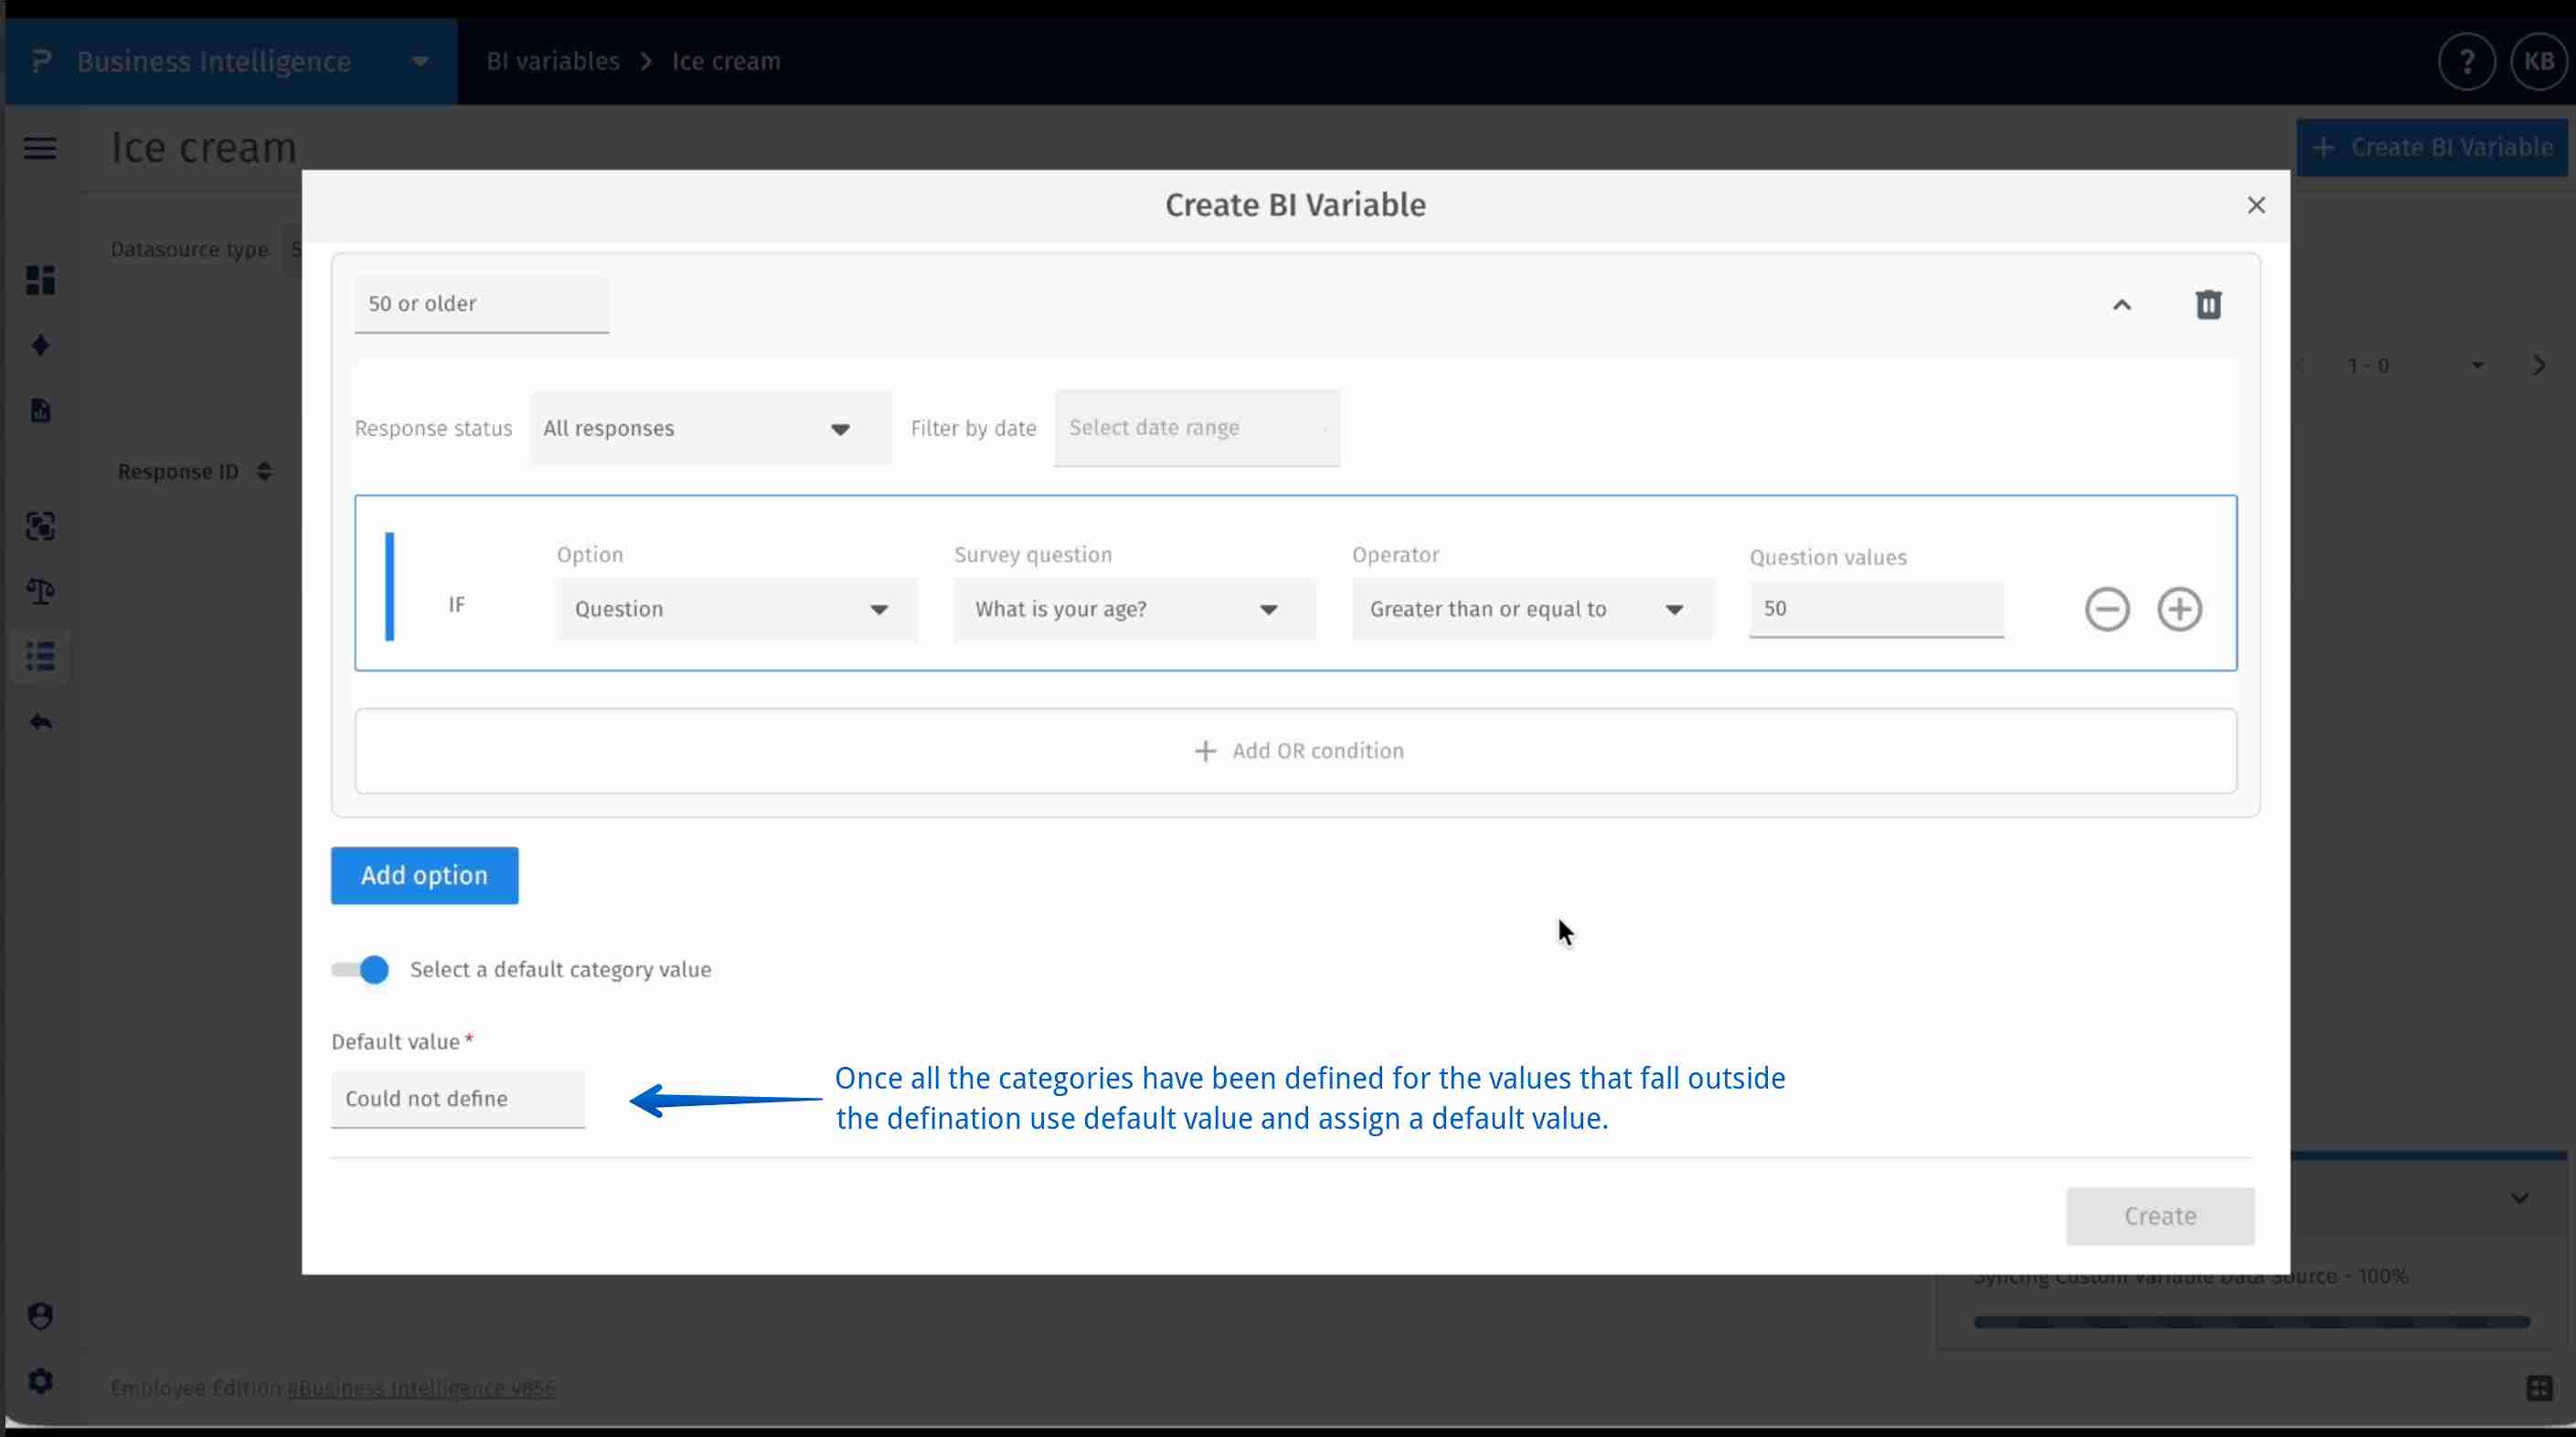
Step 6: Add the variable values and the conditions associated with it.
Define your value ranges. For instance, for an Age Group variable, you might add:
- 18 to 29
- 30 to 39
- 40 to 49
- 50 or older
Each range represents a segment that respondents will be grouped into based on their original data.
If there are any respondent that fall outside the boundaries of defined composite variable, select the default category and assign an appropriate default value.
-
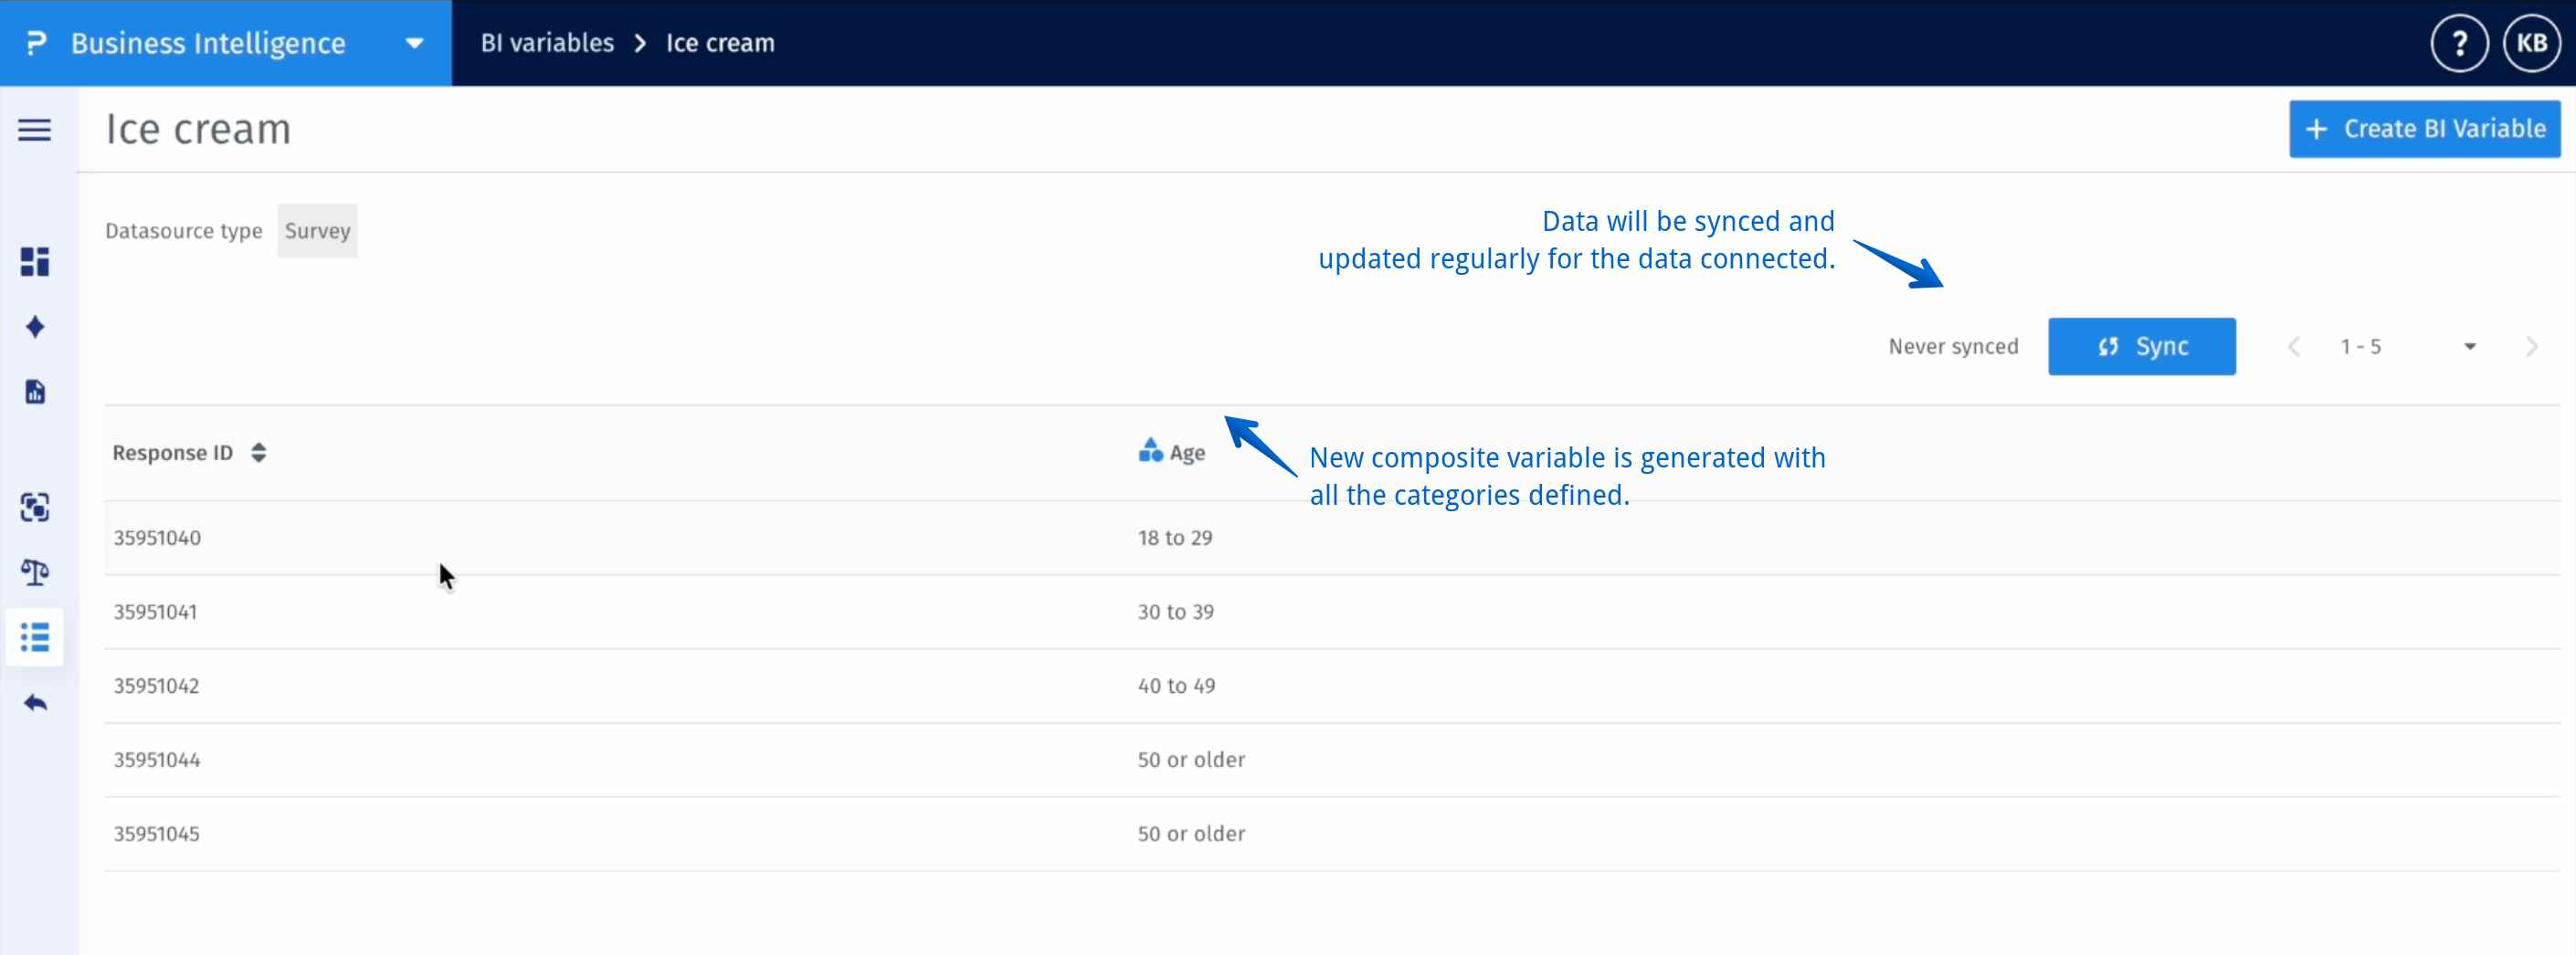
Step 7: Save and sync.
Once you’ve defined all values, click Create. The new variable will be generated automatically and synced within minutes. The dataset also auto-syncs every 24 hours to keep your data current.
You can add upto 50 values.
You can add upto 400 variables.
You can add upto 400 variables.
This feature is available with the following licenses :
Research Edition Communities Customer Experience Employee Experience University - Research Edition