


Data Slicers and Stat Testing in TextAI
Data Slicers in QuestionPro TextAI help you filter and compare dashboard results across specific audience segments. By defining slicer criteria from survey questions and response values, teams can review how themes, sub-themes, and response patterns differ across groups such as gender, region, role, customer type, or any other available segment.
Stat Testing adds another layer of confidence to this analysis by highlighting statistically meaningful differences across the overall data and applied Data Slicers. Together, Data Slicers and Stat Testing help researchers, CX teams, and business stakeholders move from broad dashboard summaries to segment-level insights that are easier to compare and act on.
Watch this video for a quick overview of Data Slicers and Stat Testing in TextAI:
Click to download the video
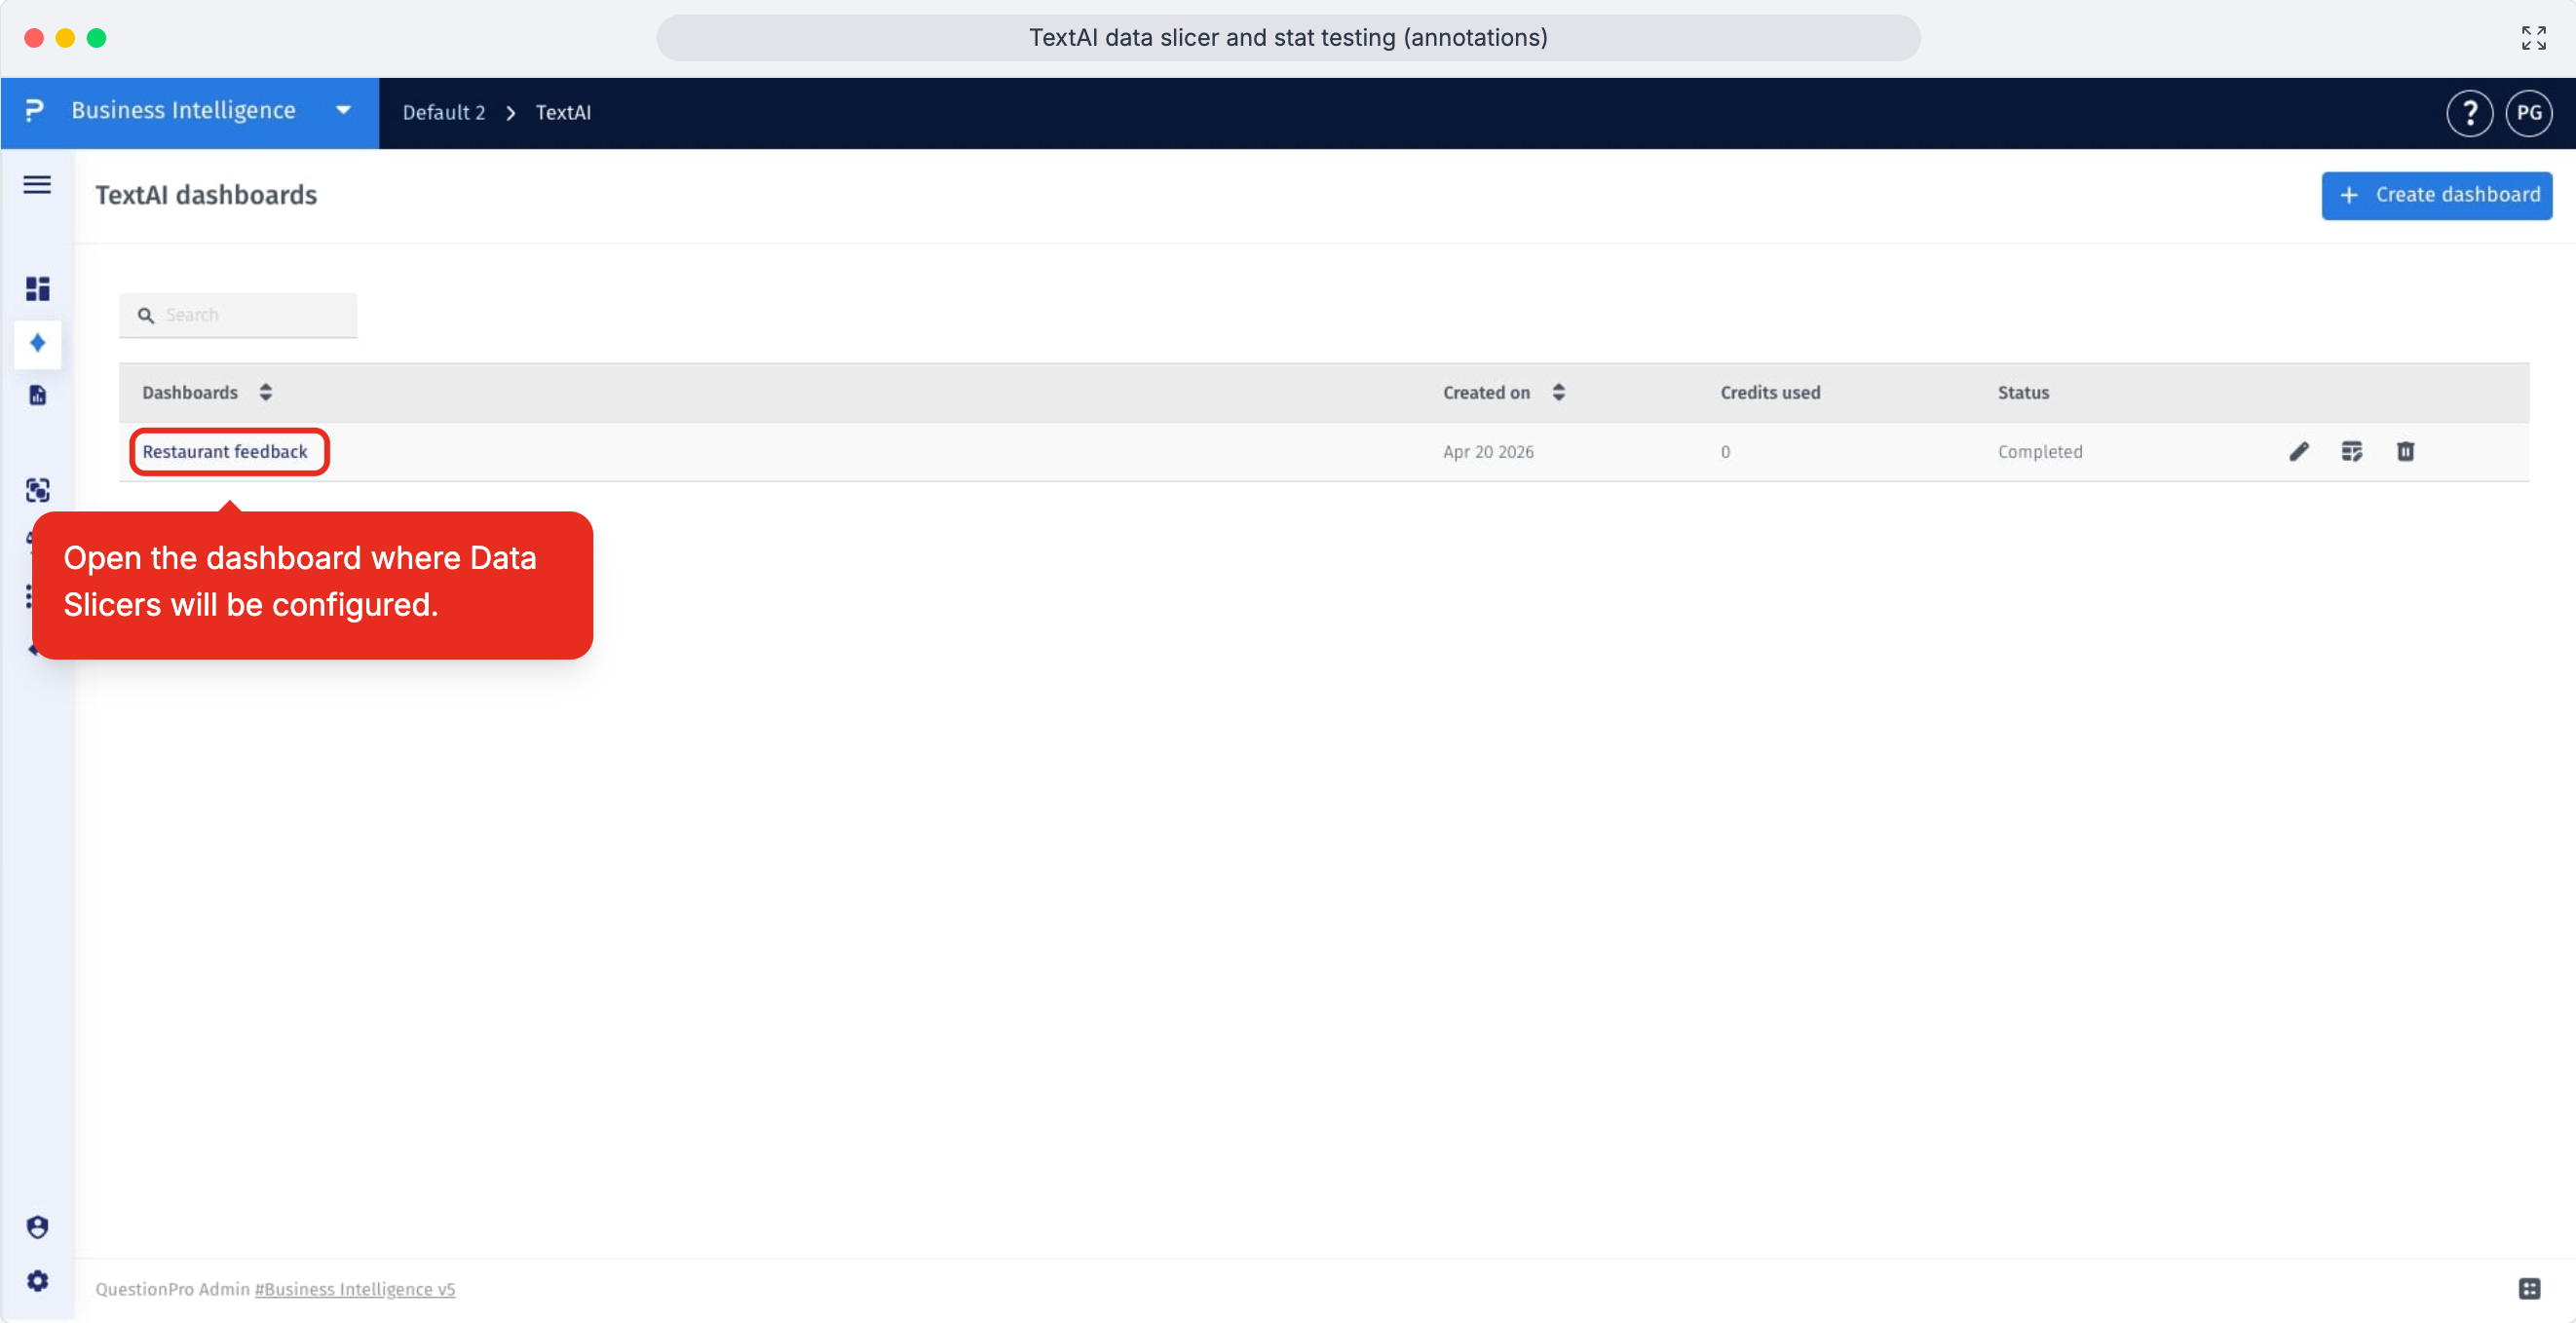
- Step 1: Open the TextAI dashboard where you want to create Data Slicers and compare responses across audience segments.
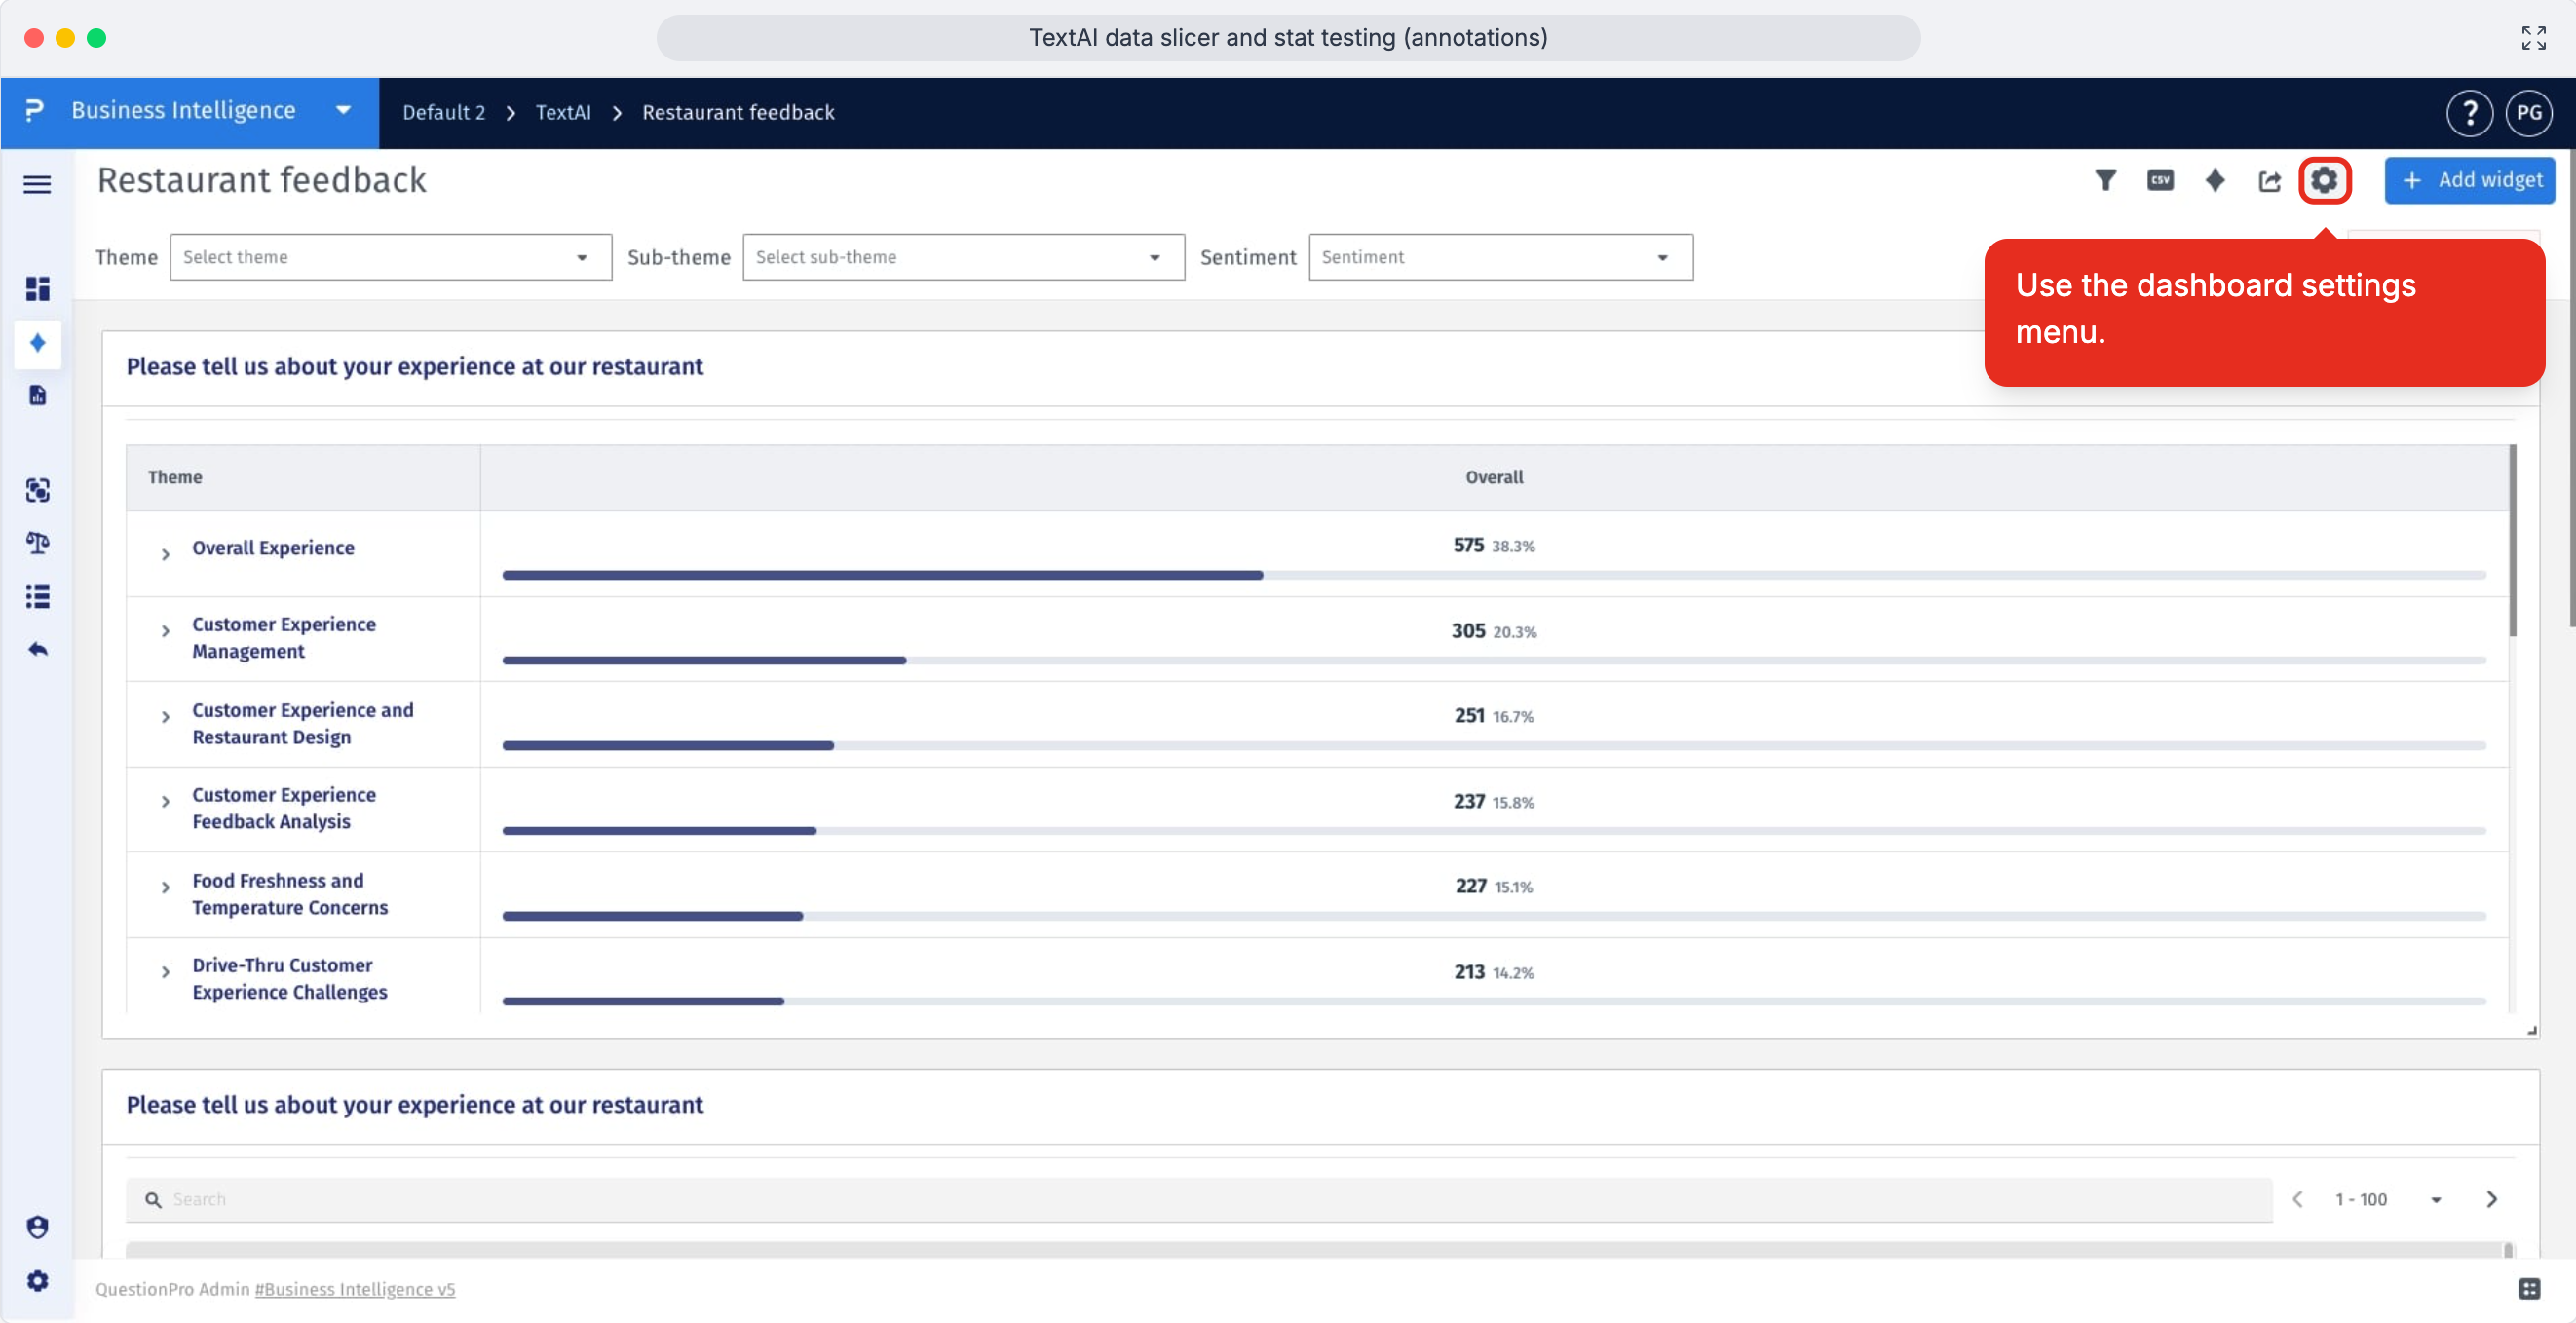
- Step 2: Click the settings icon in the top-right corner of the dashboard to open dashboard configuration options.
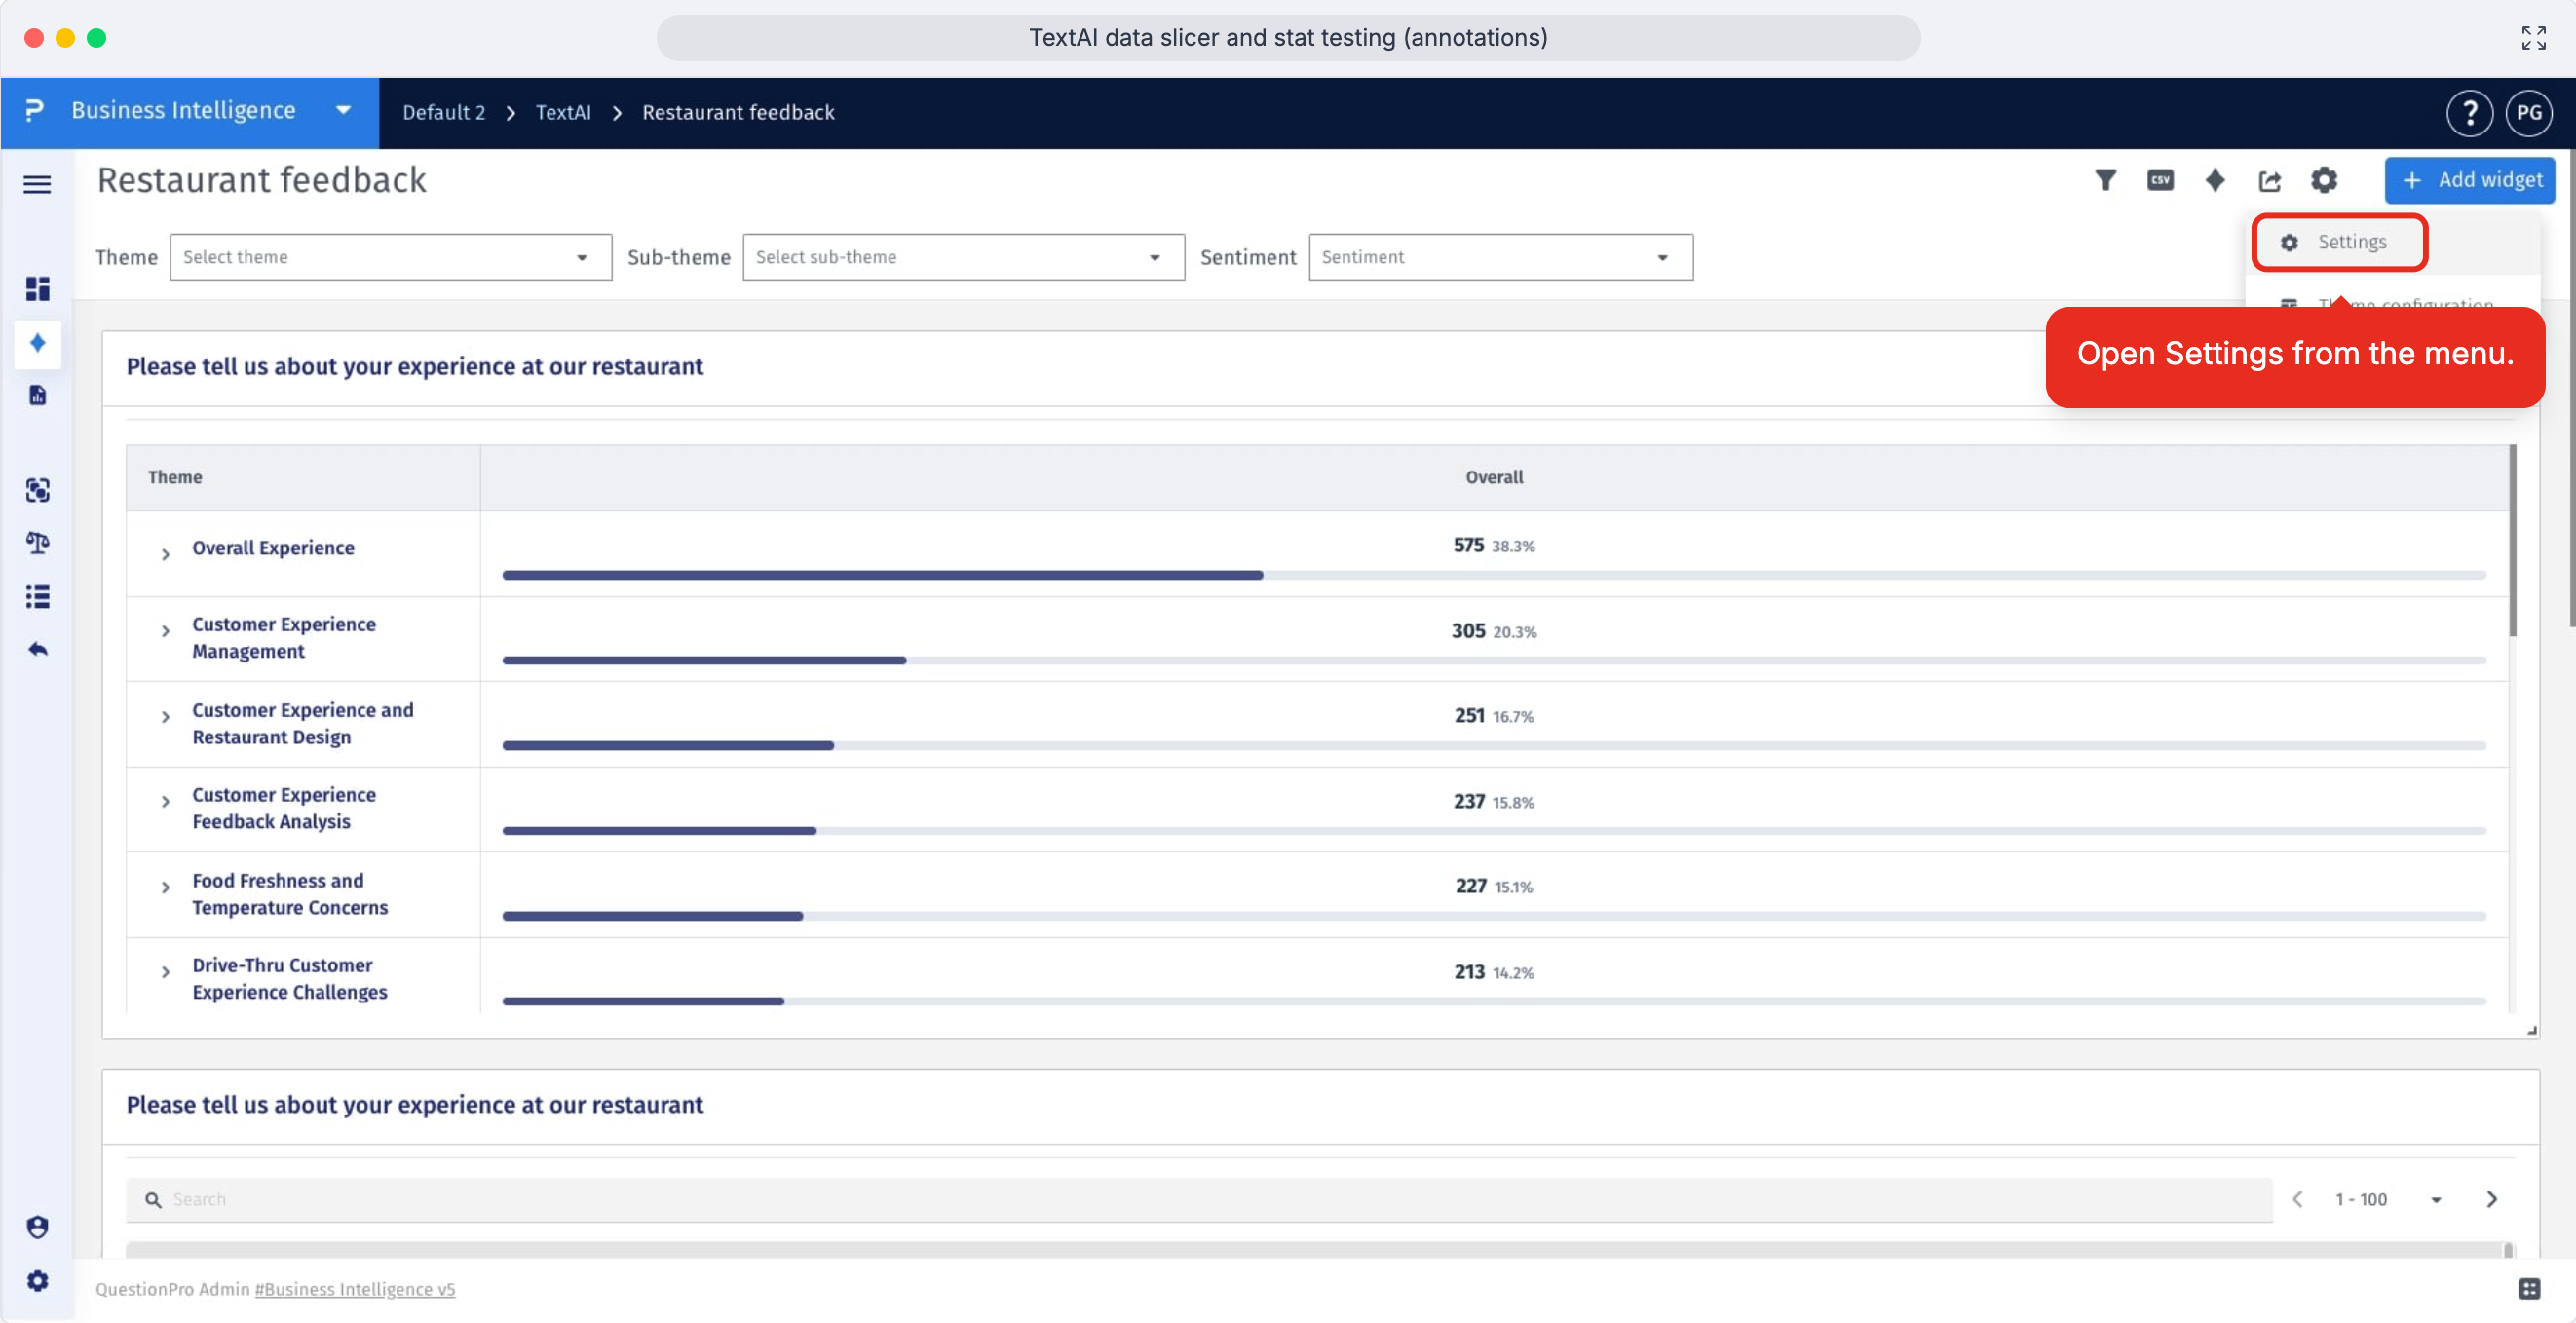
- Step 3: Select Settings from the menu to open the setup page for the dashboard.
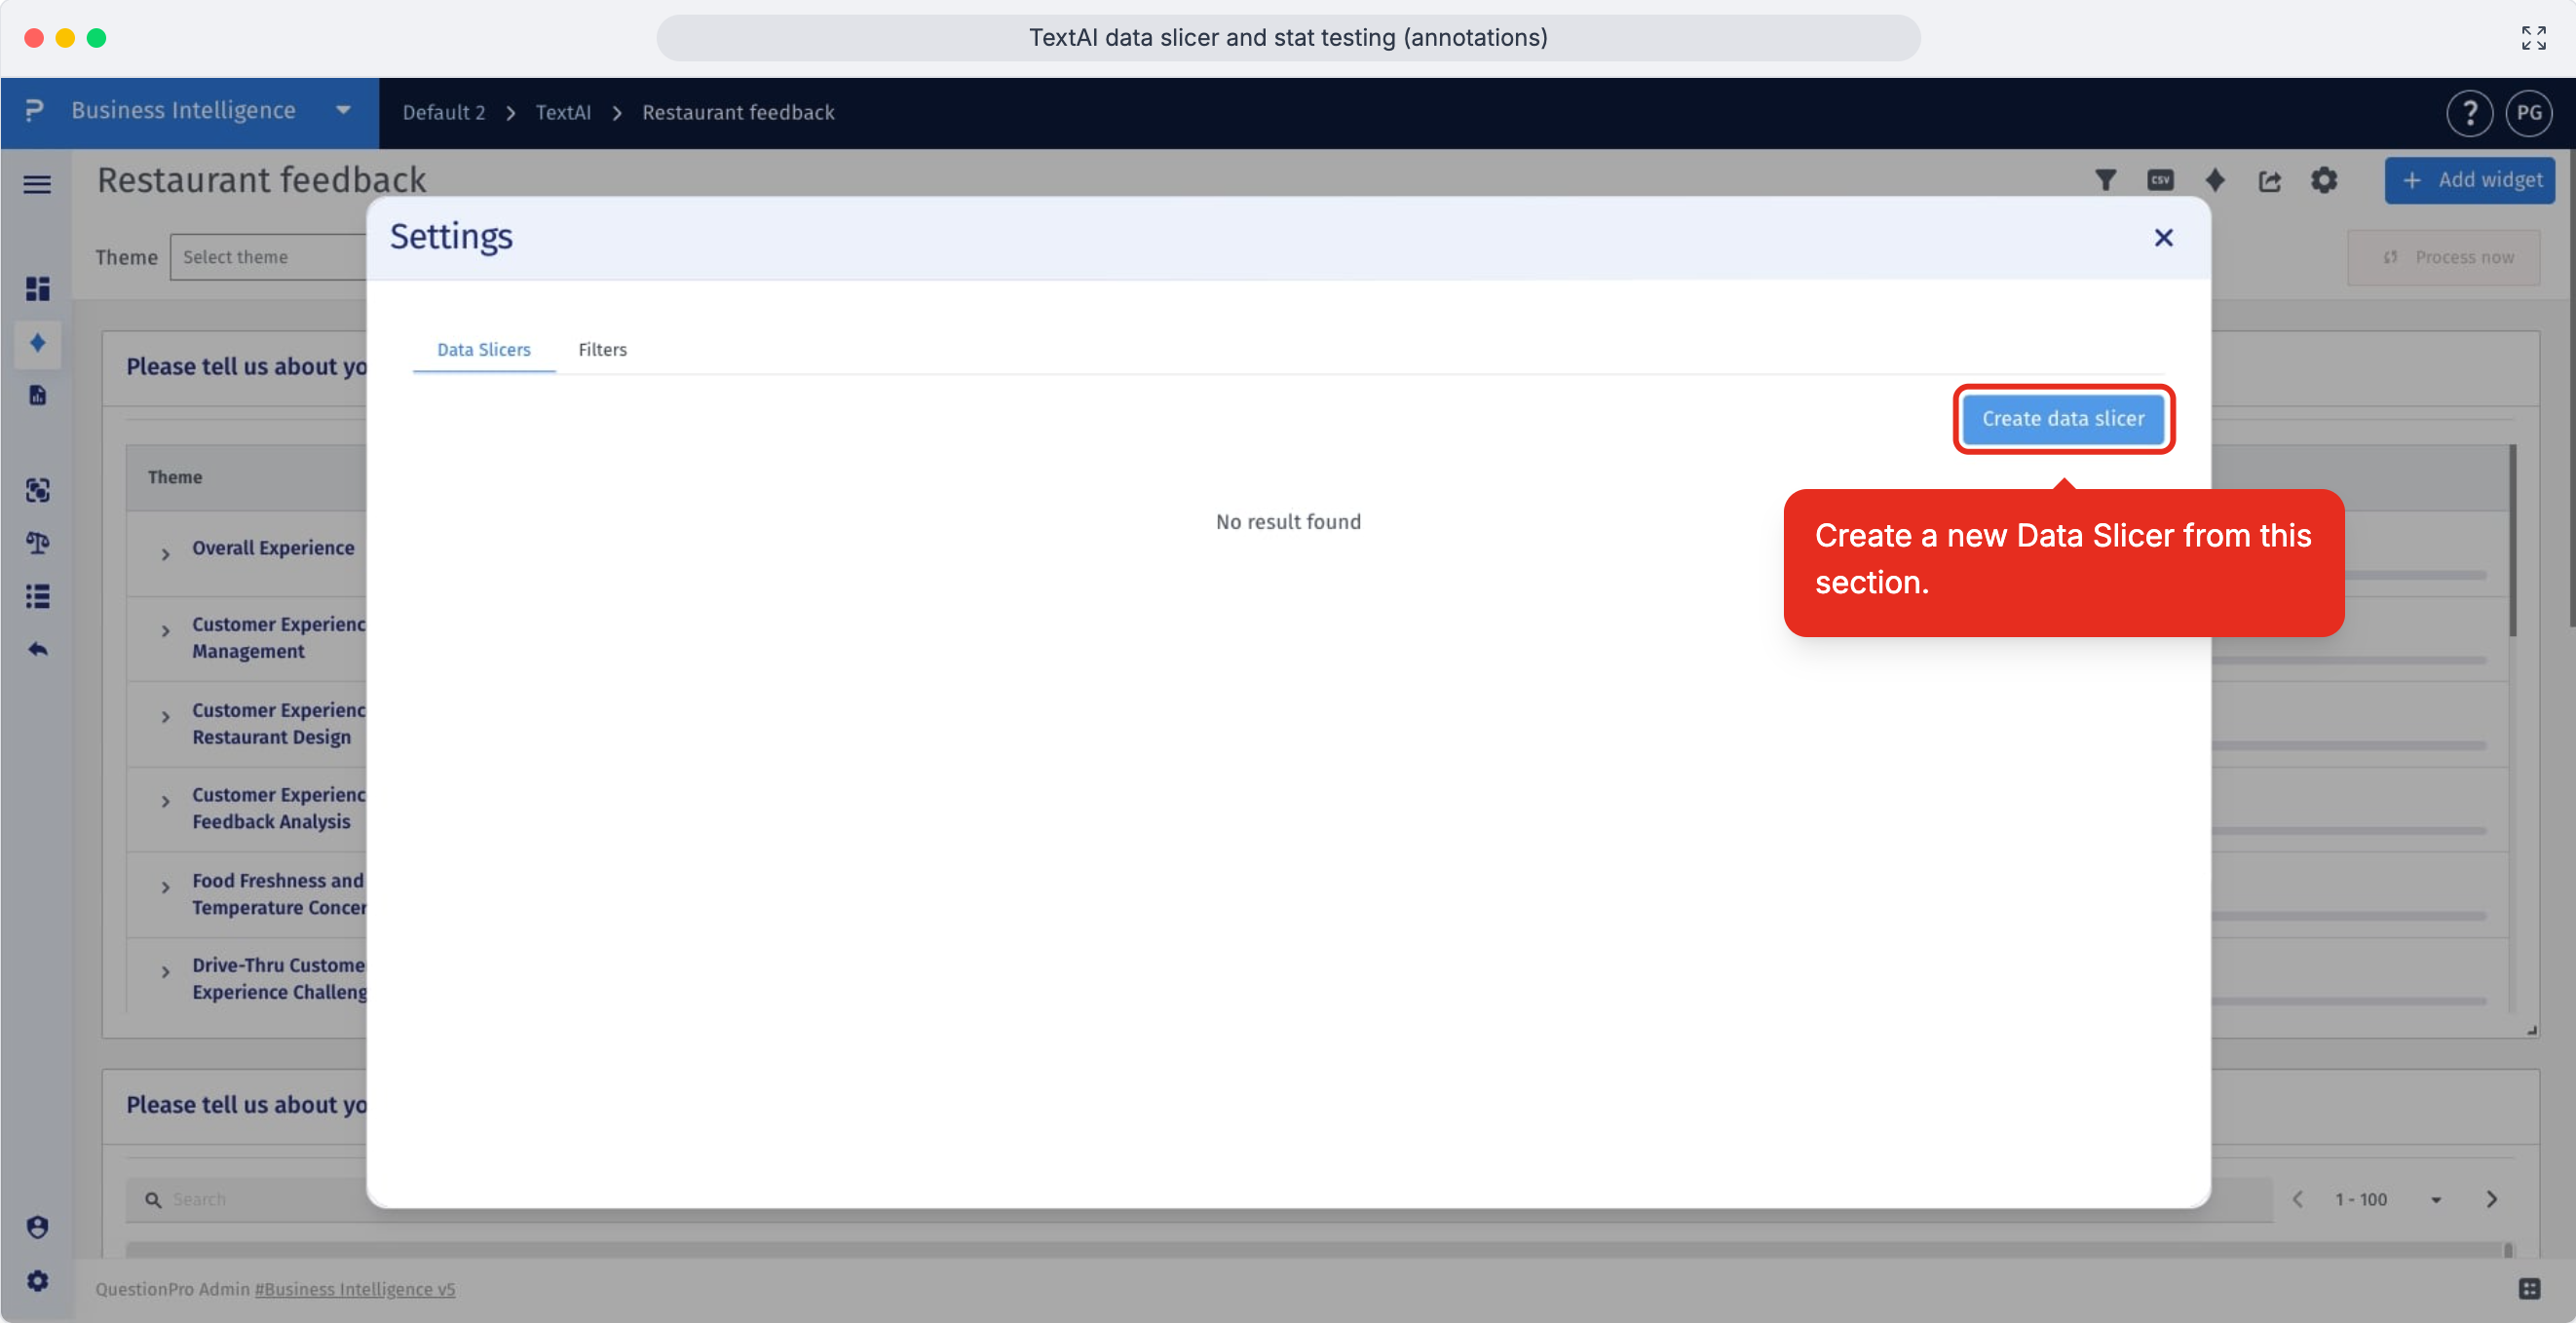
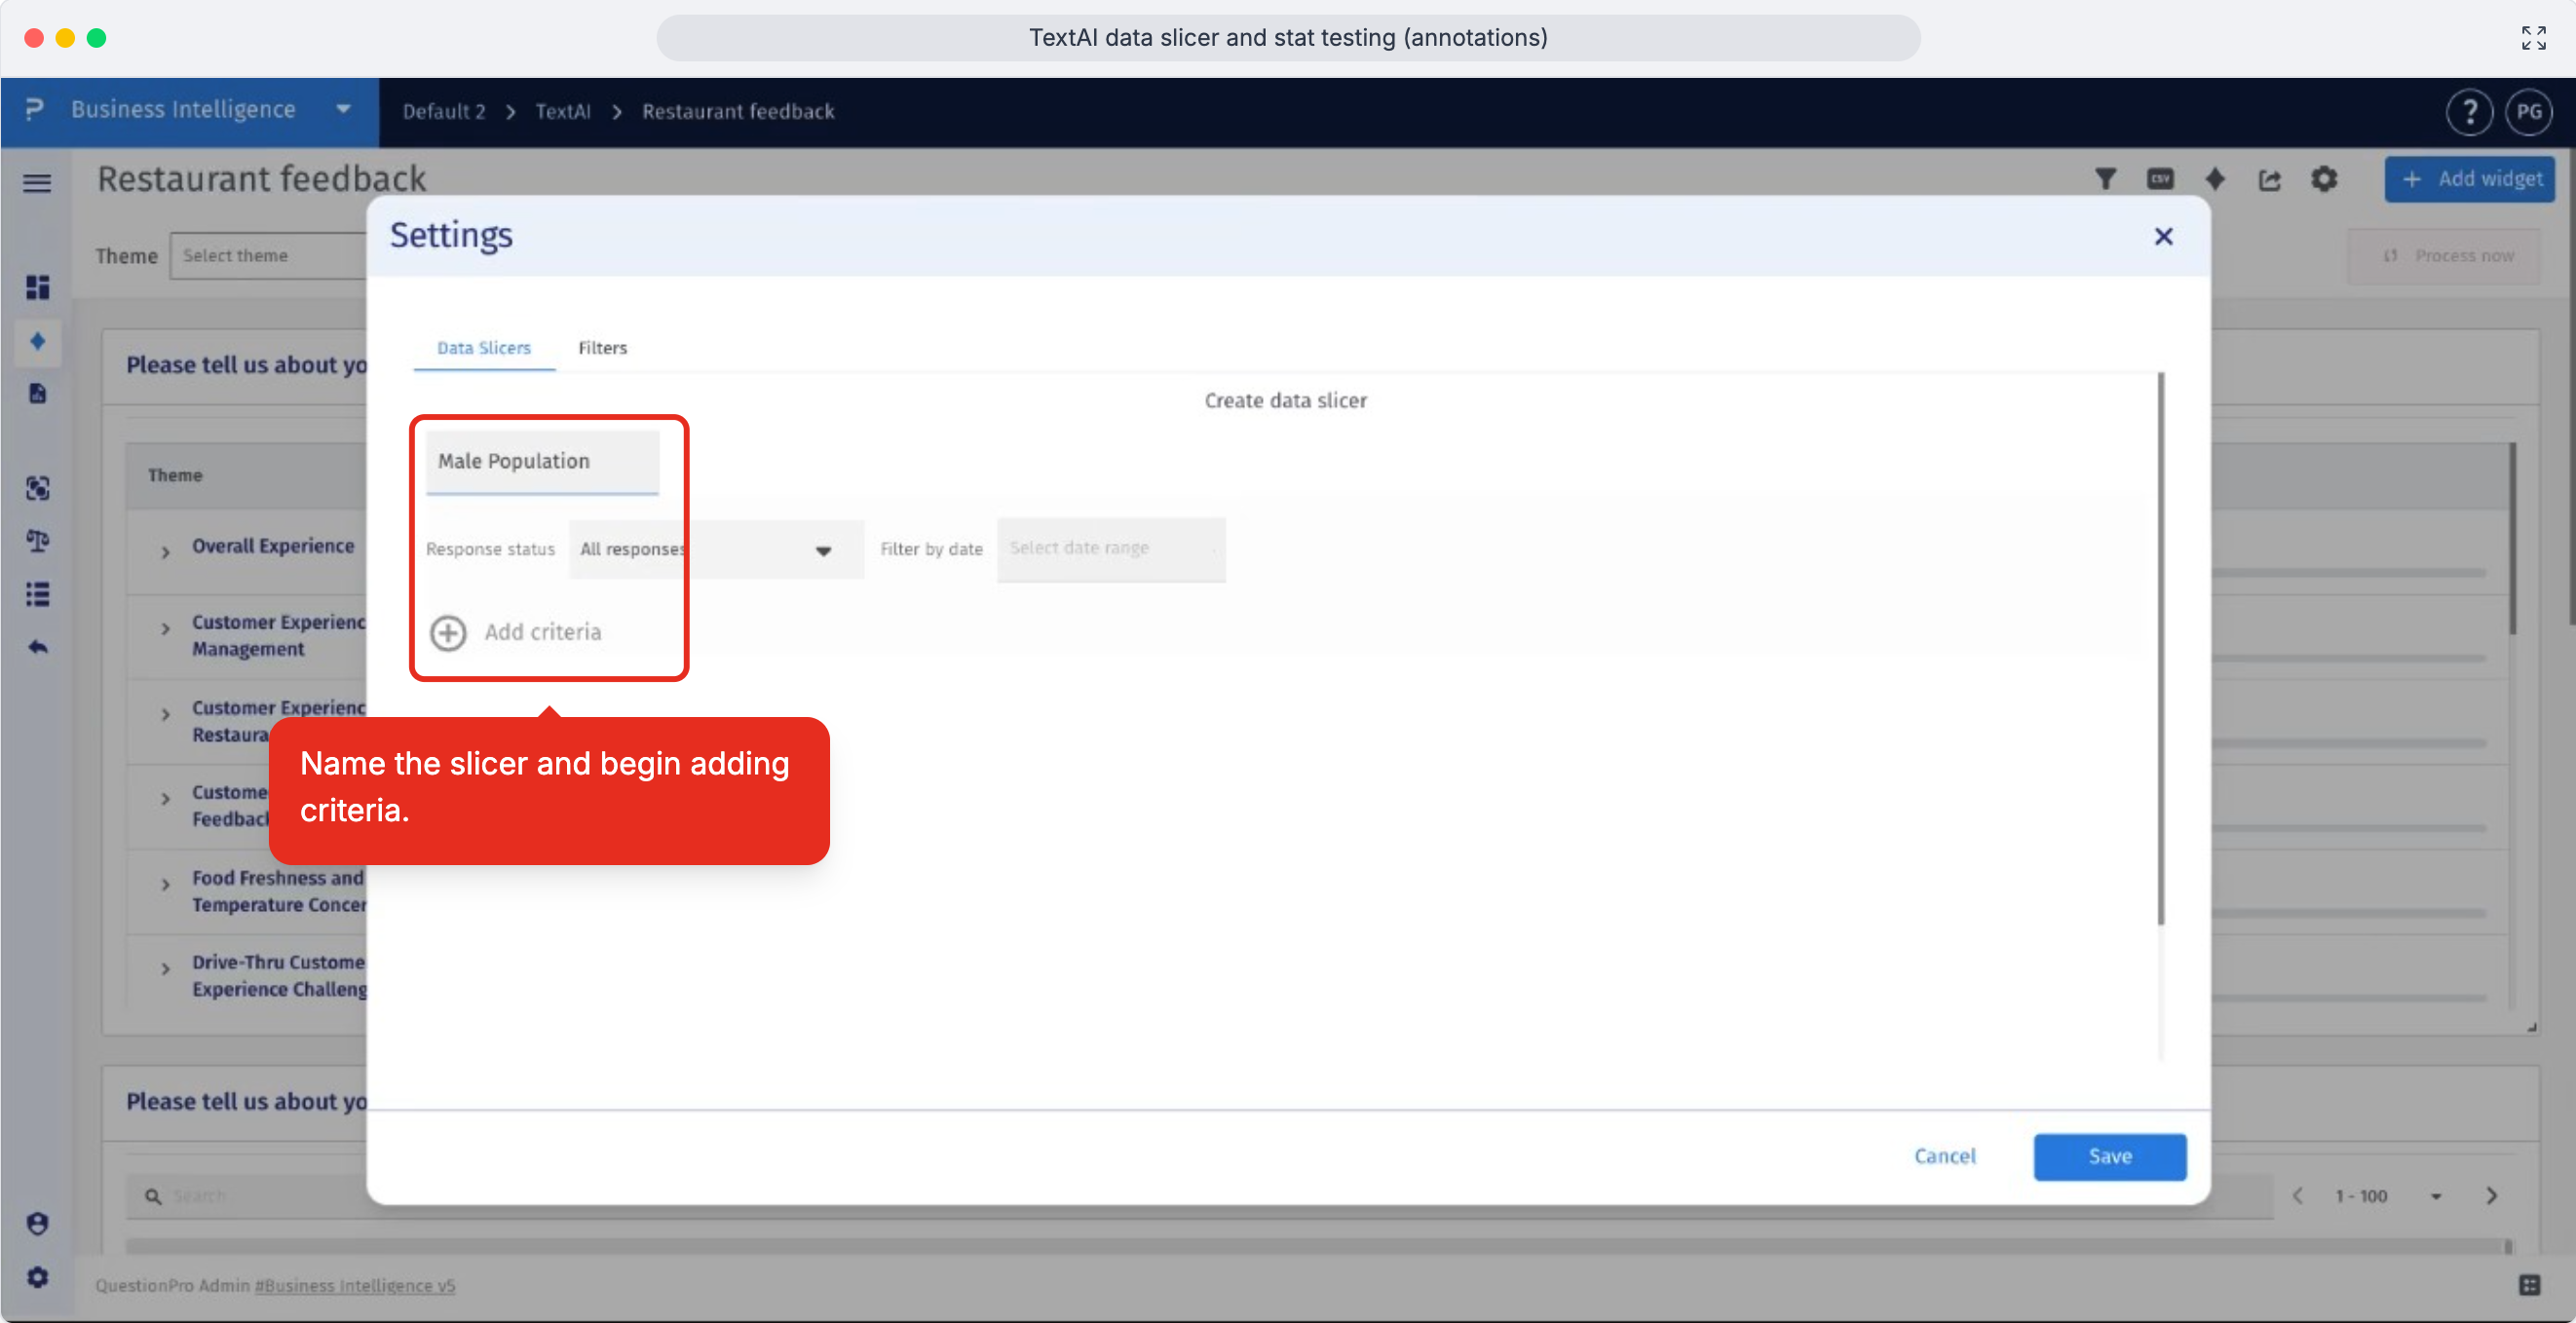
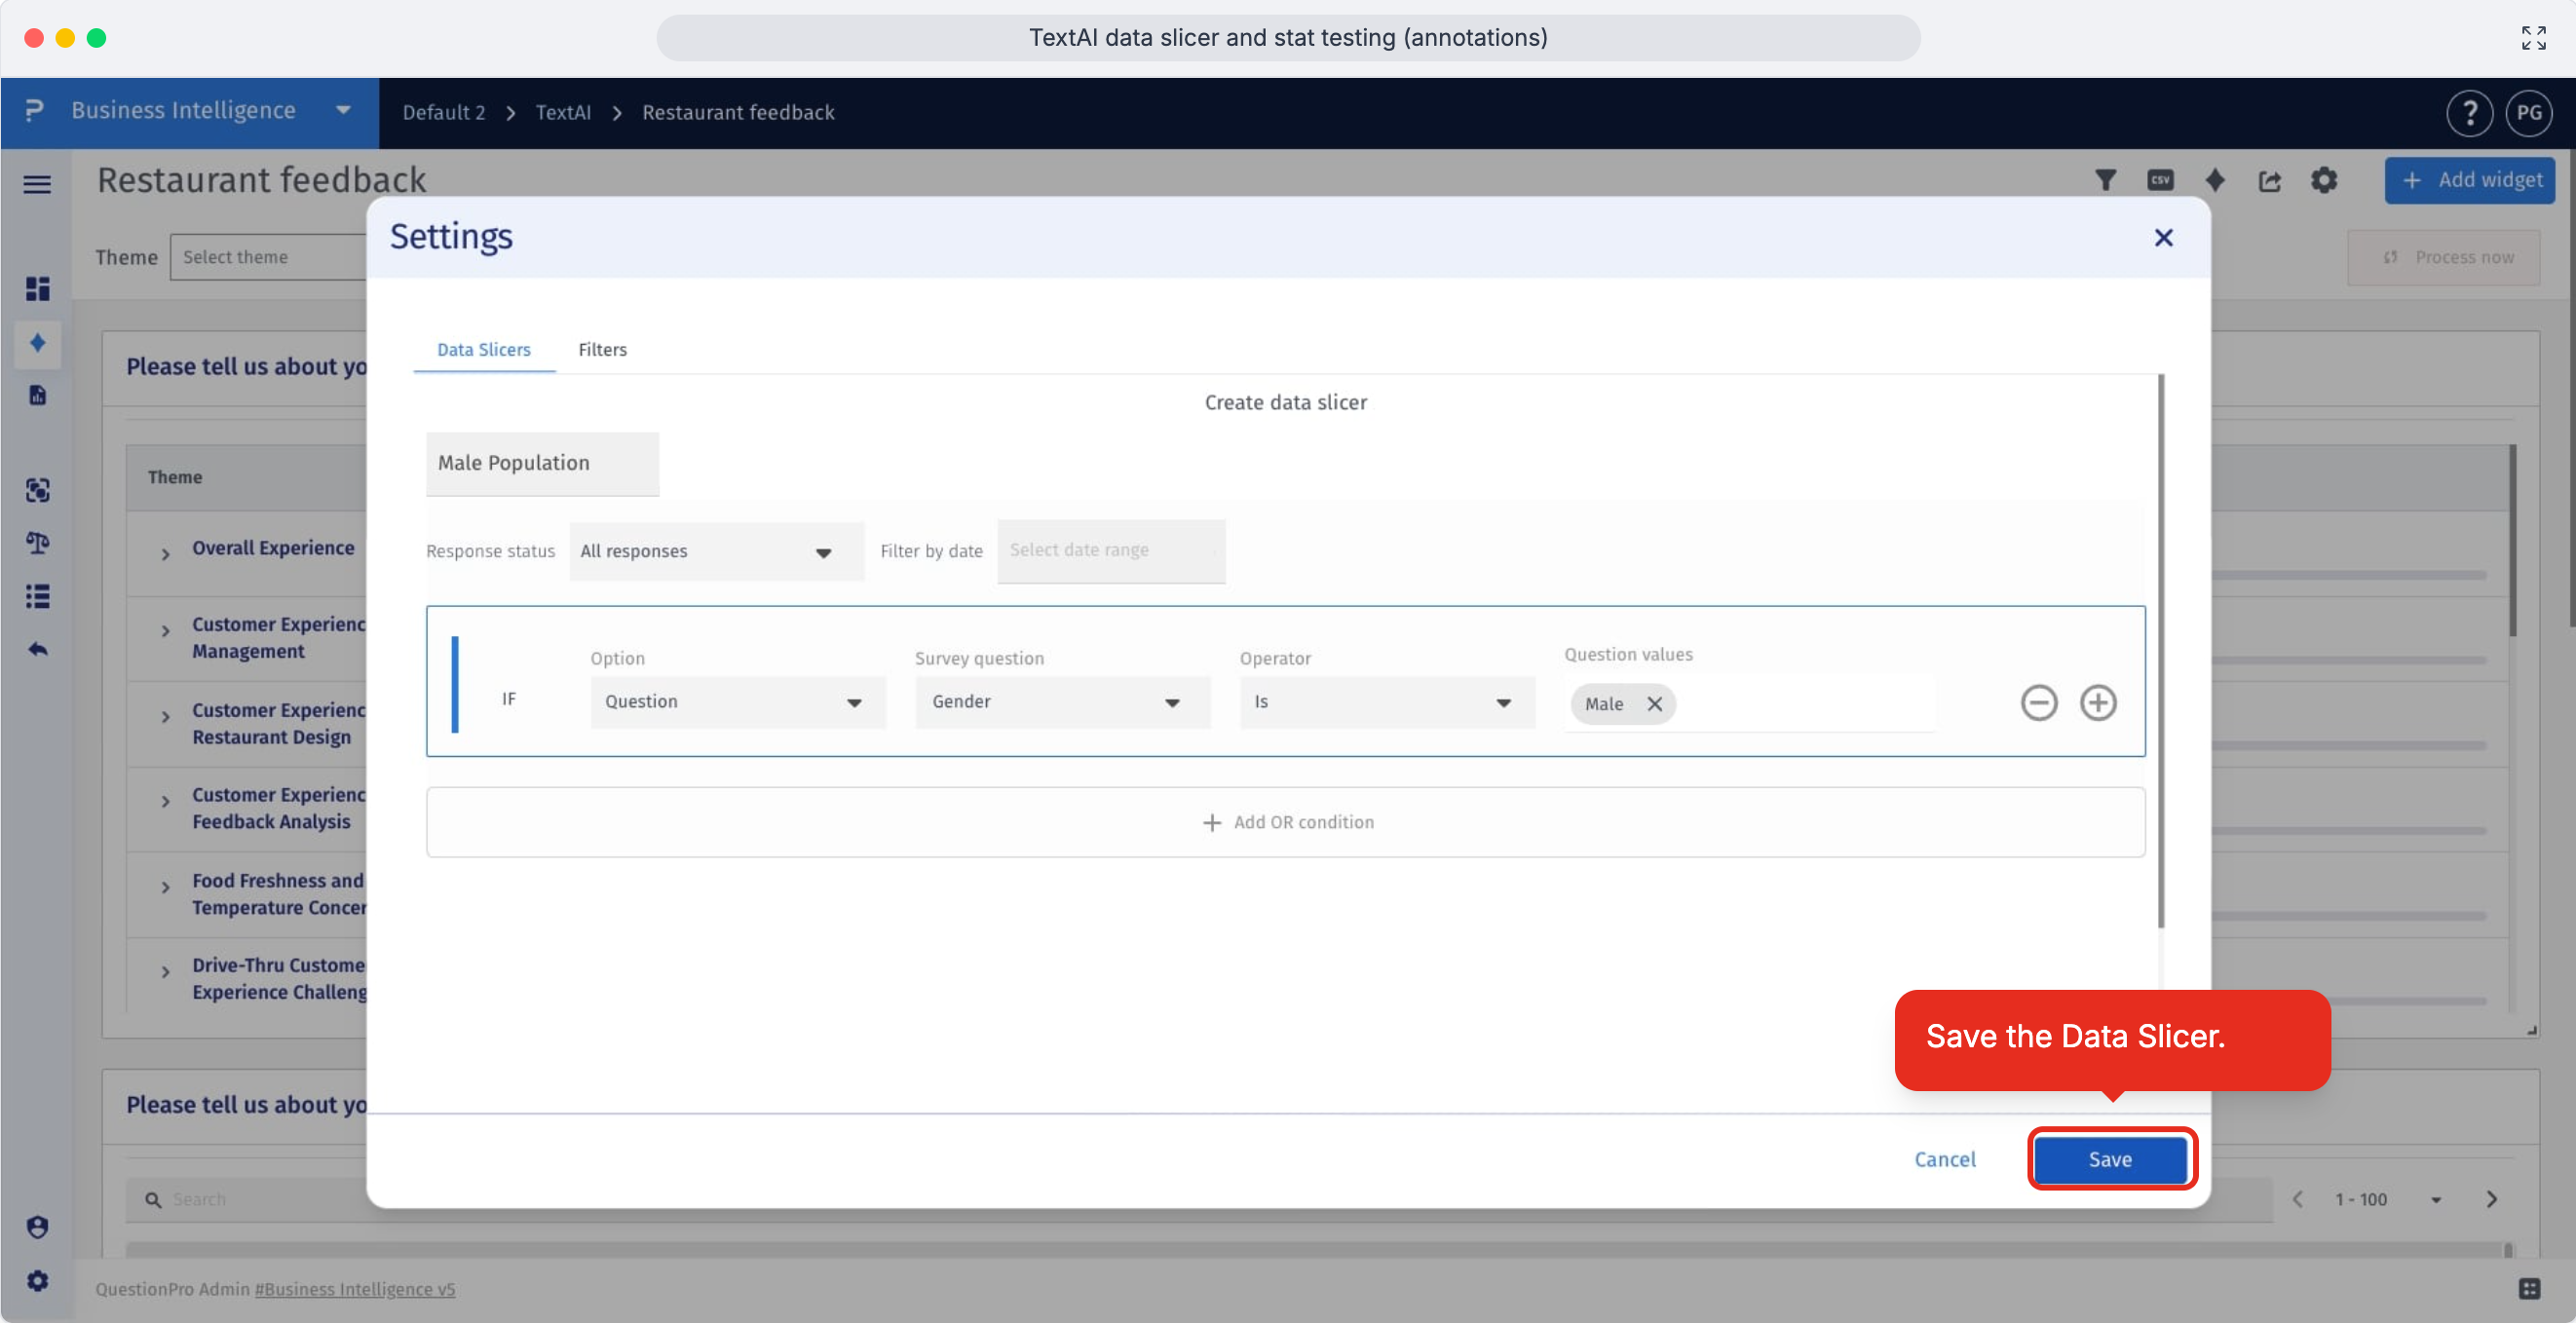
- Step 4: Click Create Data Slicer in the Data Slicers section to define the audience segment you want to analyze.
- Enter a clear name for the Data Slicer, then click Add Criteria to start building the segment rule.
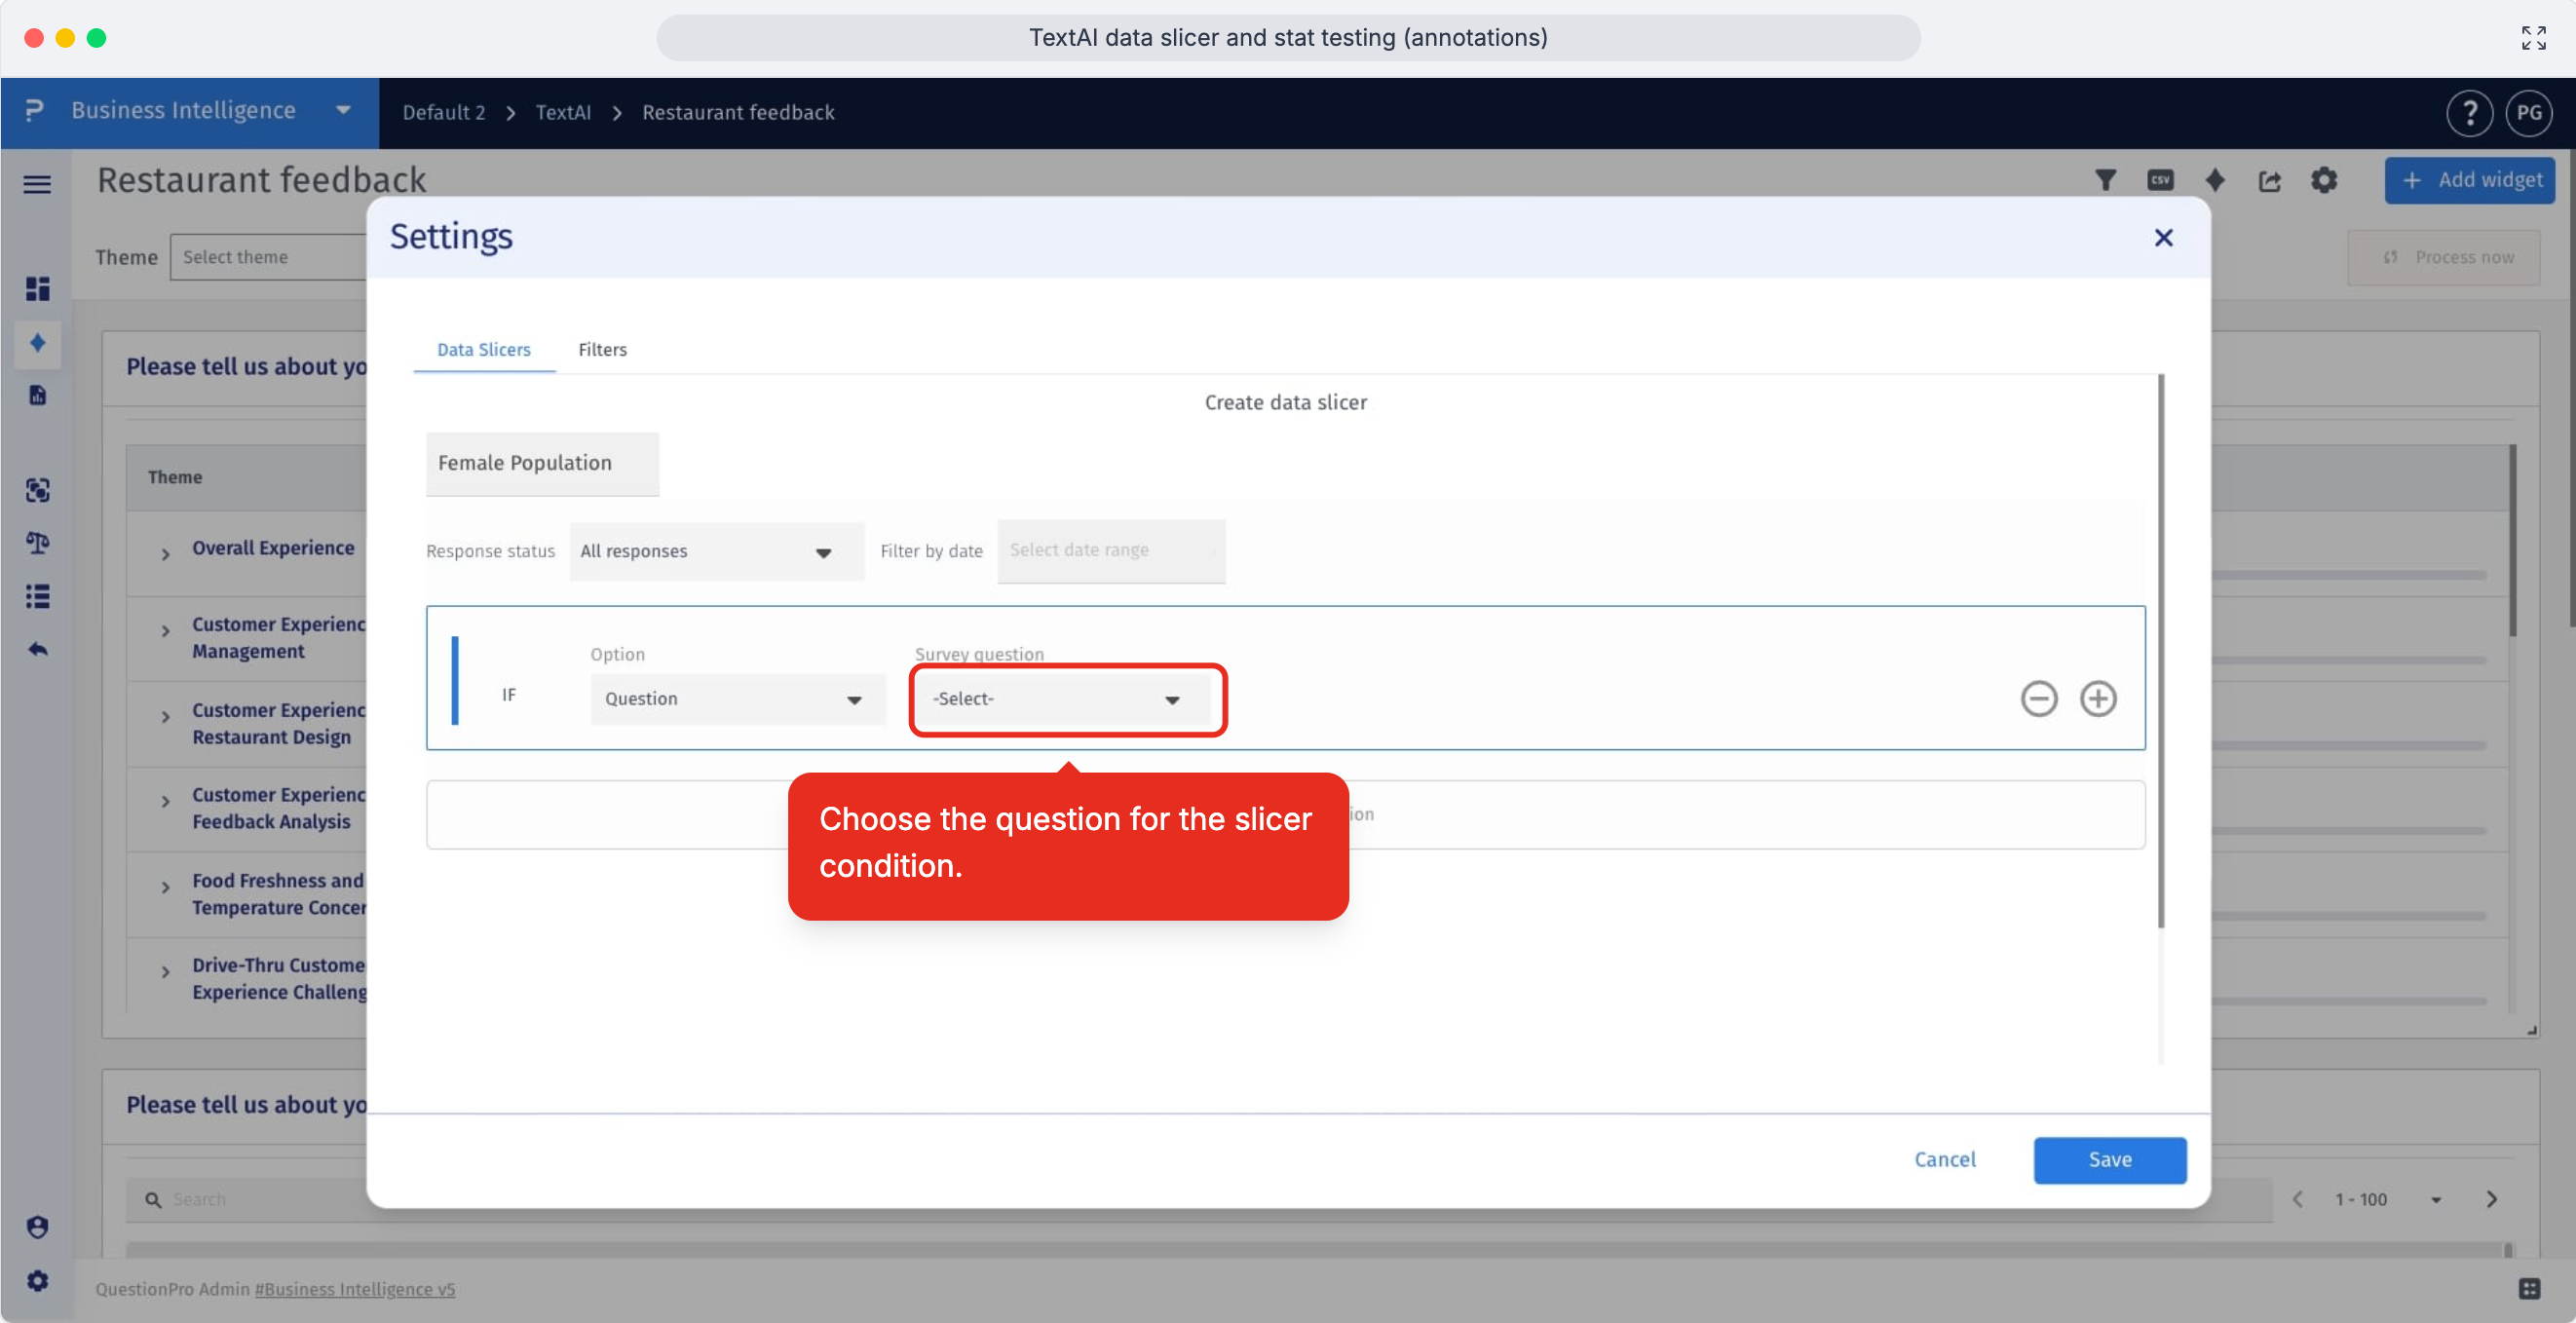
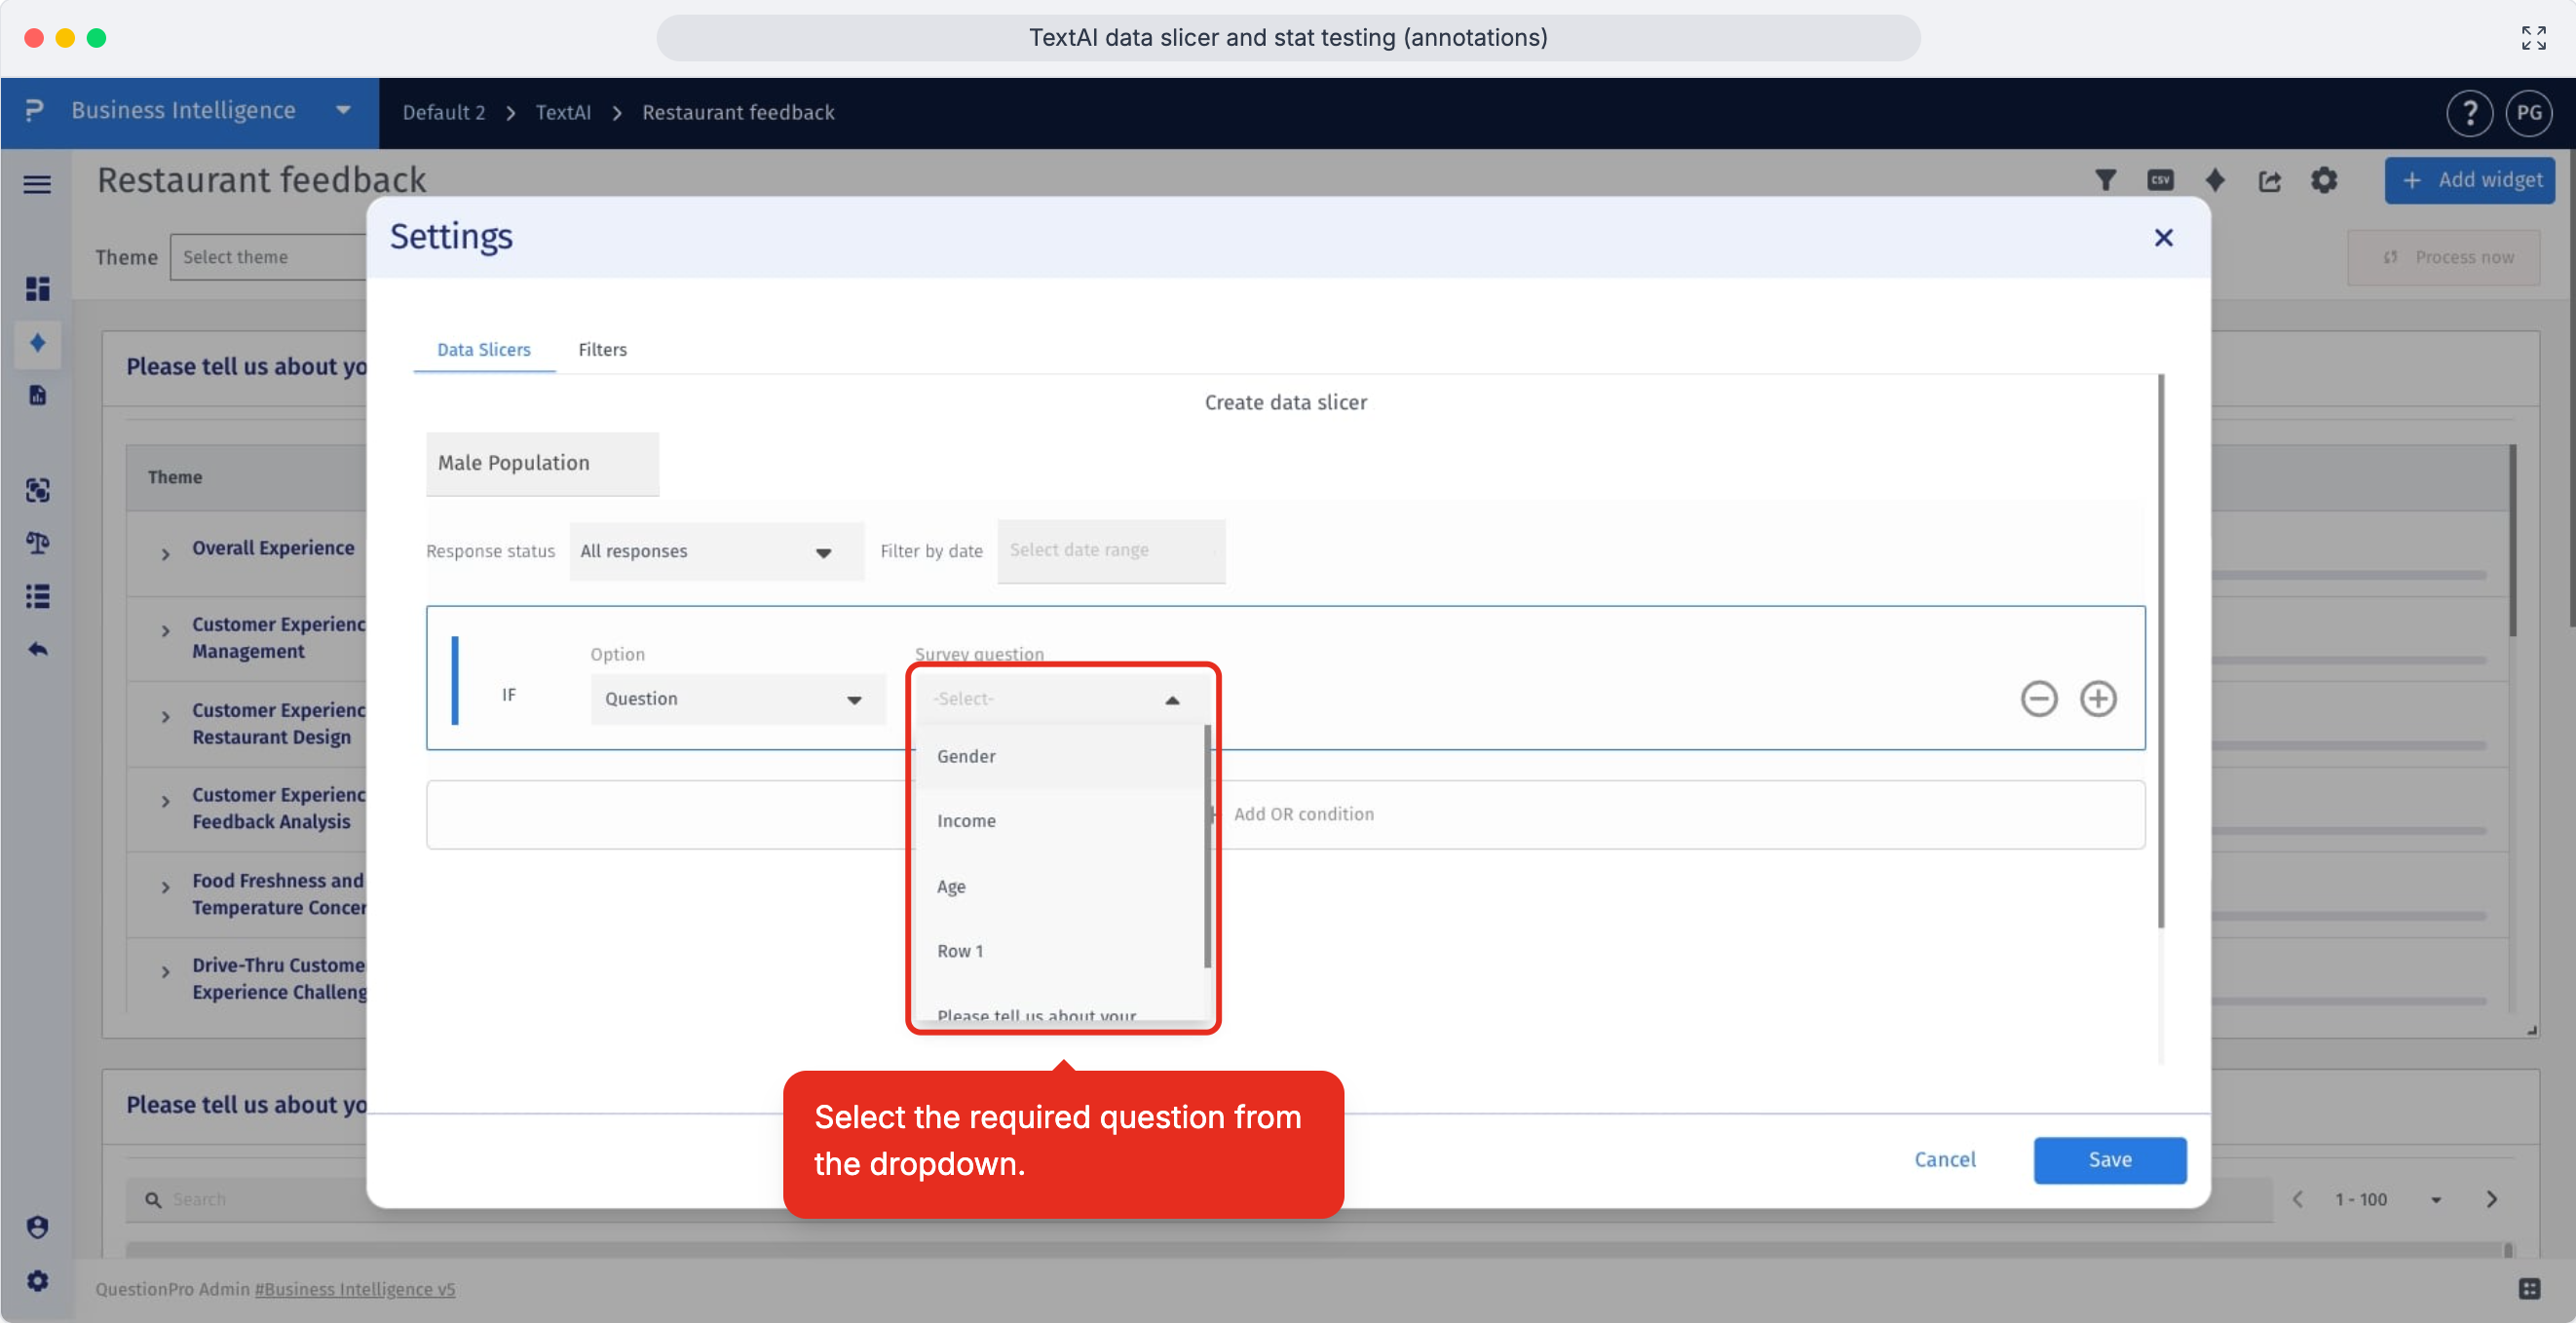
- Open the question dropdown to choose the survey question that should control the slicer condition.
- Select the question whose answers identify the respondent group you want to include in this Data Slicer.
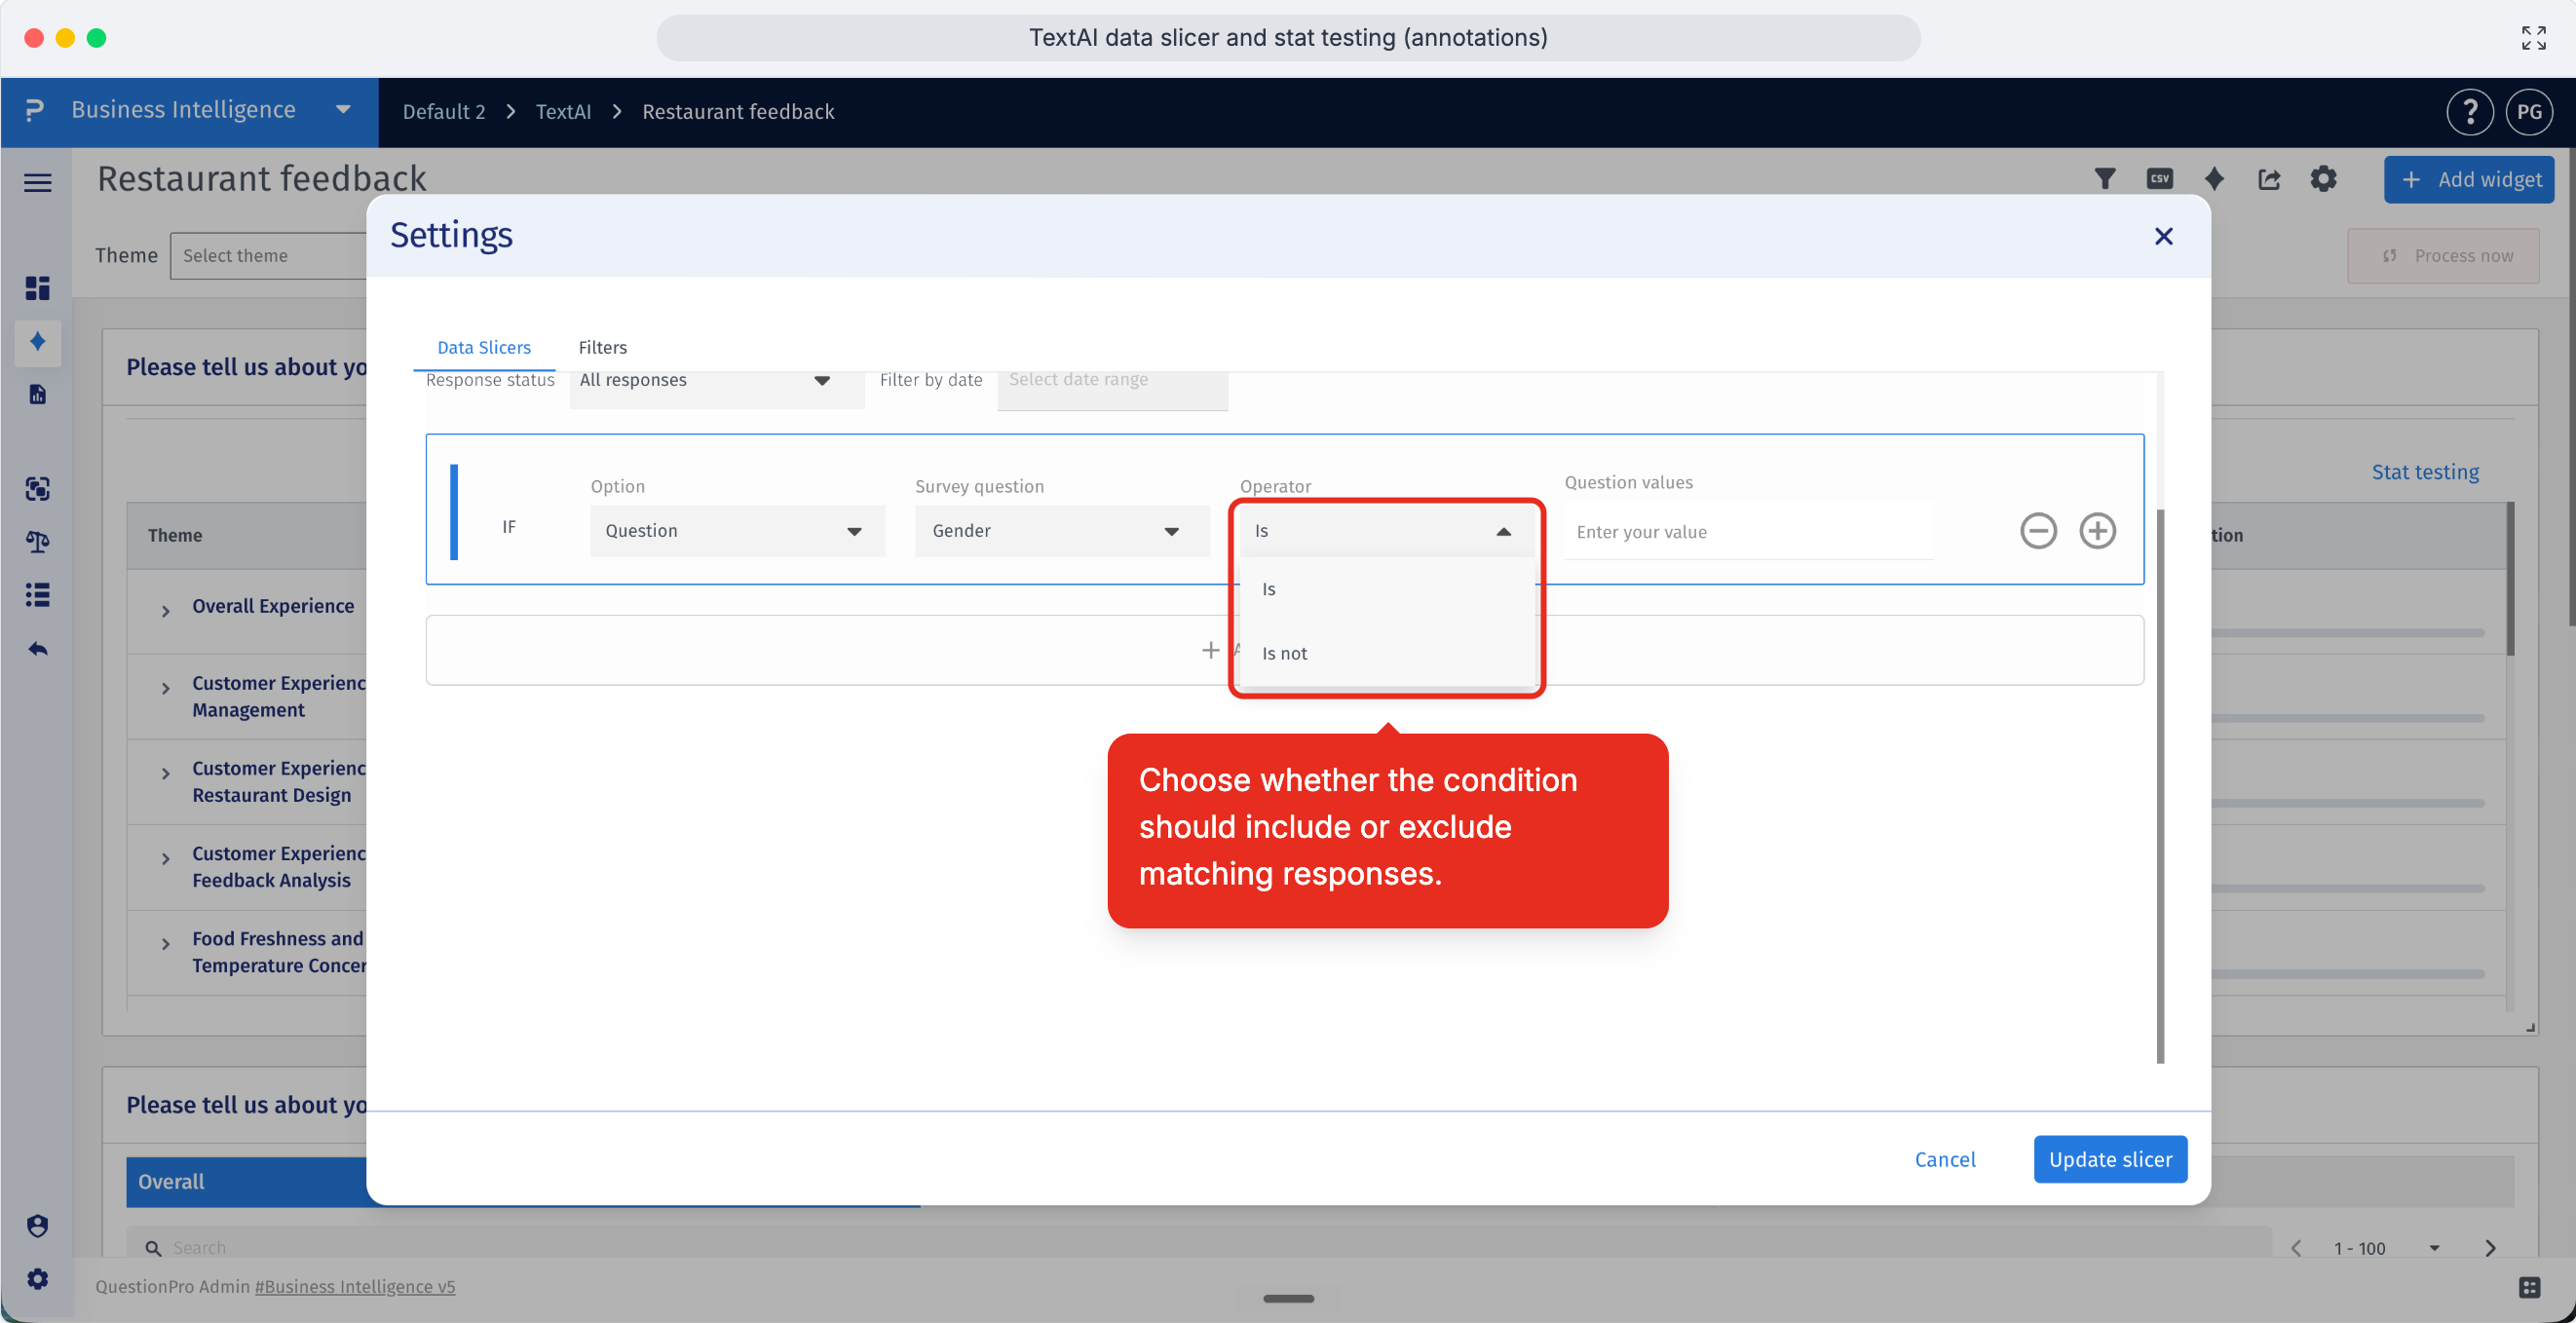
- Choose whether the condition should include or exclude responses that match the selected answer values.
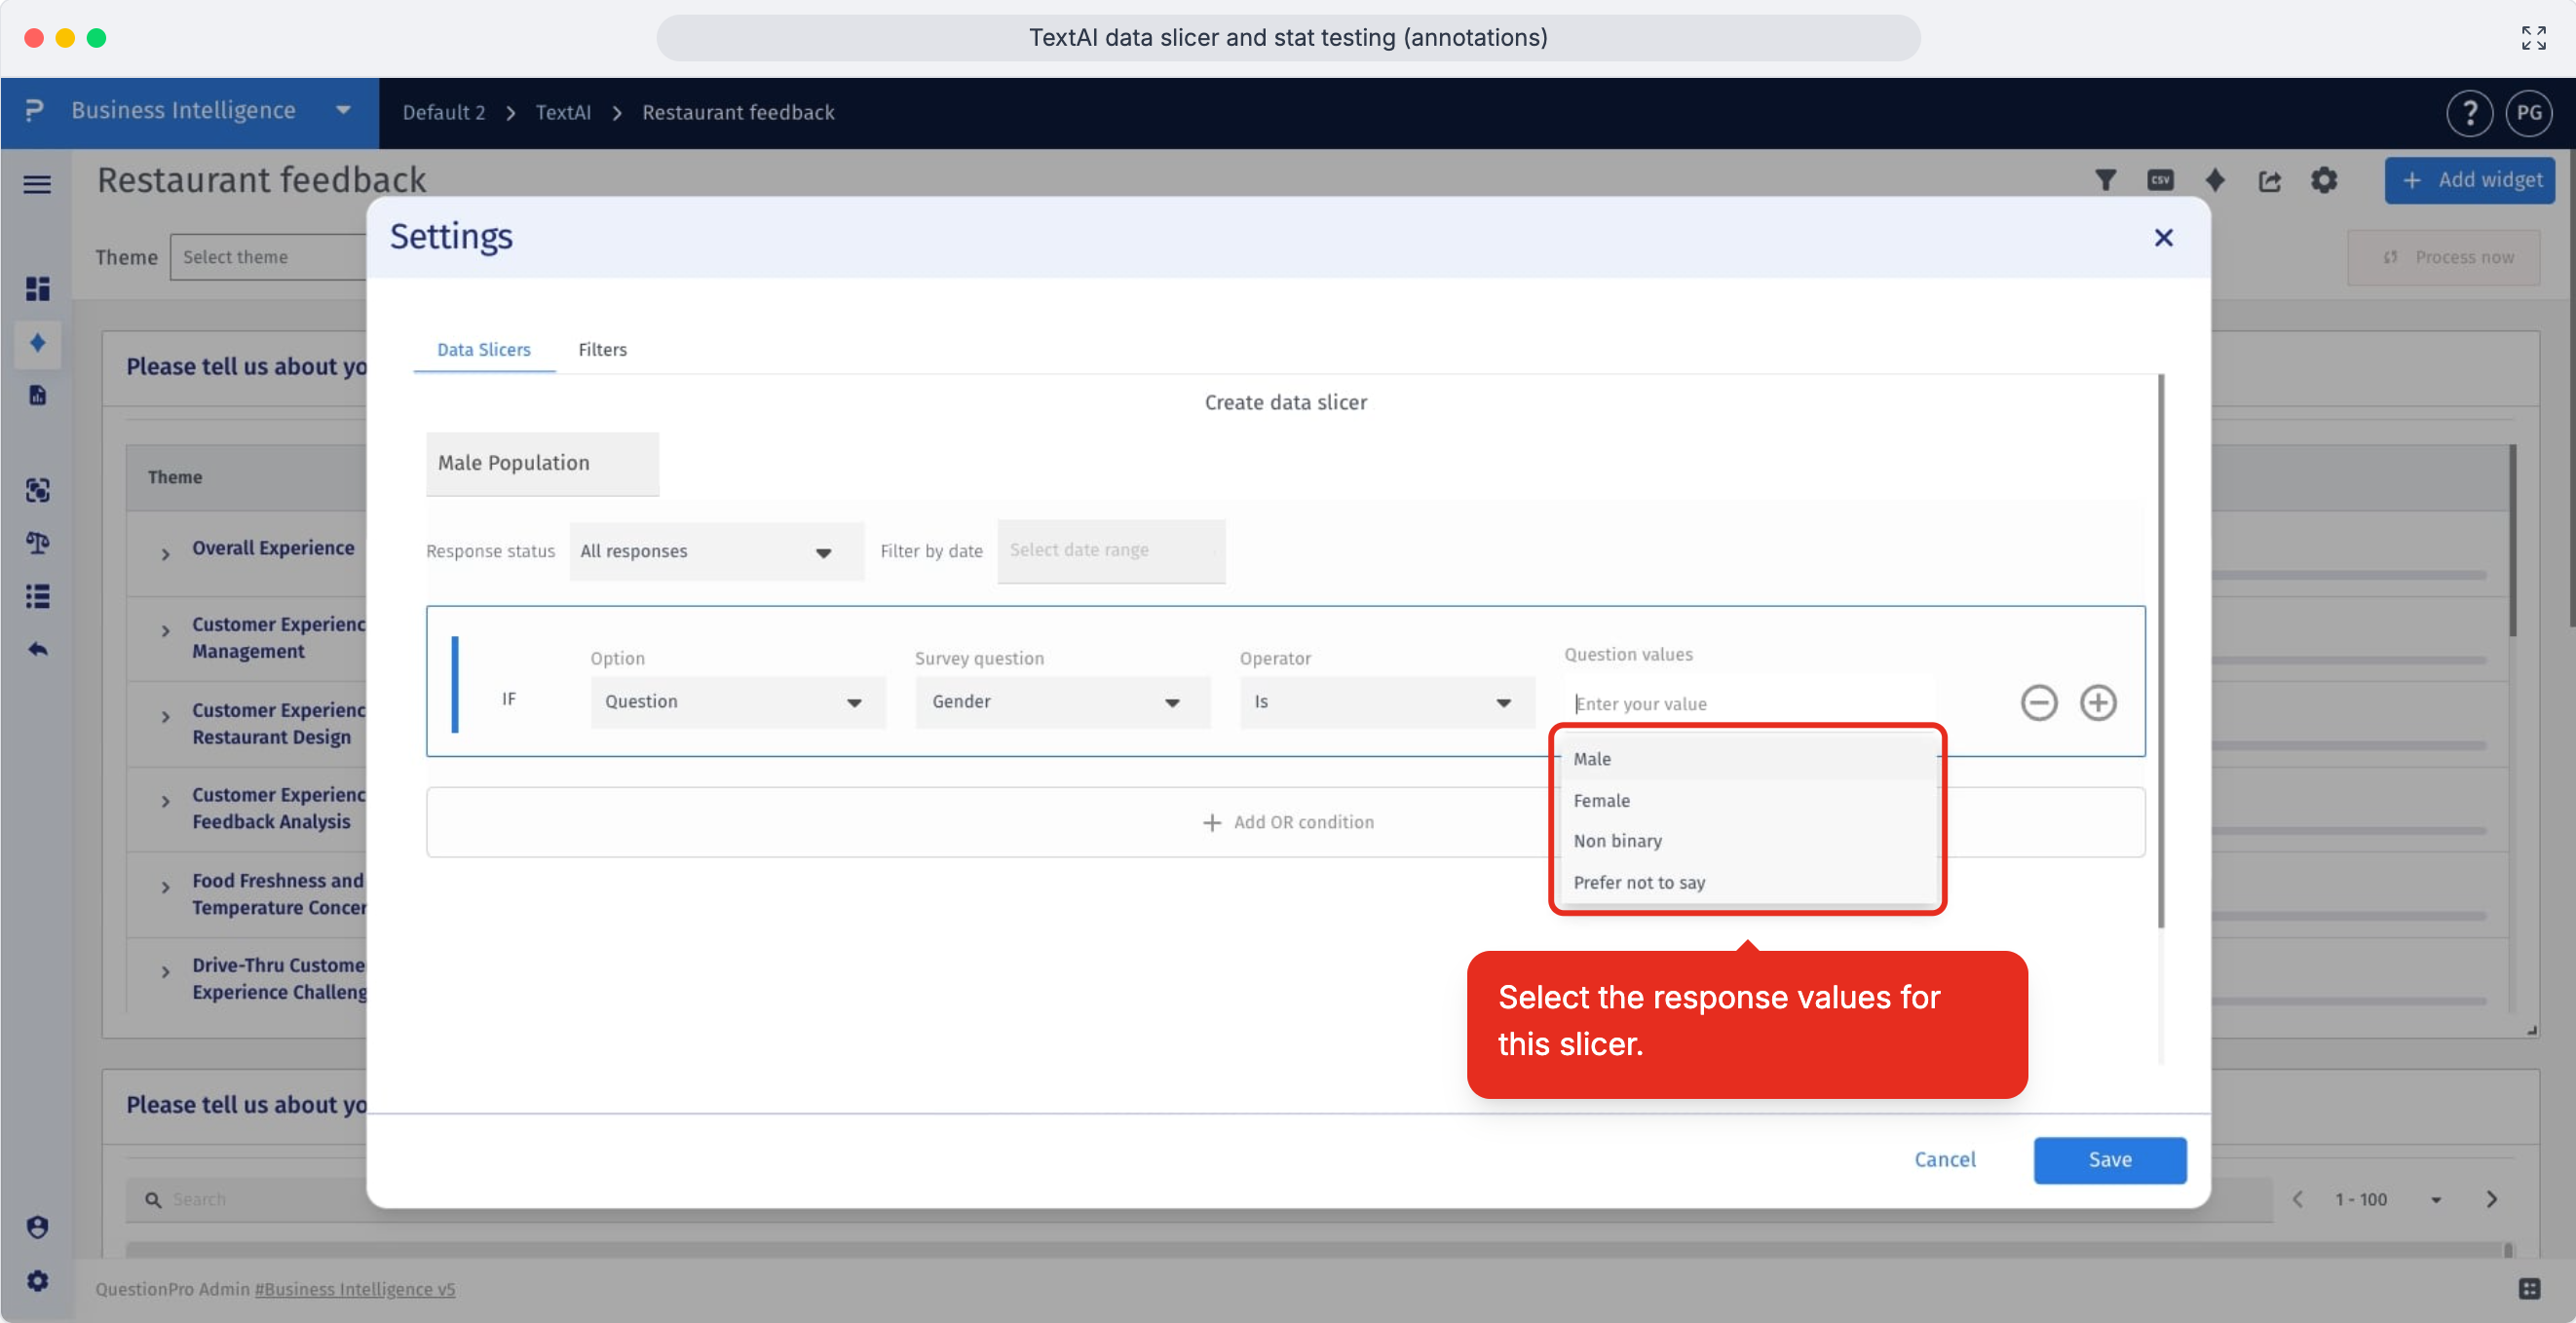
- Select the response values that define the segment, such as a specific region, role, rating, or demographic group.
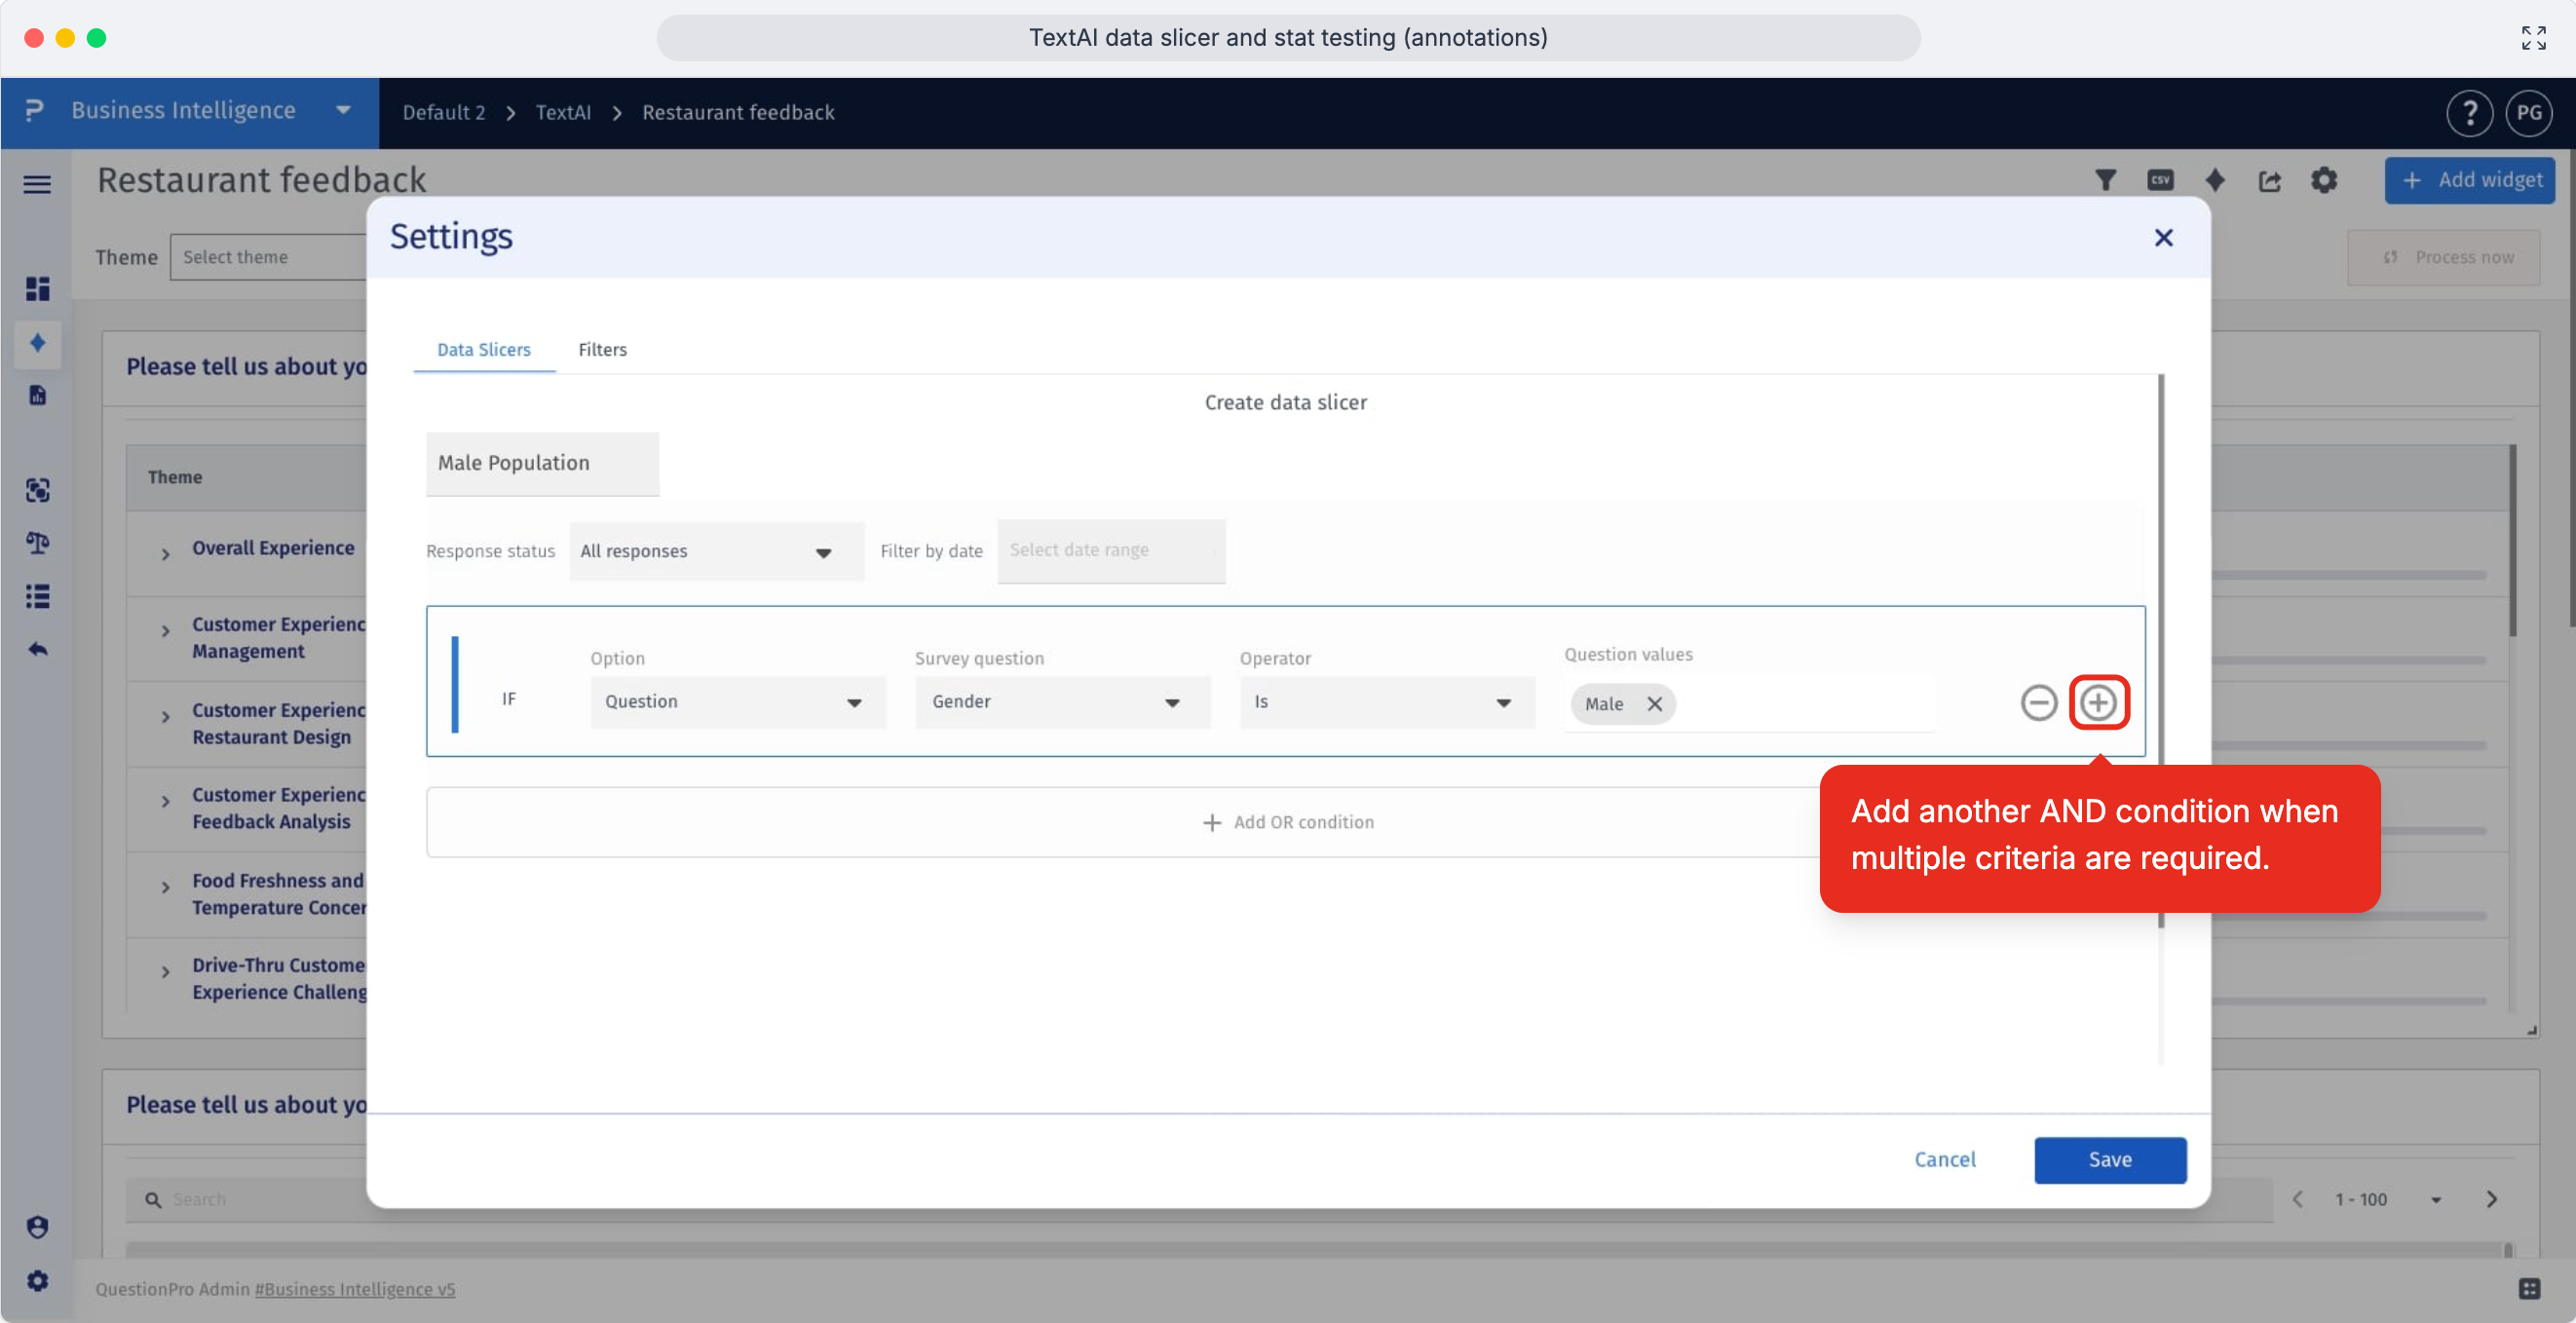
- Use the plus icon when the segment needs another condition that must also be true.
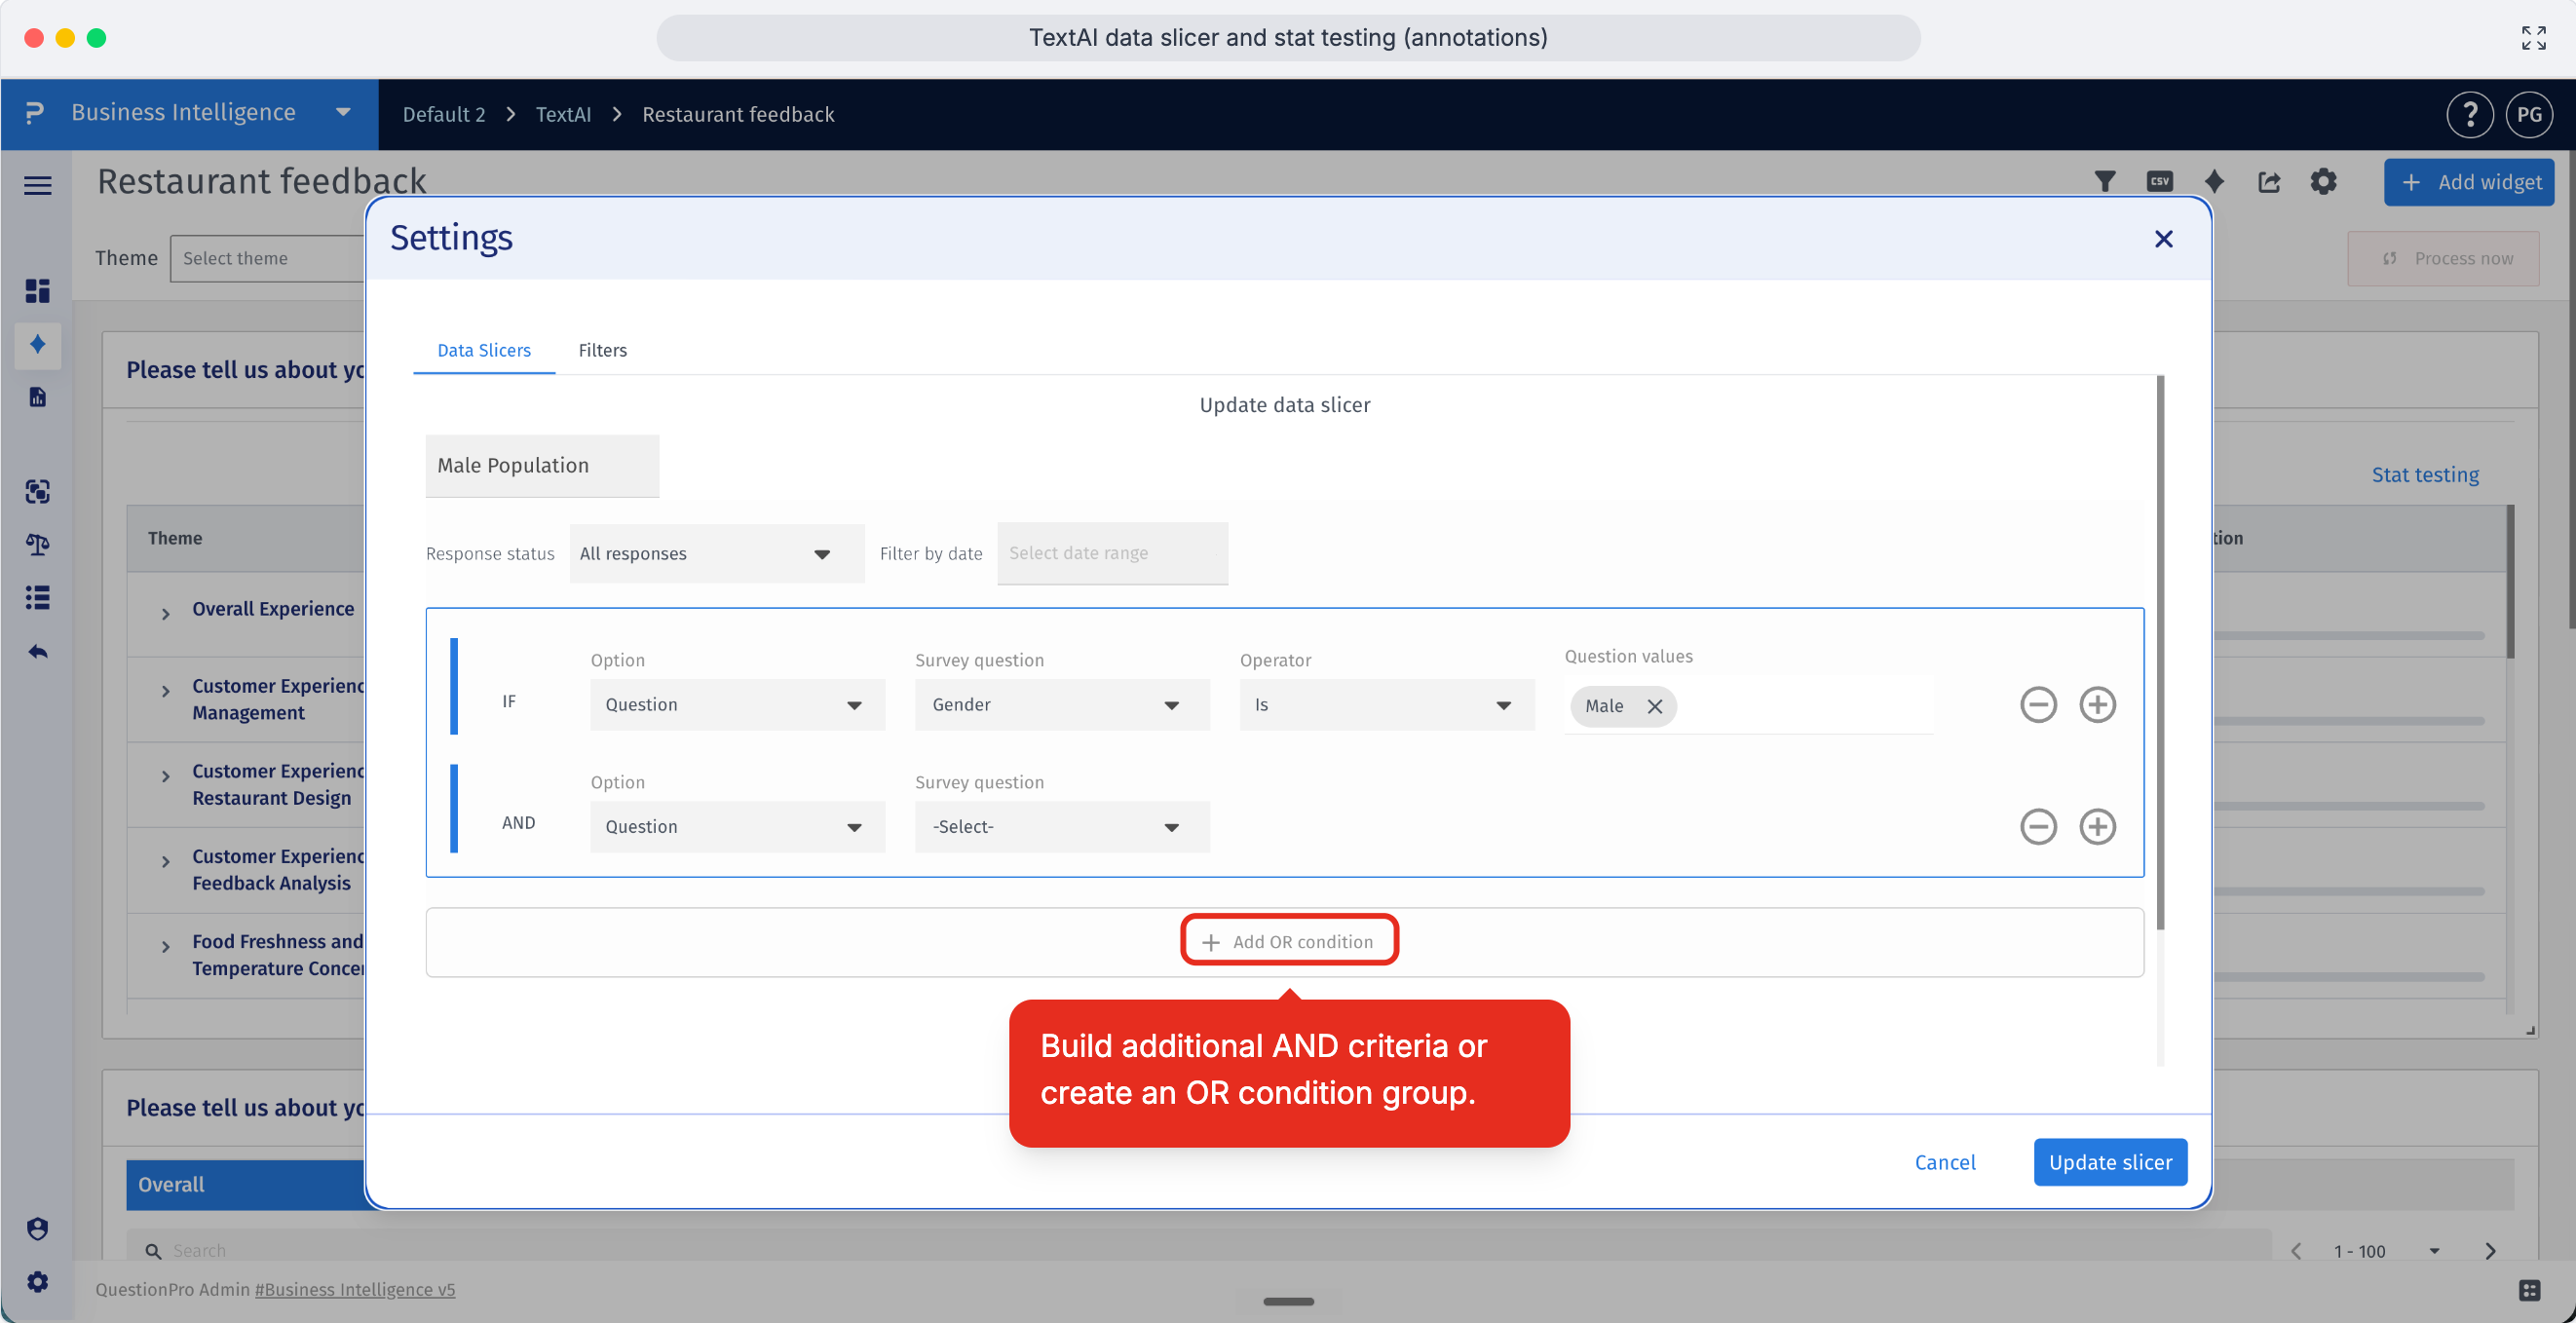
- Add another criteria group when the segment should include respondents who match one set of rules or another set of rules.
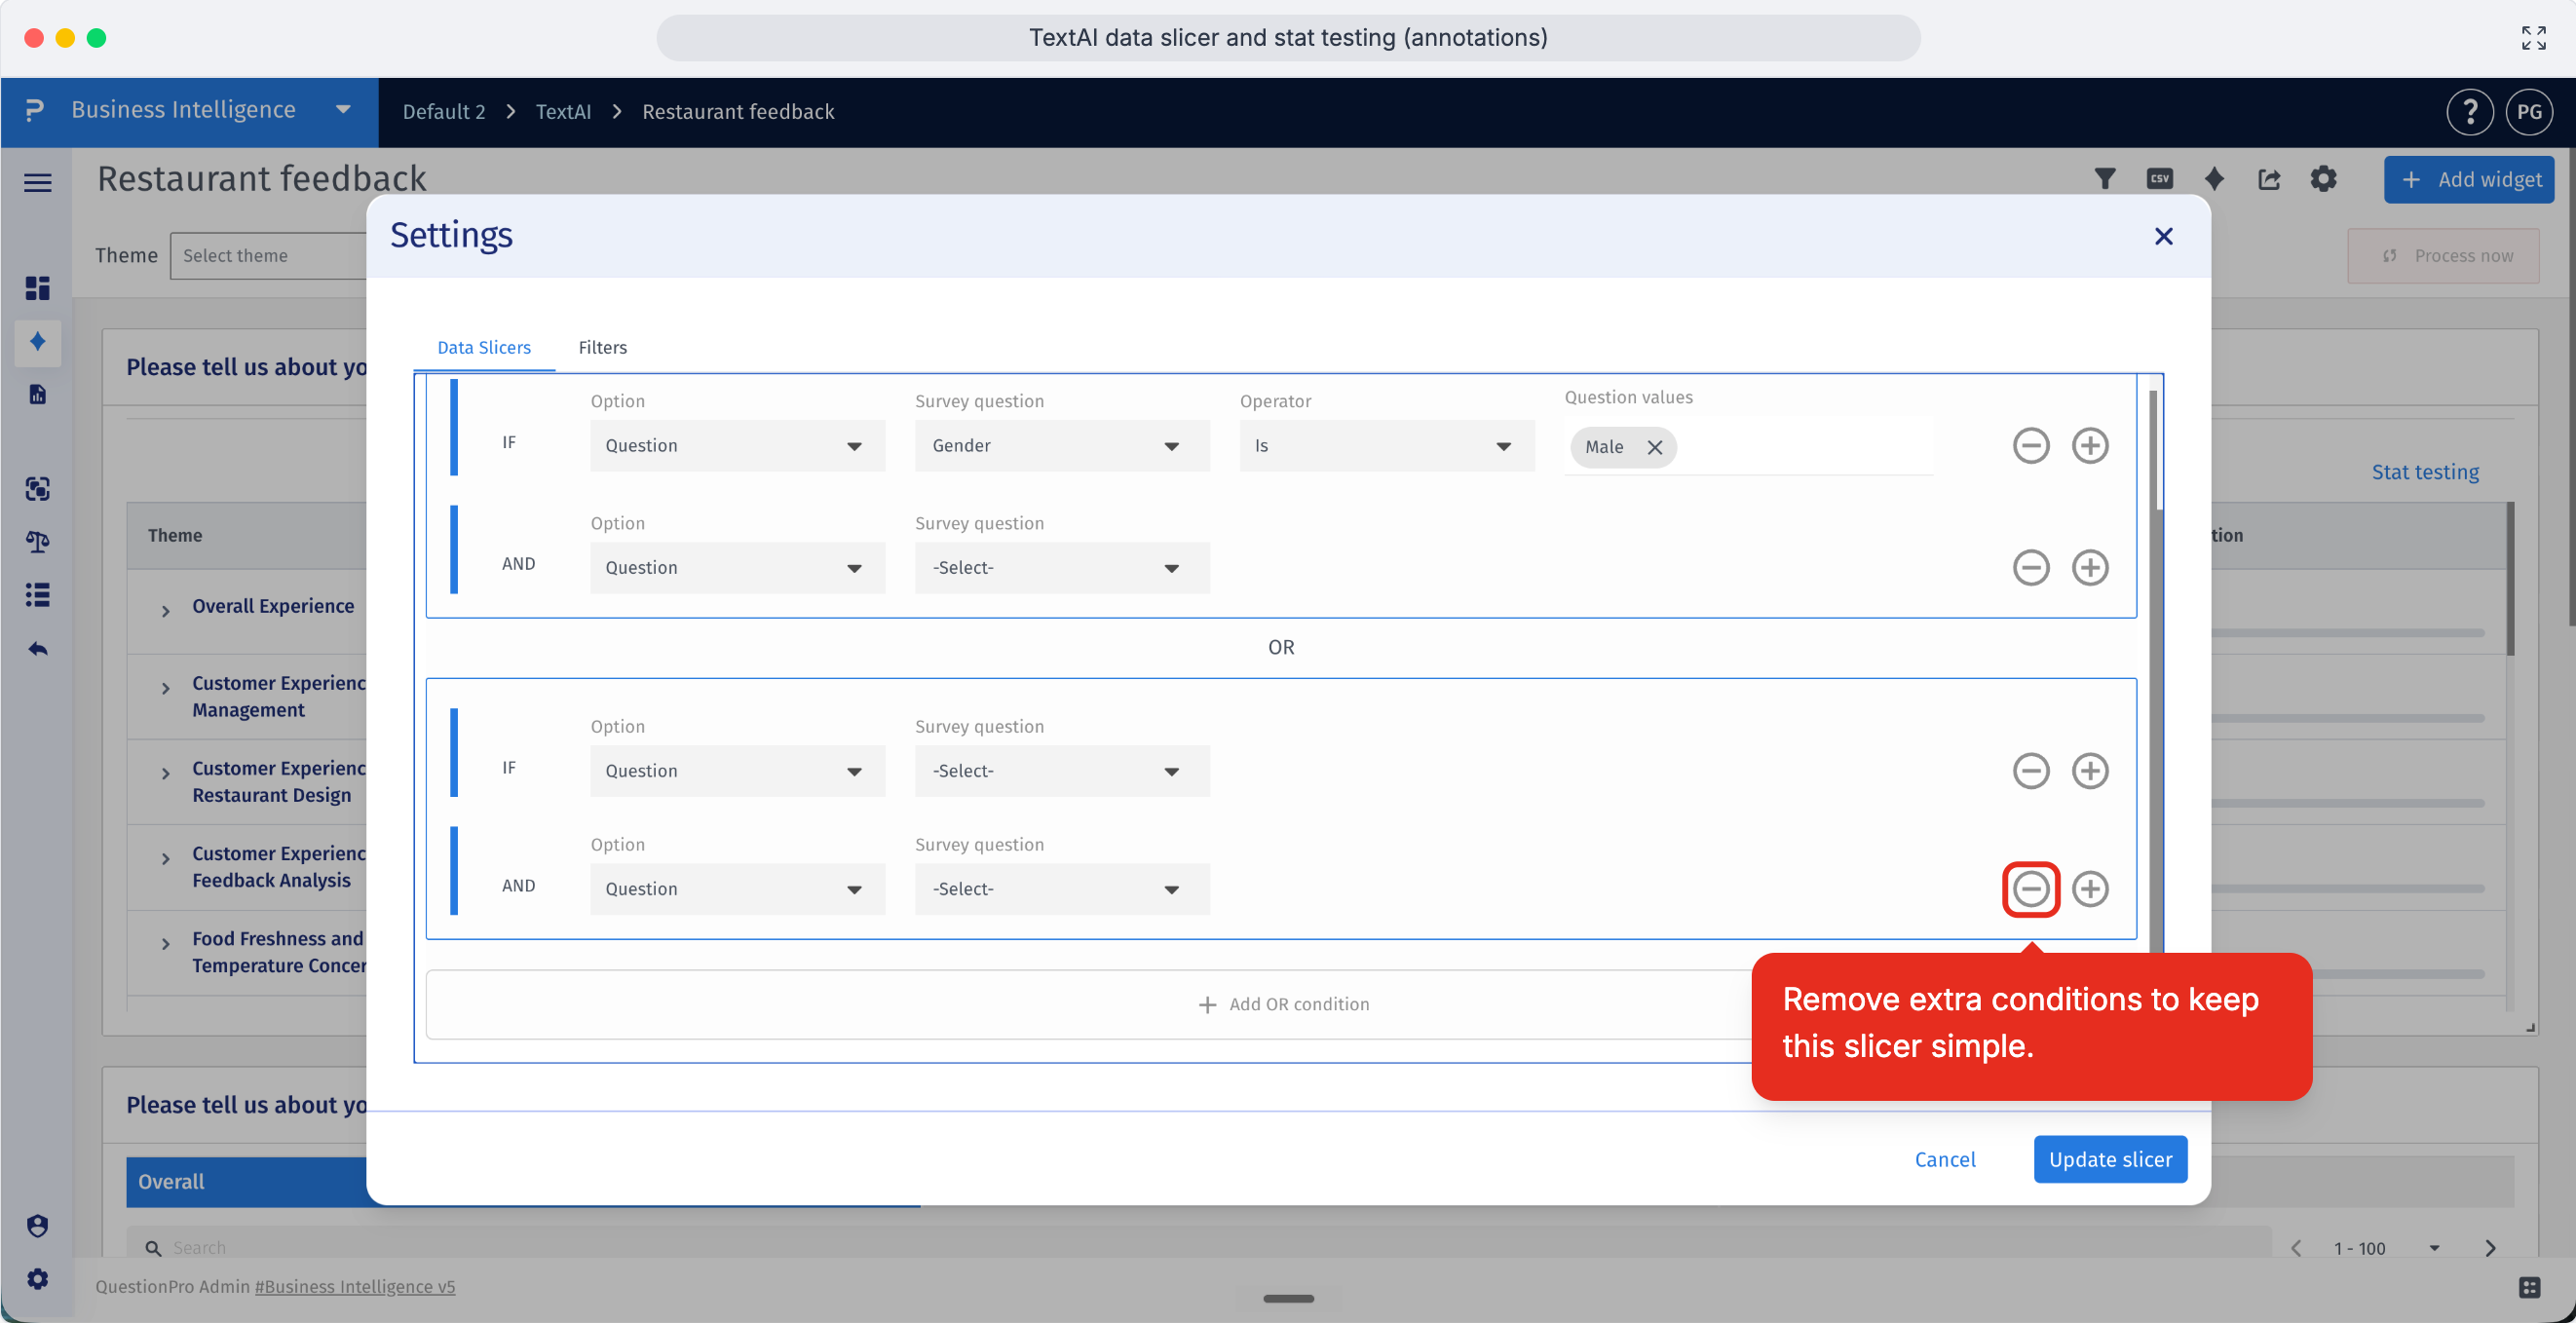
- Remove any extra condition rows that are not needed so the Data Slicer stays focused on the exact segment you want to compare.
- Click Save to create the Data Slicer and make it available for dashboard analysis.
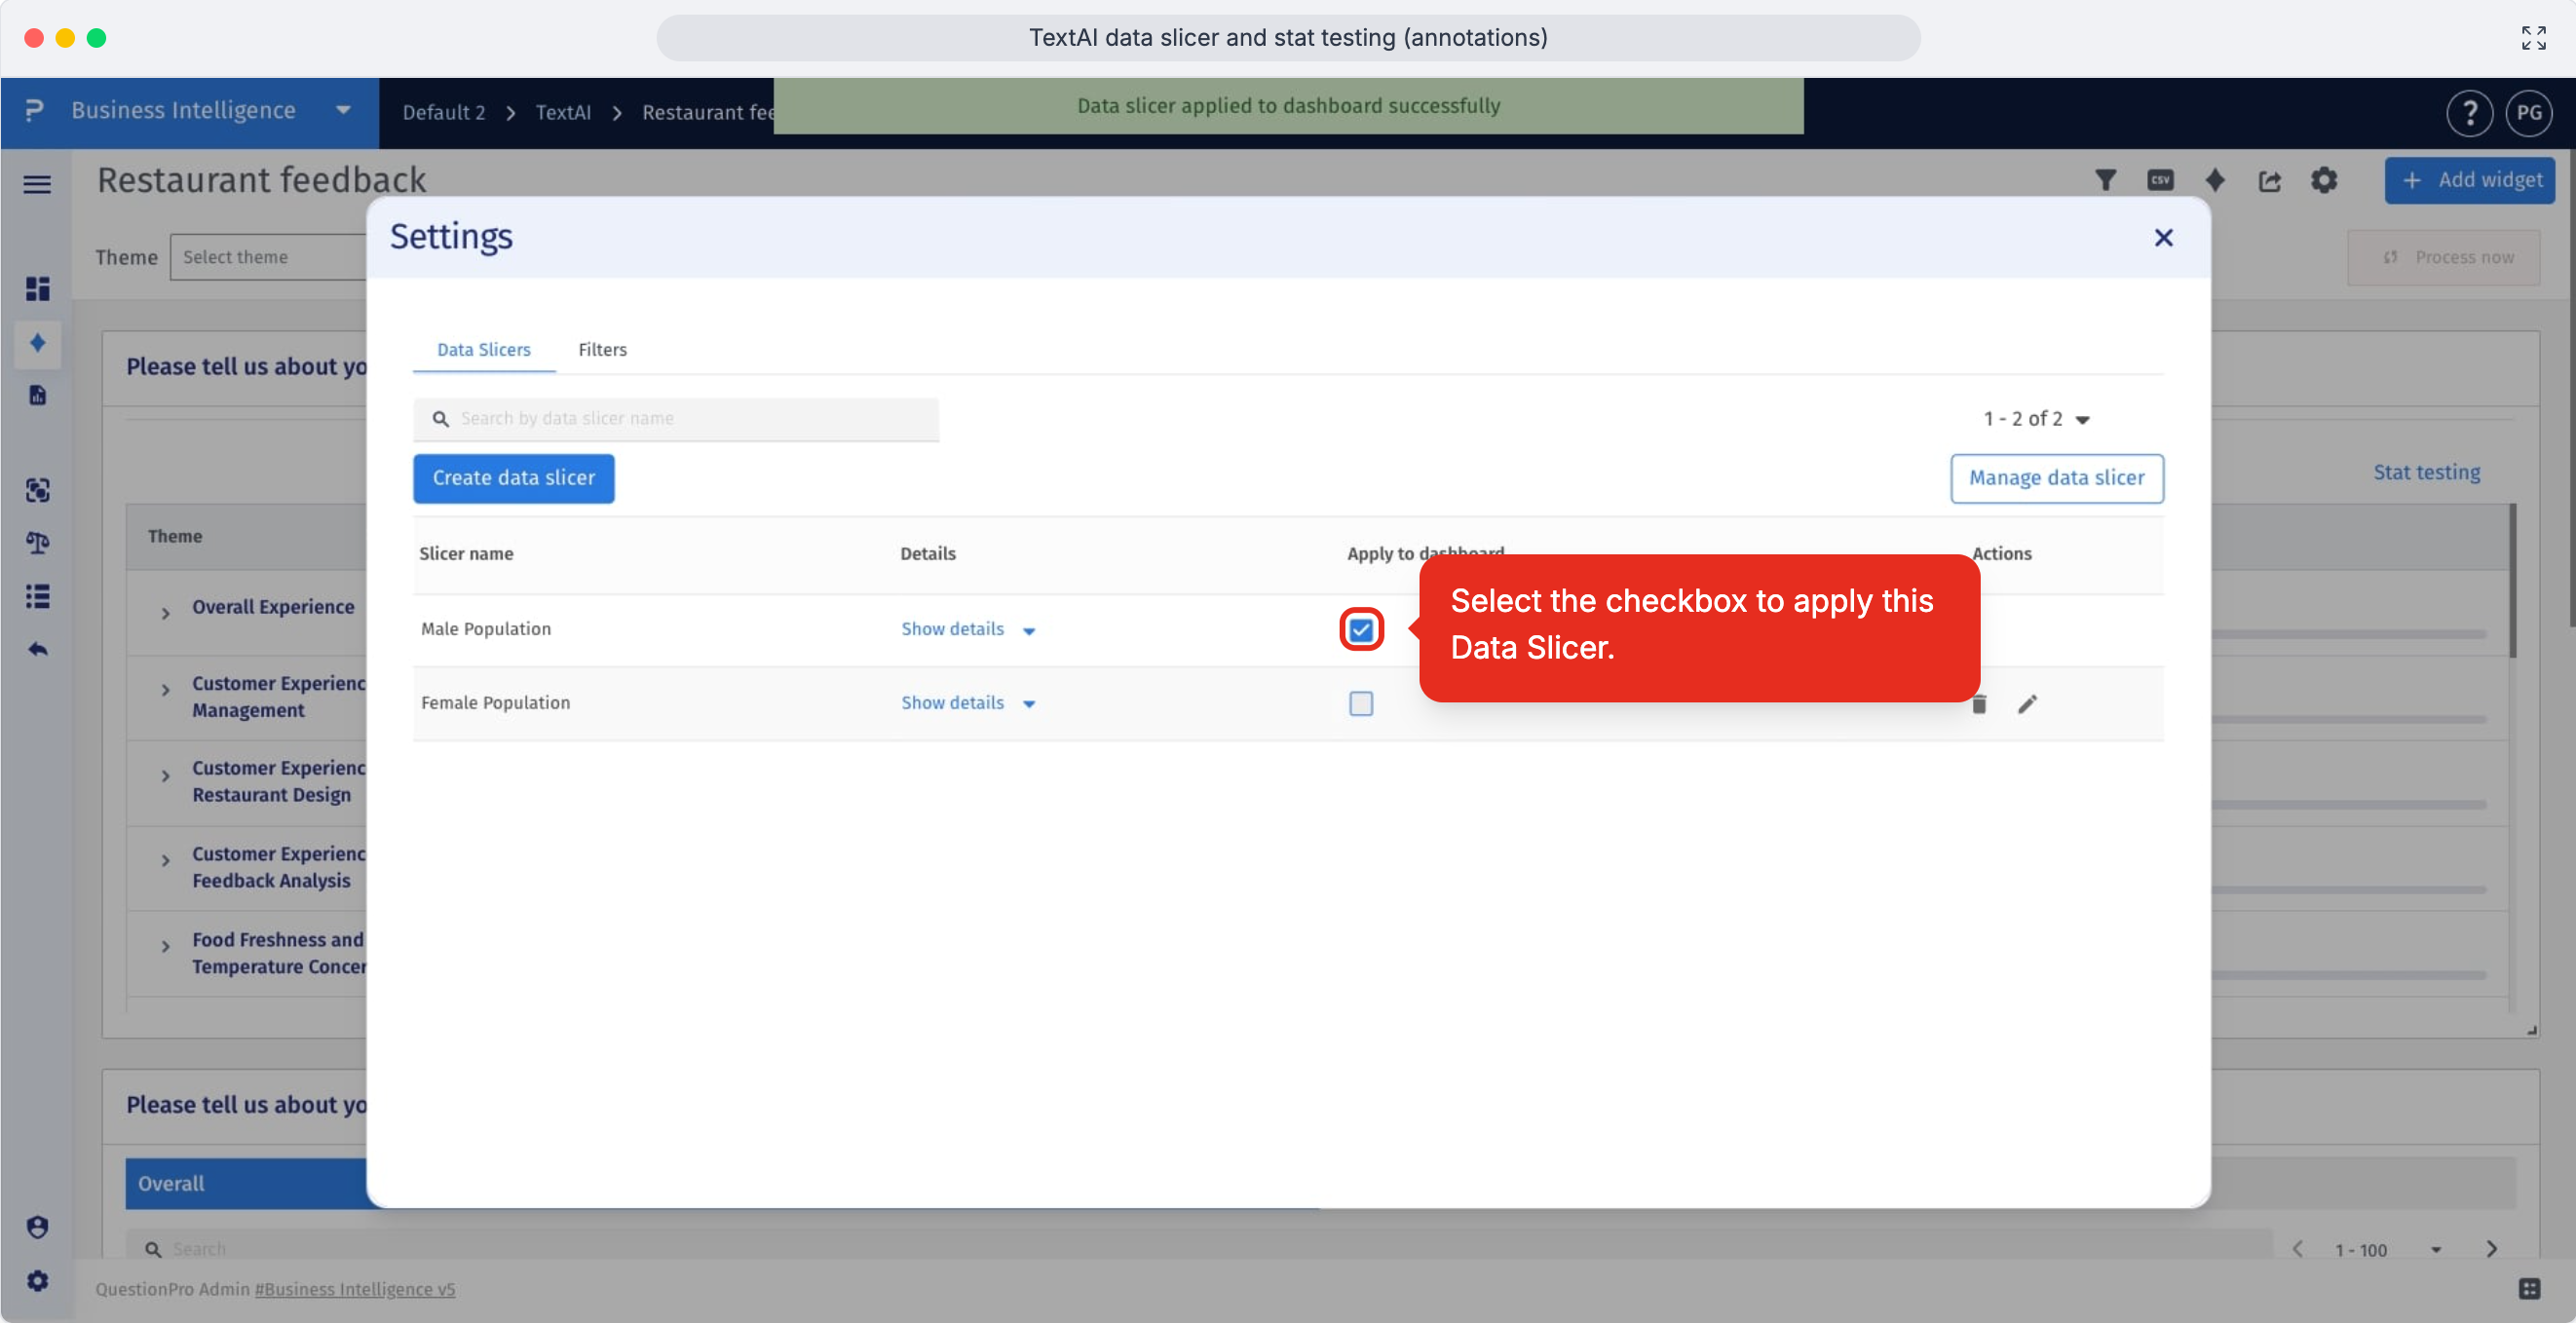
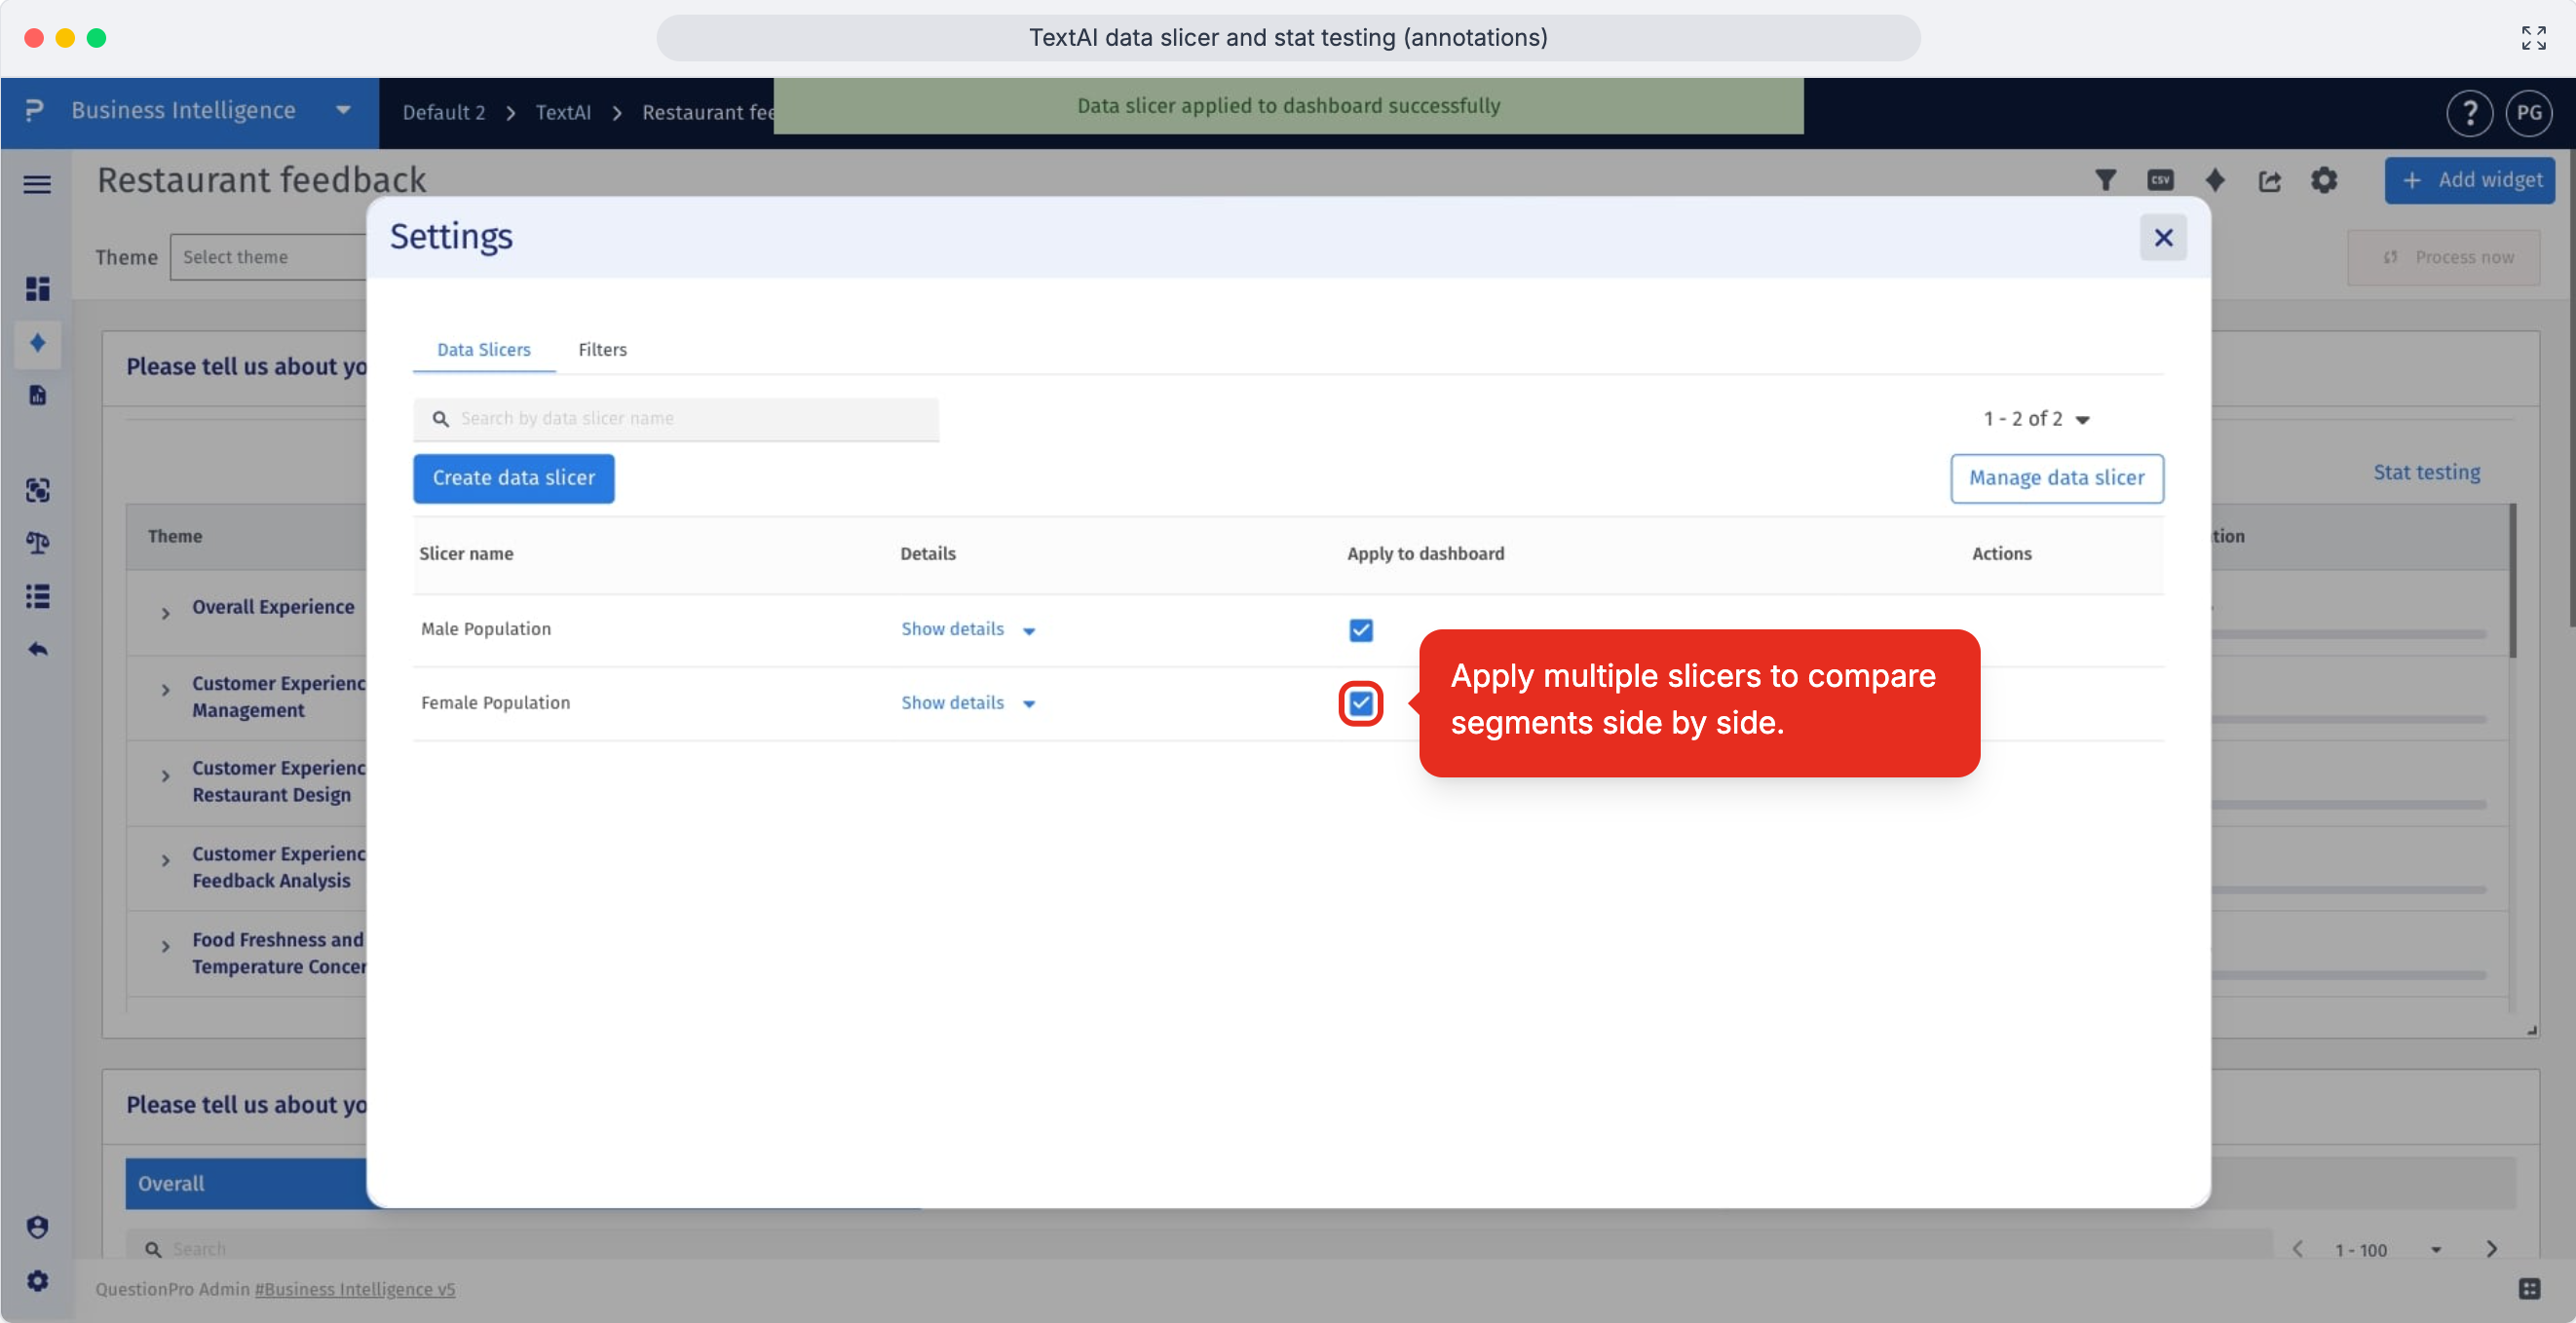
- Step 5: Select one or multiple Data Slicers to apply them to the dashboard. Selecting multiple slicers lets you compare segments side by side in the same dashboard view.
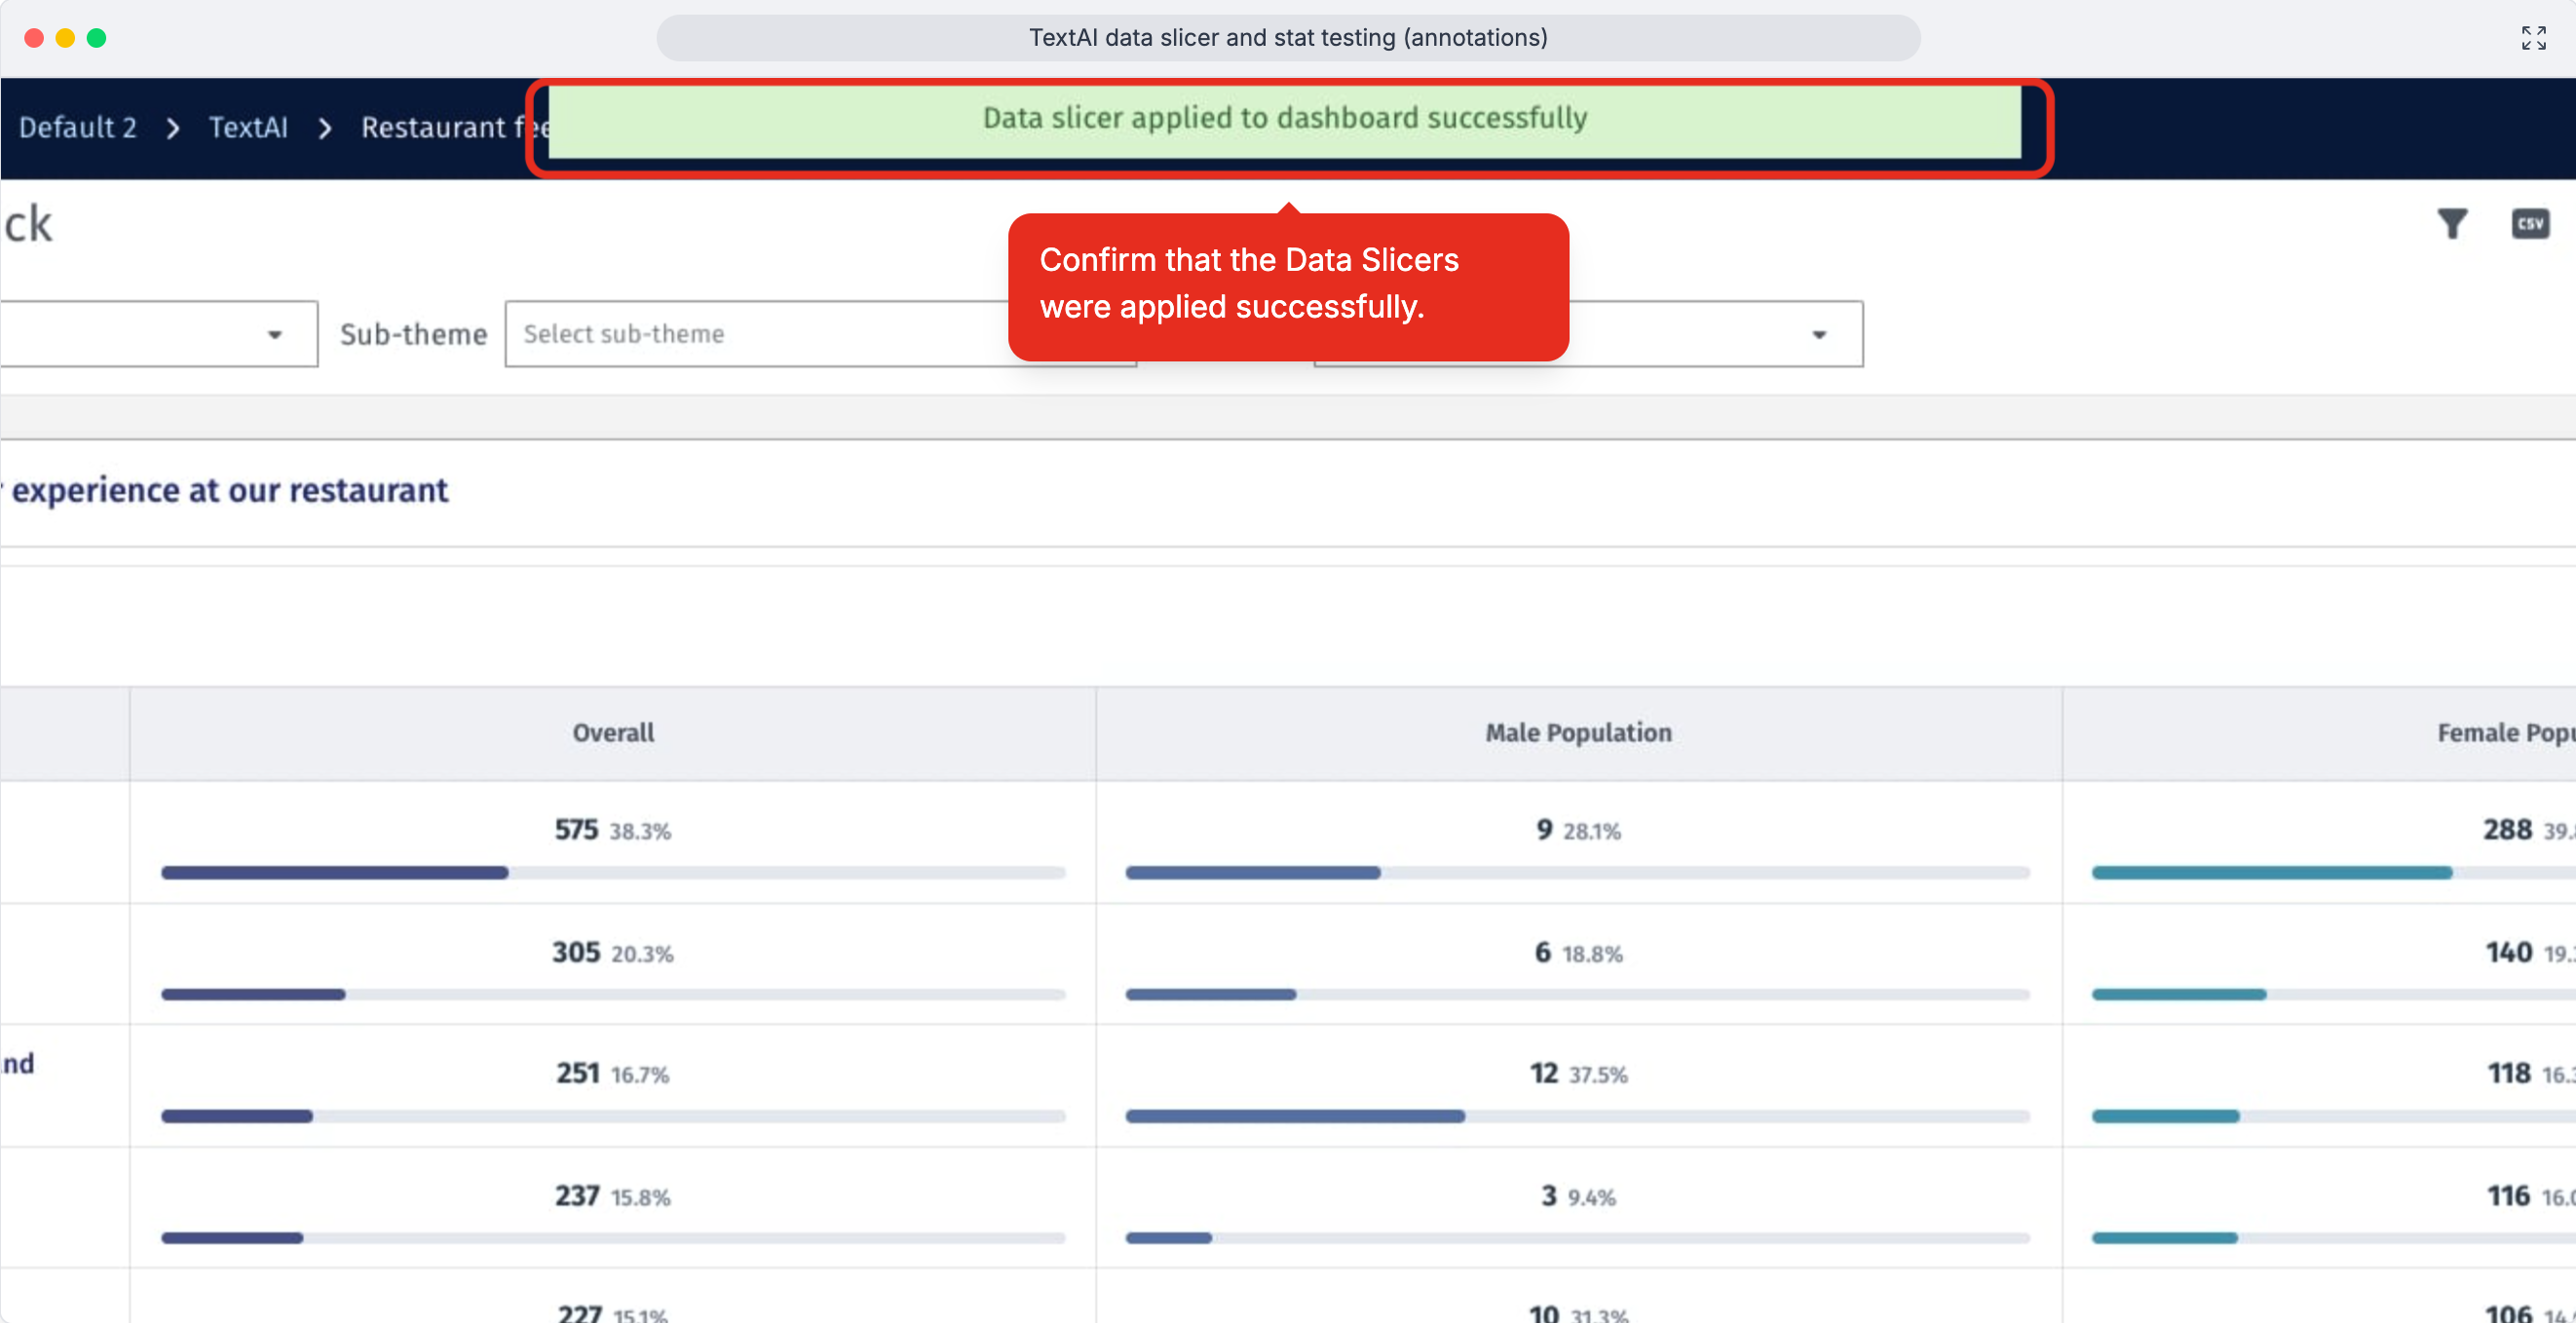
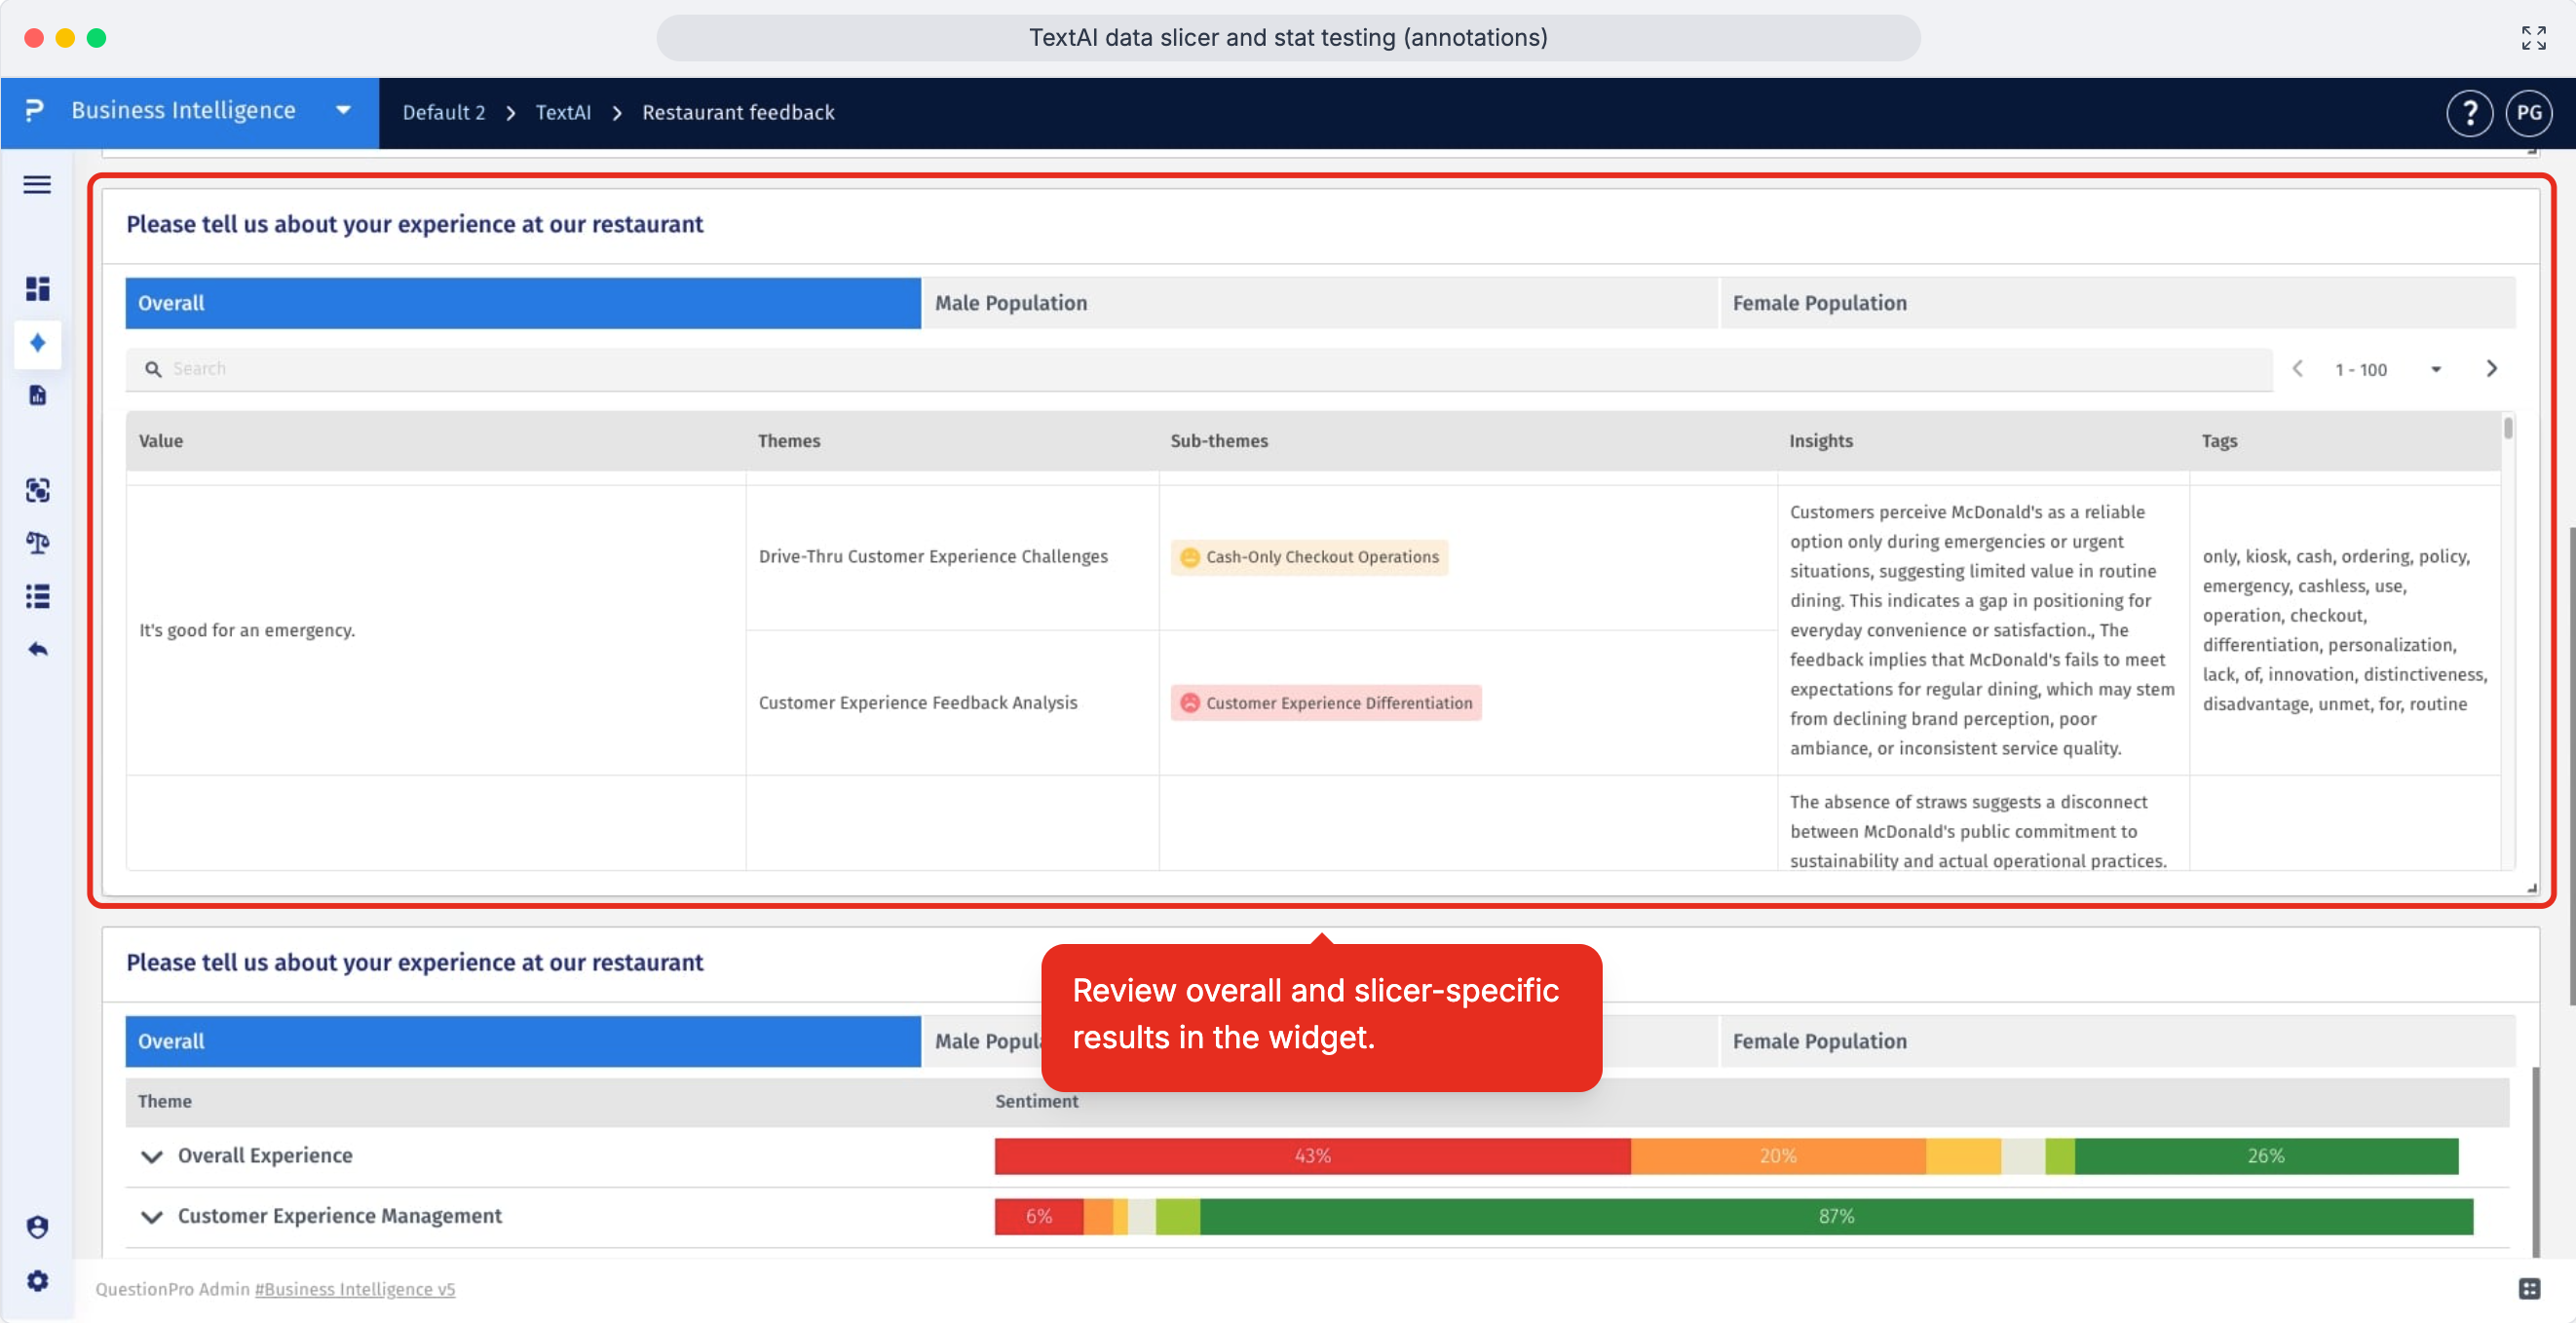
- Step 6: Review the dashboard confirmation and results to make sure the selected Data Slicers are active and the dashboard is showing the segment-level view you expected.
- Review the overall results alongside each slicer-specific result so you can quickly compare the full response set with the segments you selected.
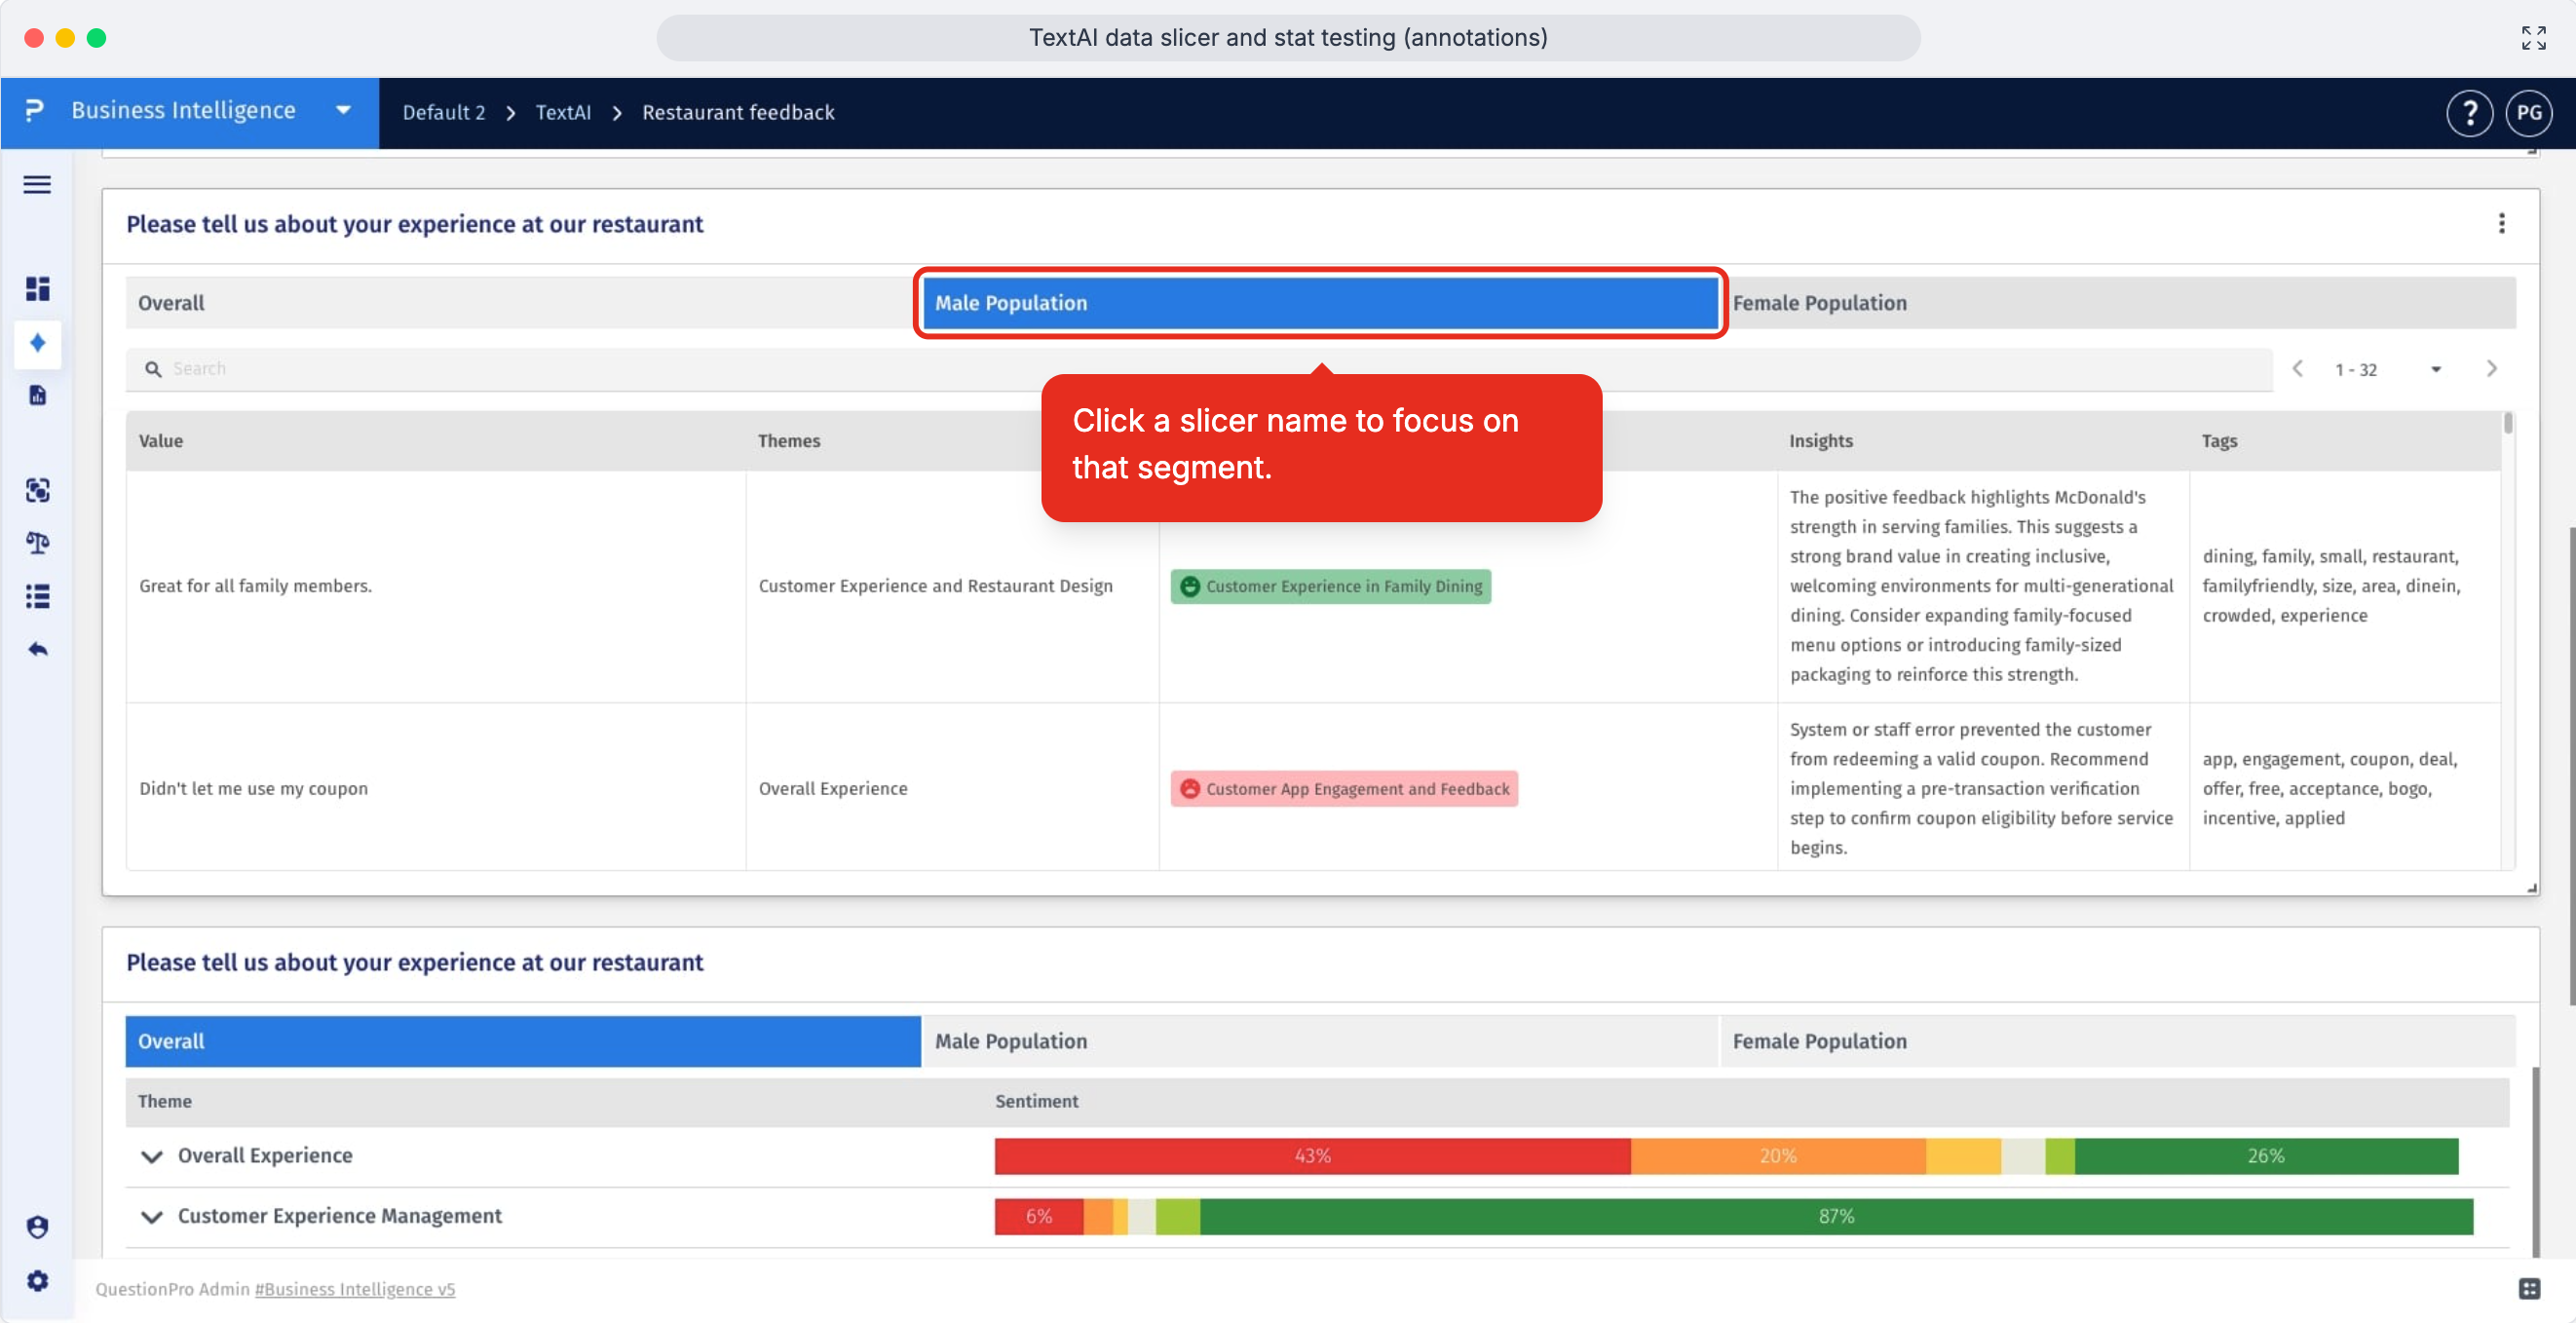
- Click a Data Slicer name to narrow the widget to that segment and examine its themes, counts, and response patterns more closely.
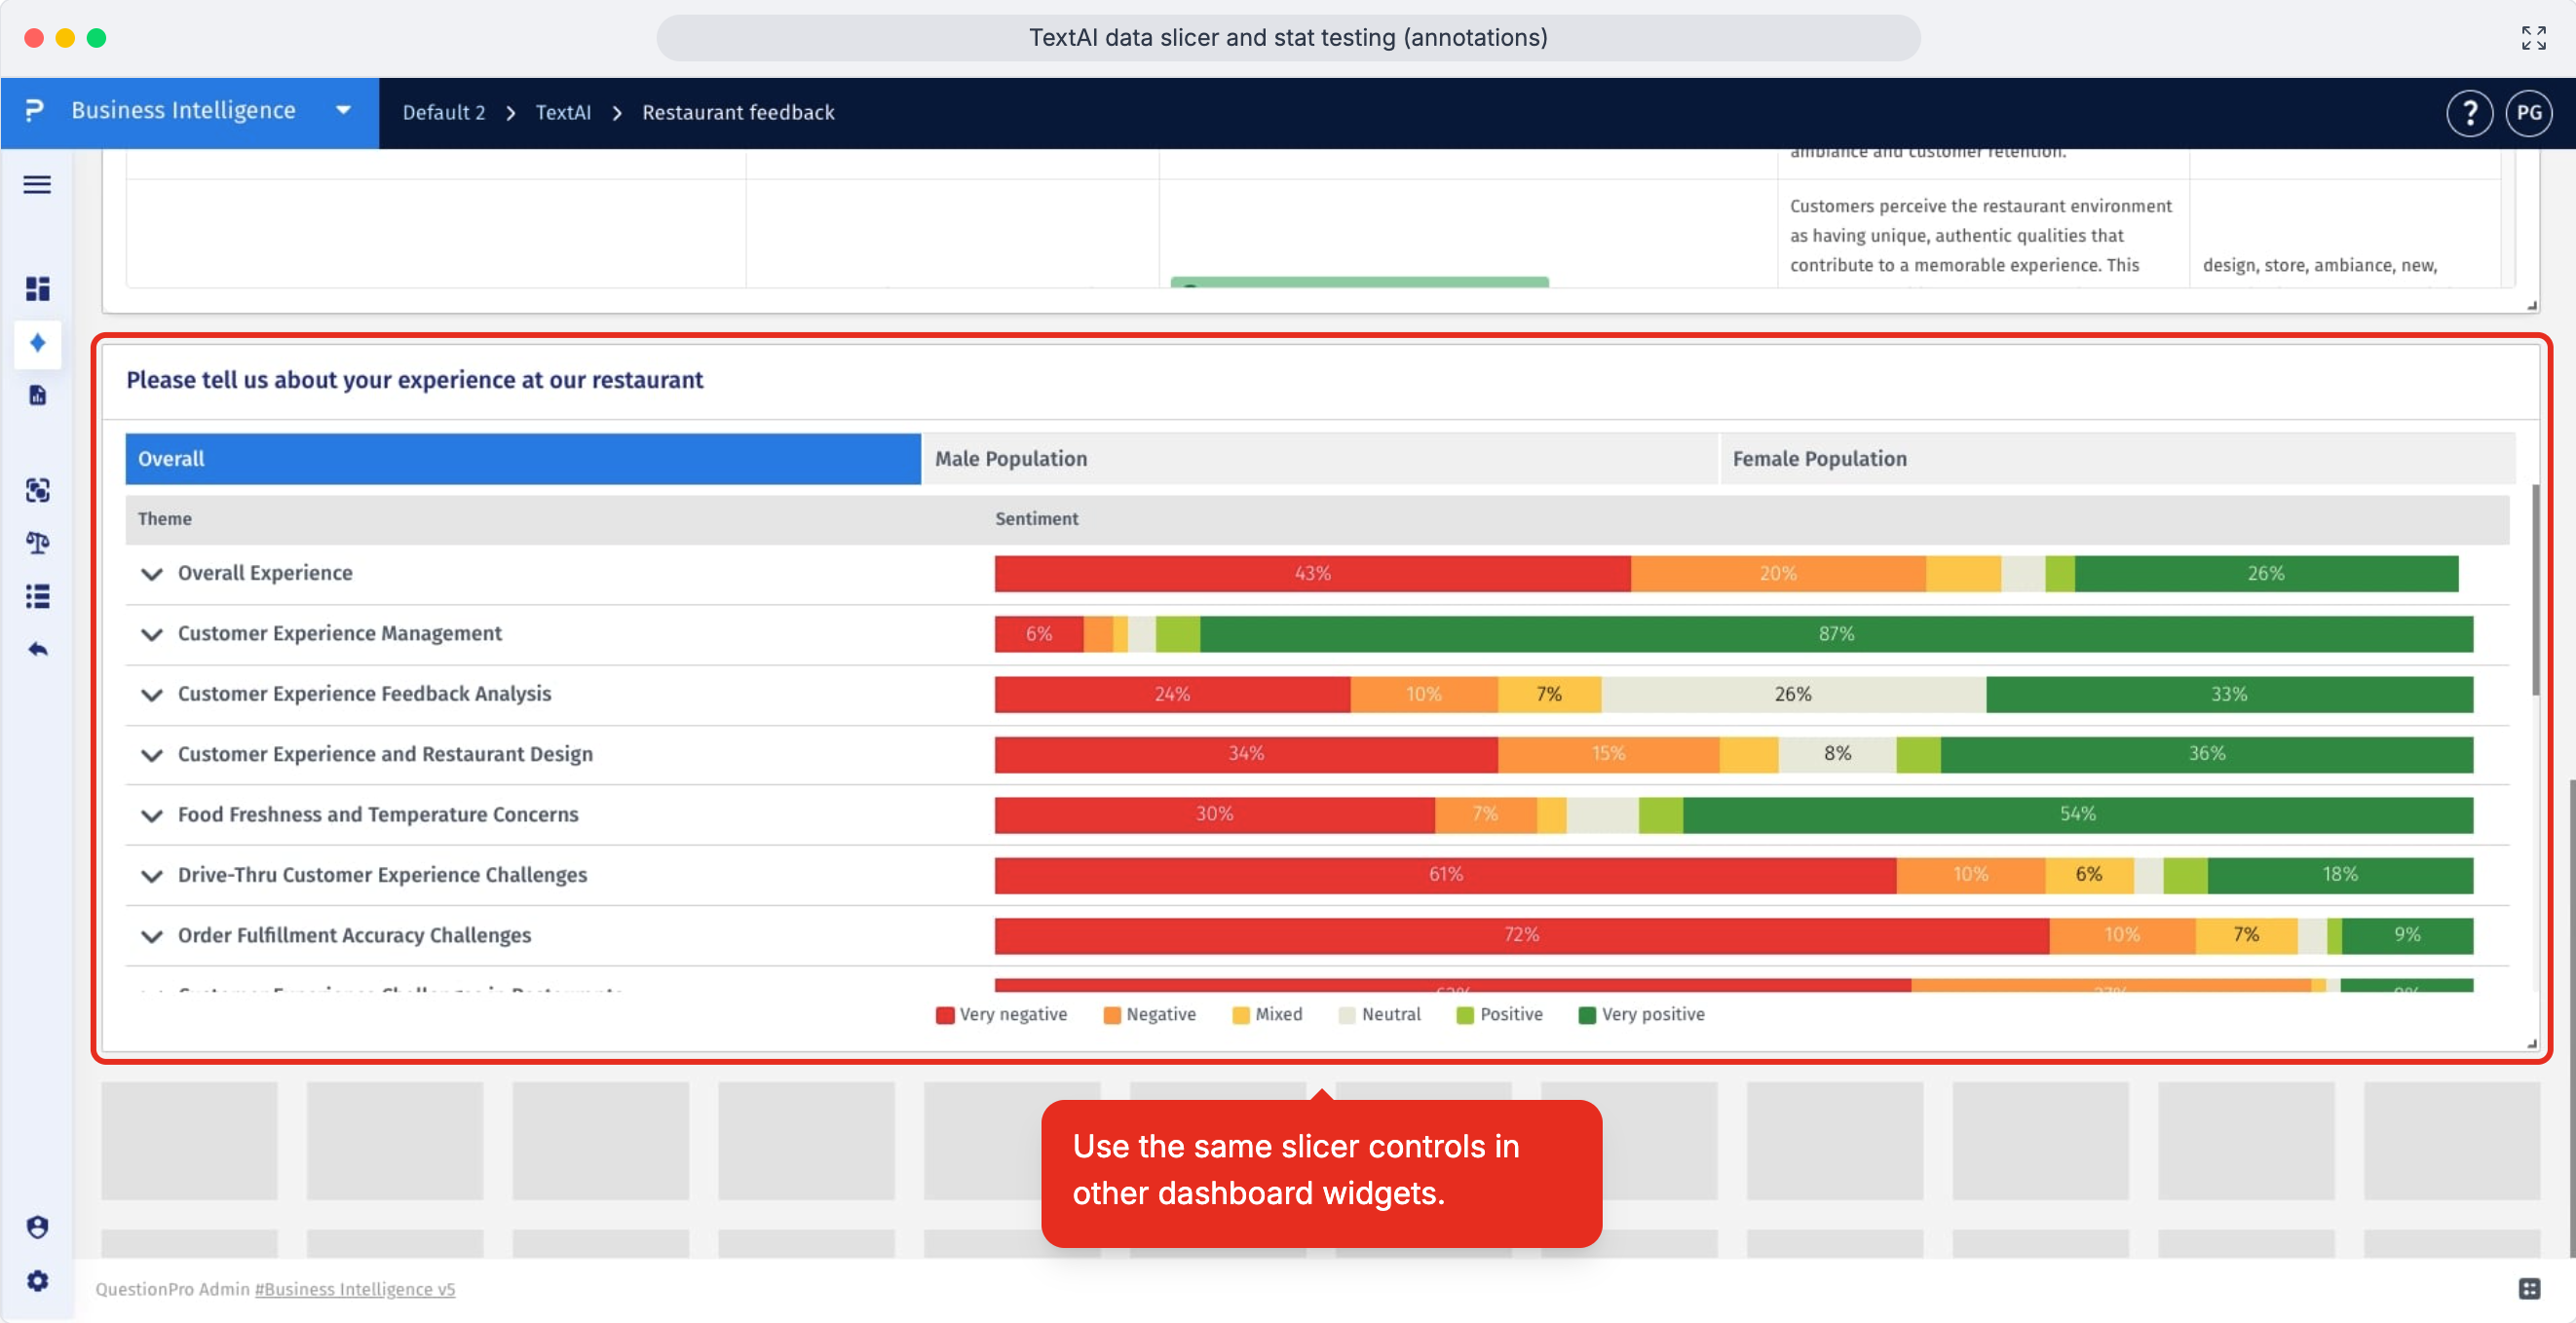
- Use the same slicer controls in other dashboard widgets when you want to carry the same segment comparison through the rest of your analysis.
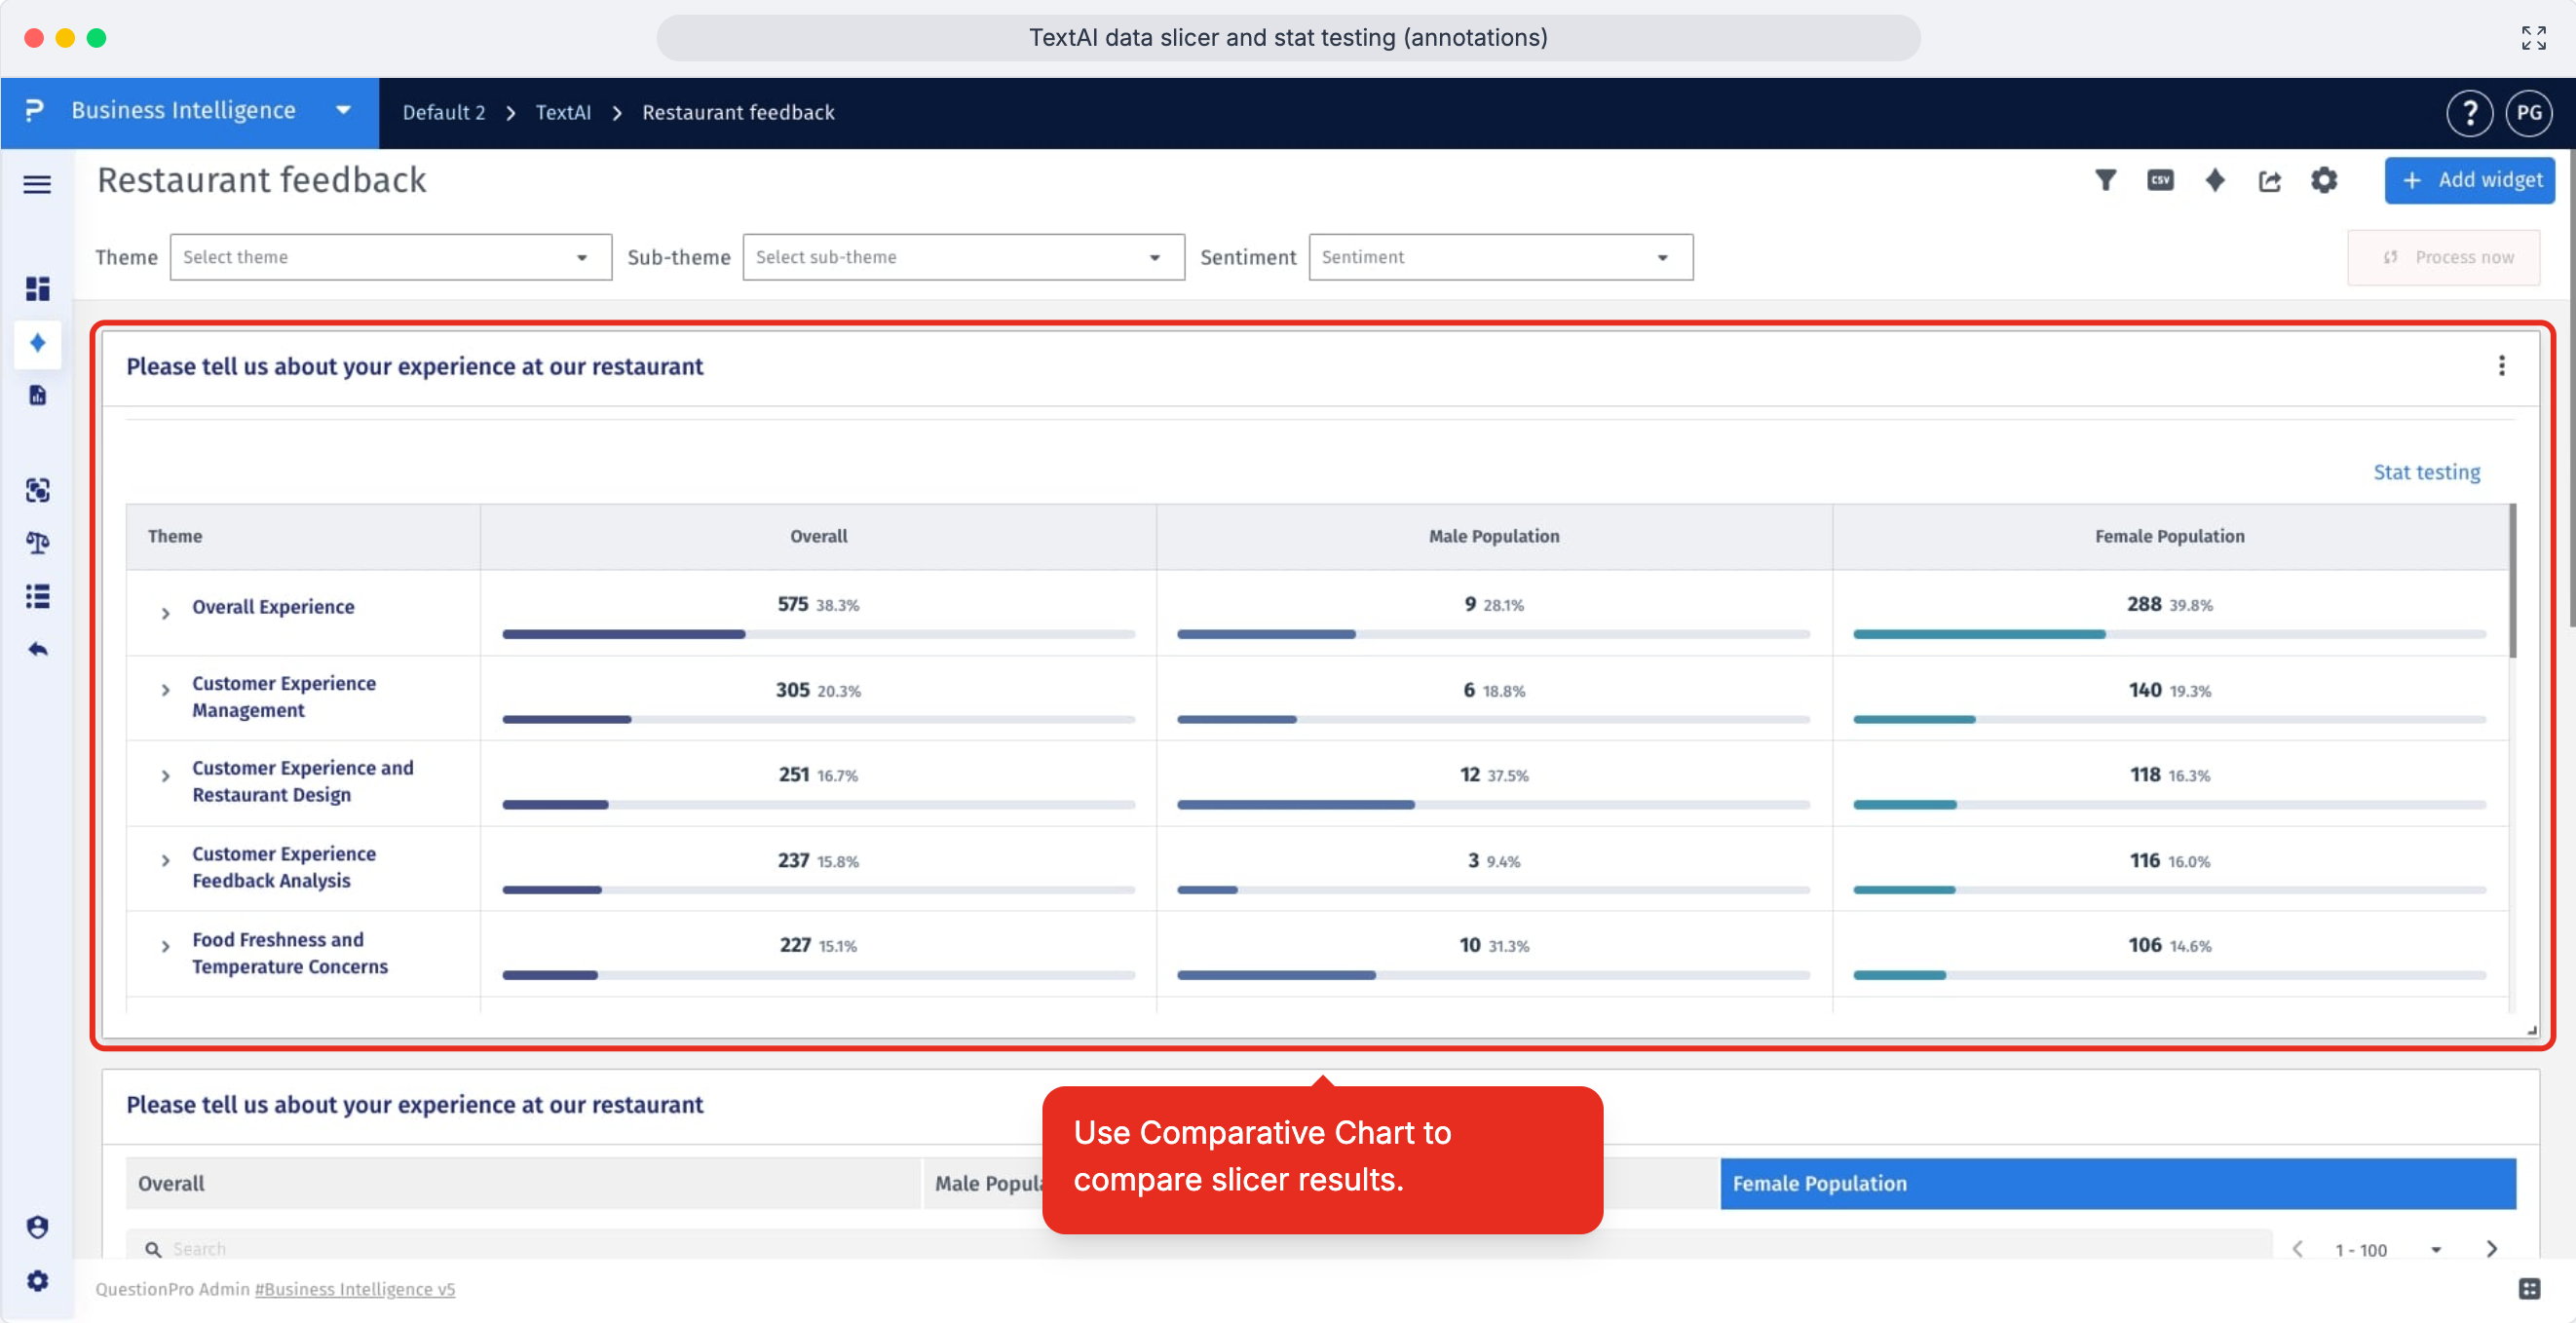
Stat Testing in TextAI helps you identify statistically meaningful differences between the overall results and the Data Slicer segments applied to a comparative chart. Use it when you want to understand whether a segment stands out from the broader audience, instead of relying only on visual differences in the chart.
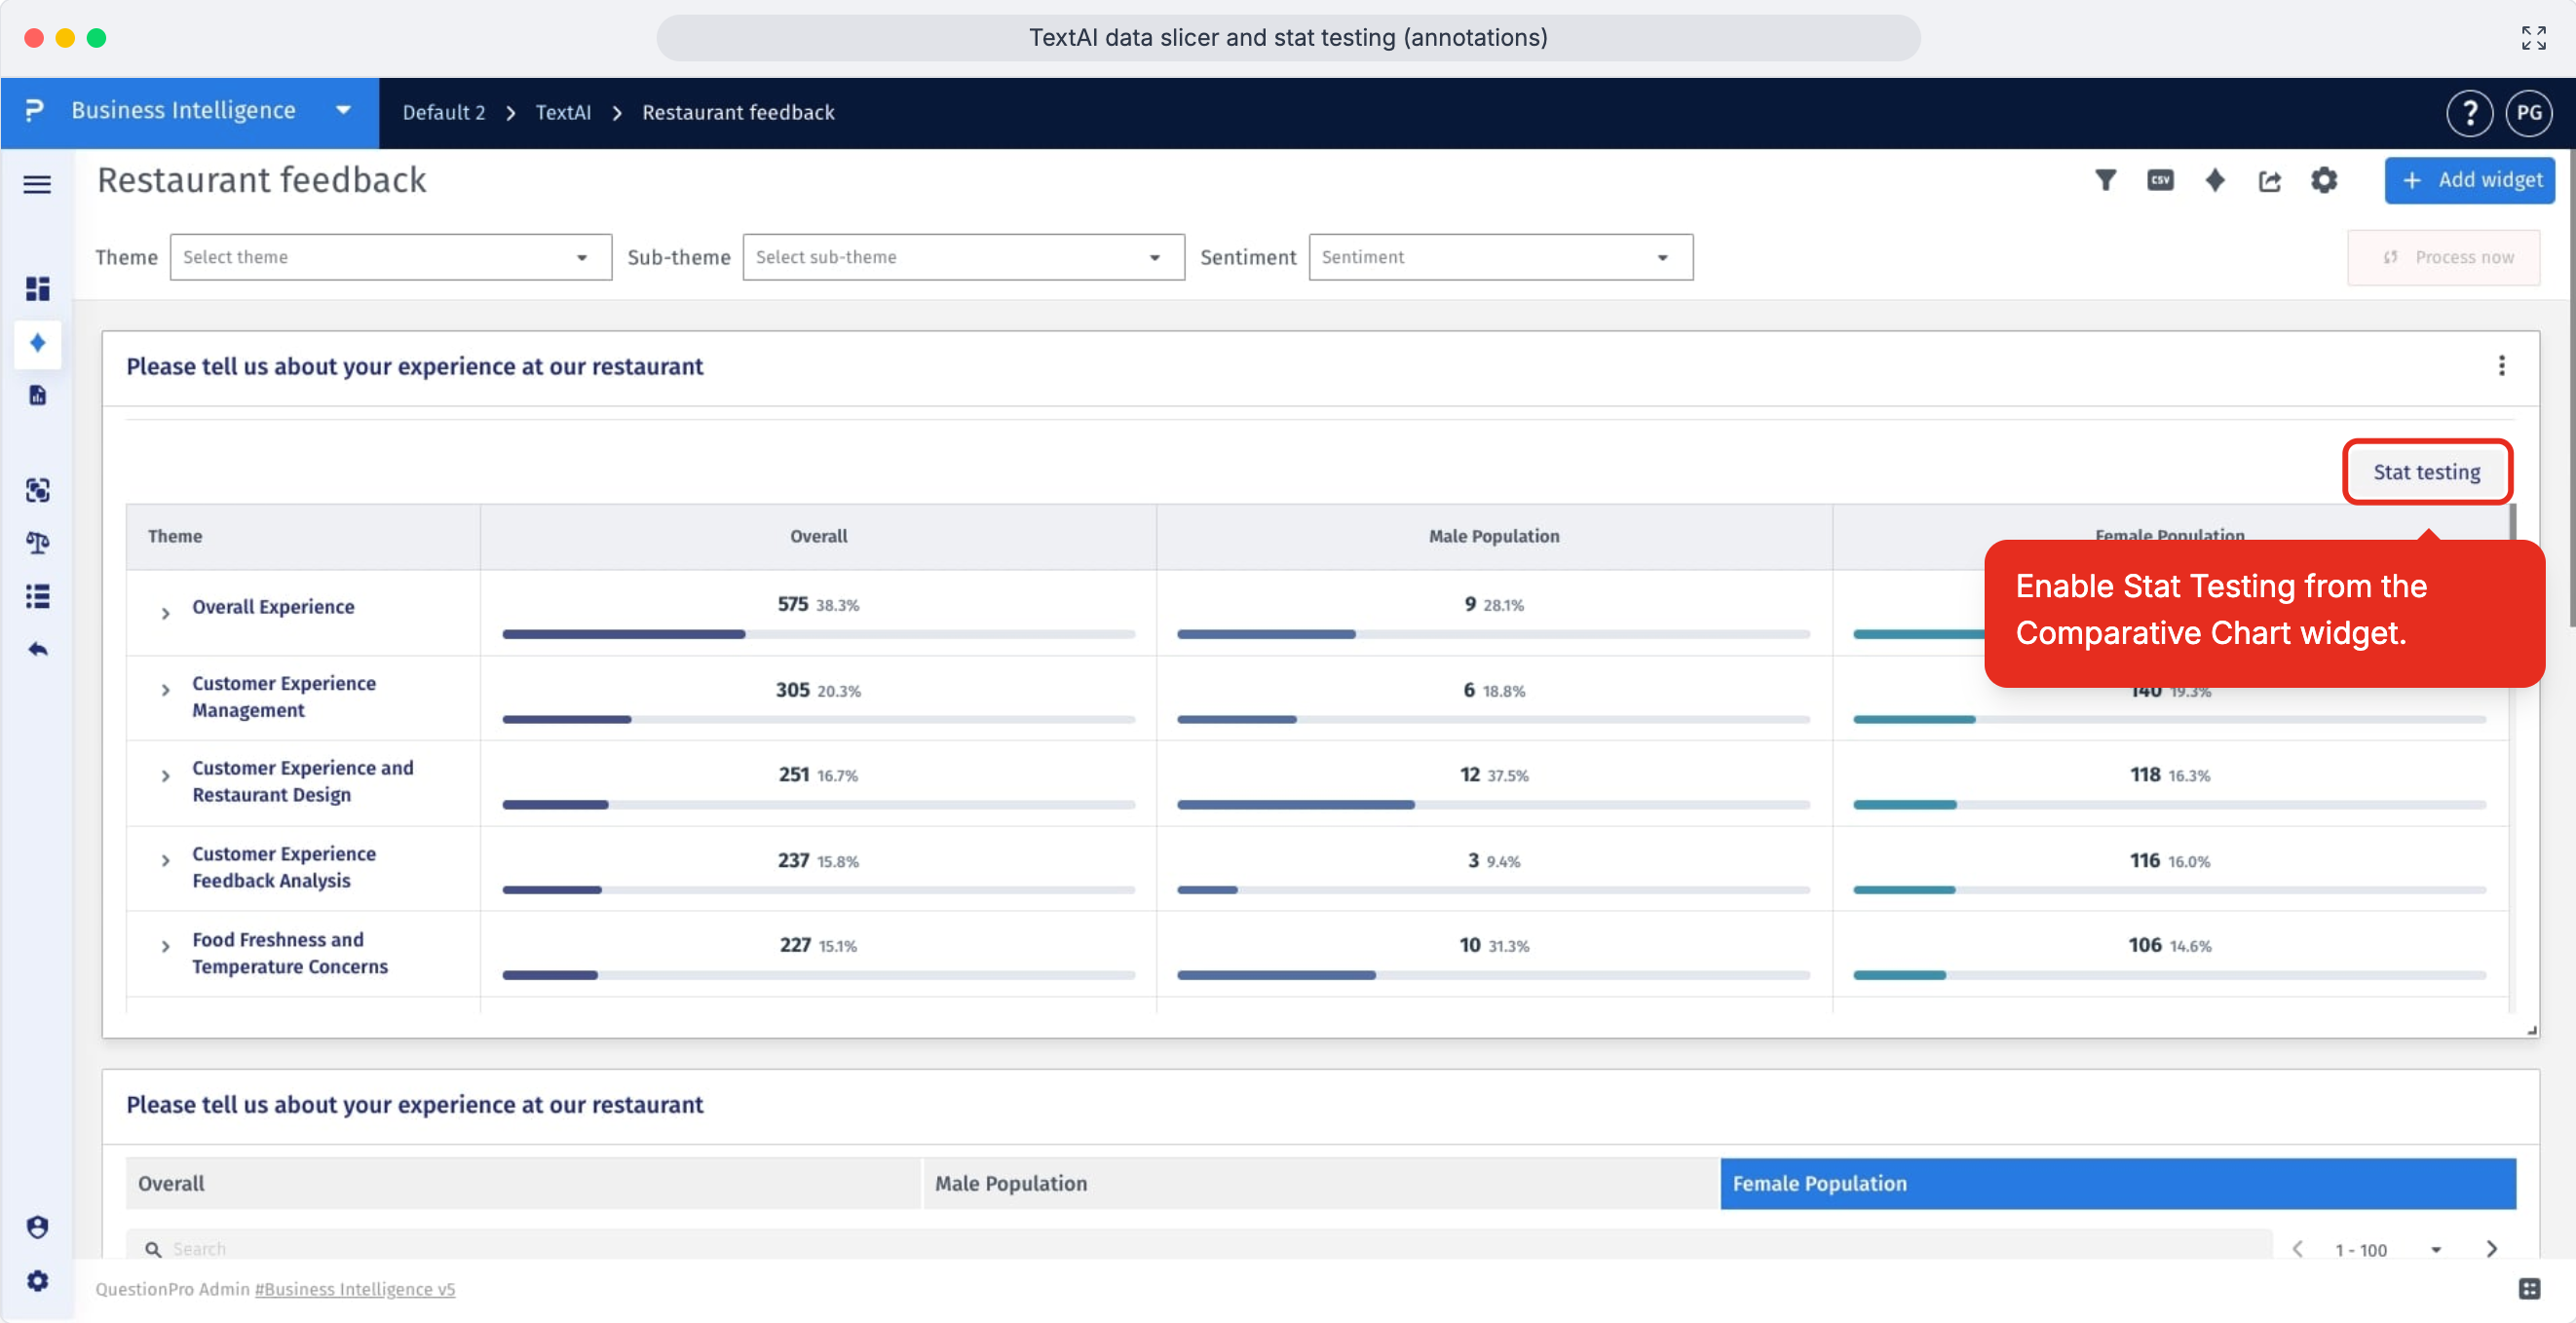
- Navigate to an existing comparative chart widget in your dashboard, or create a new comparative chart widget for the question and segments you want to evaluate.
- Click the Stat Testing icon in the comparative chart widget to turn on statistical comparison for the displayed results.
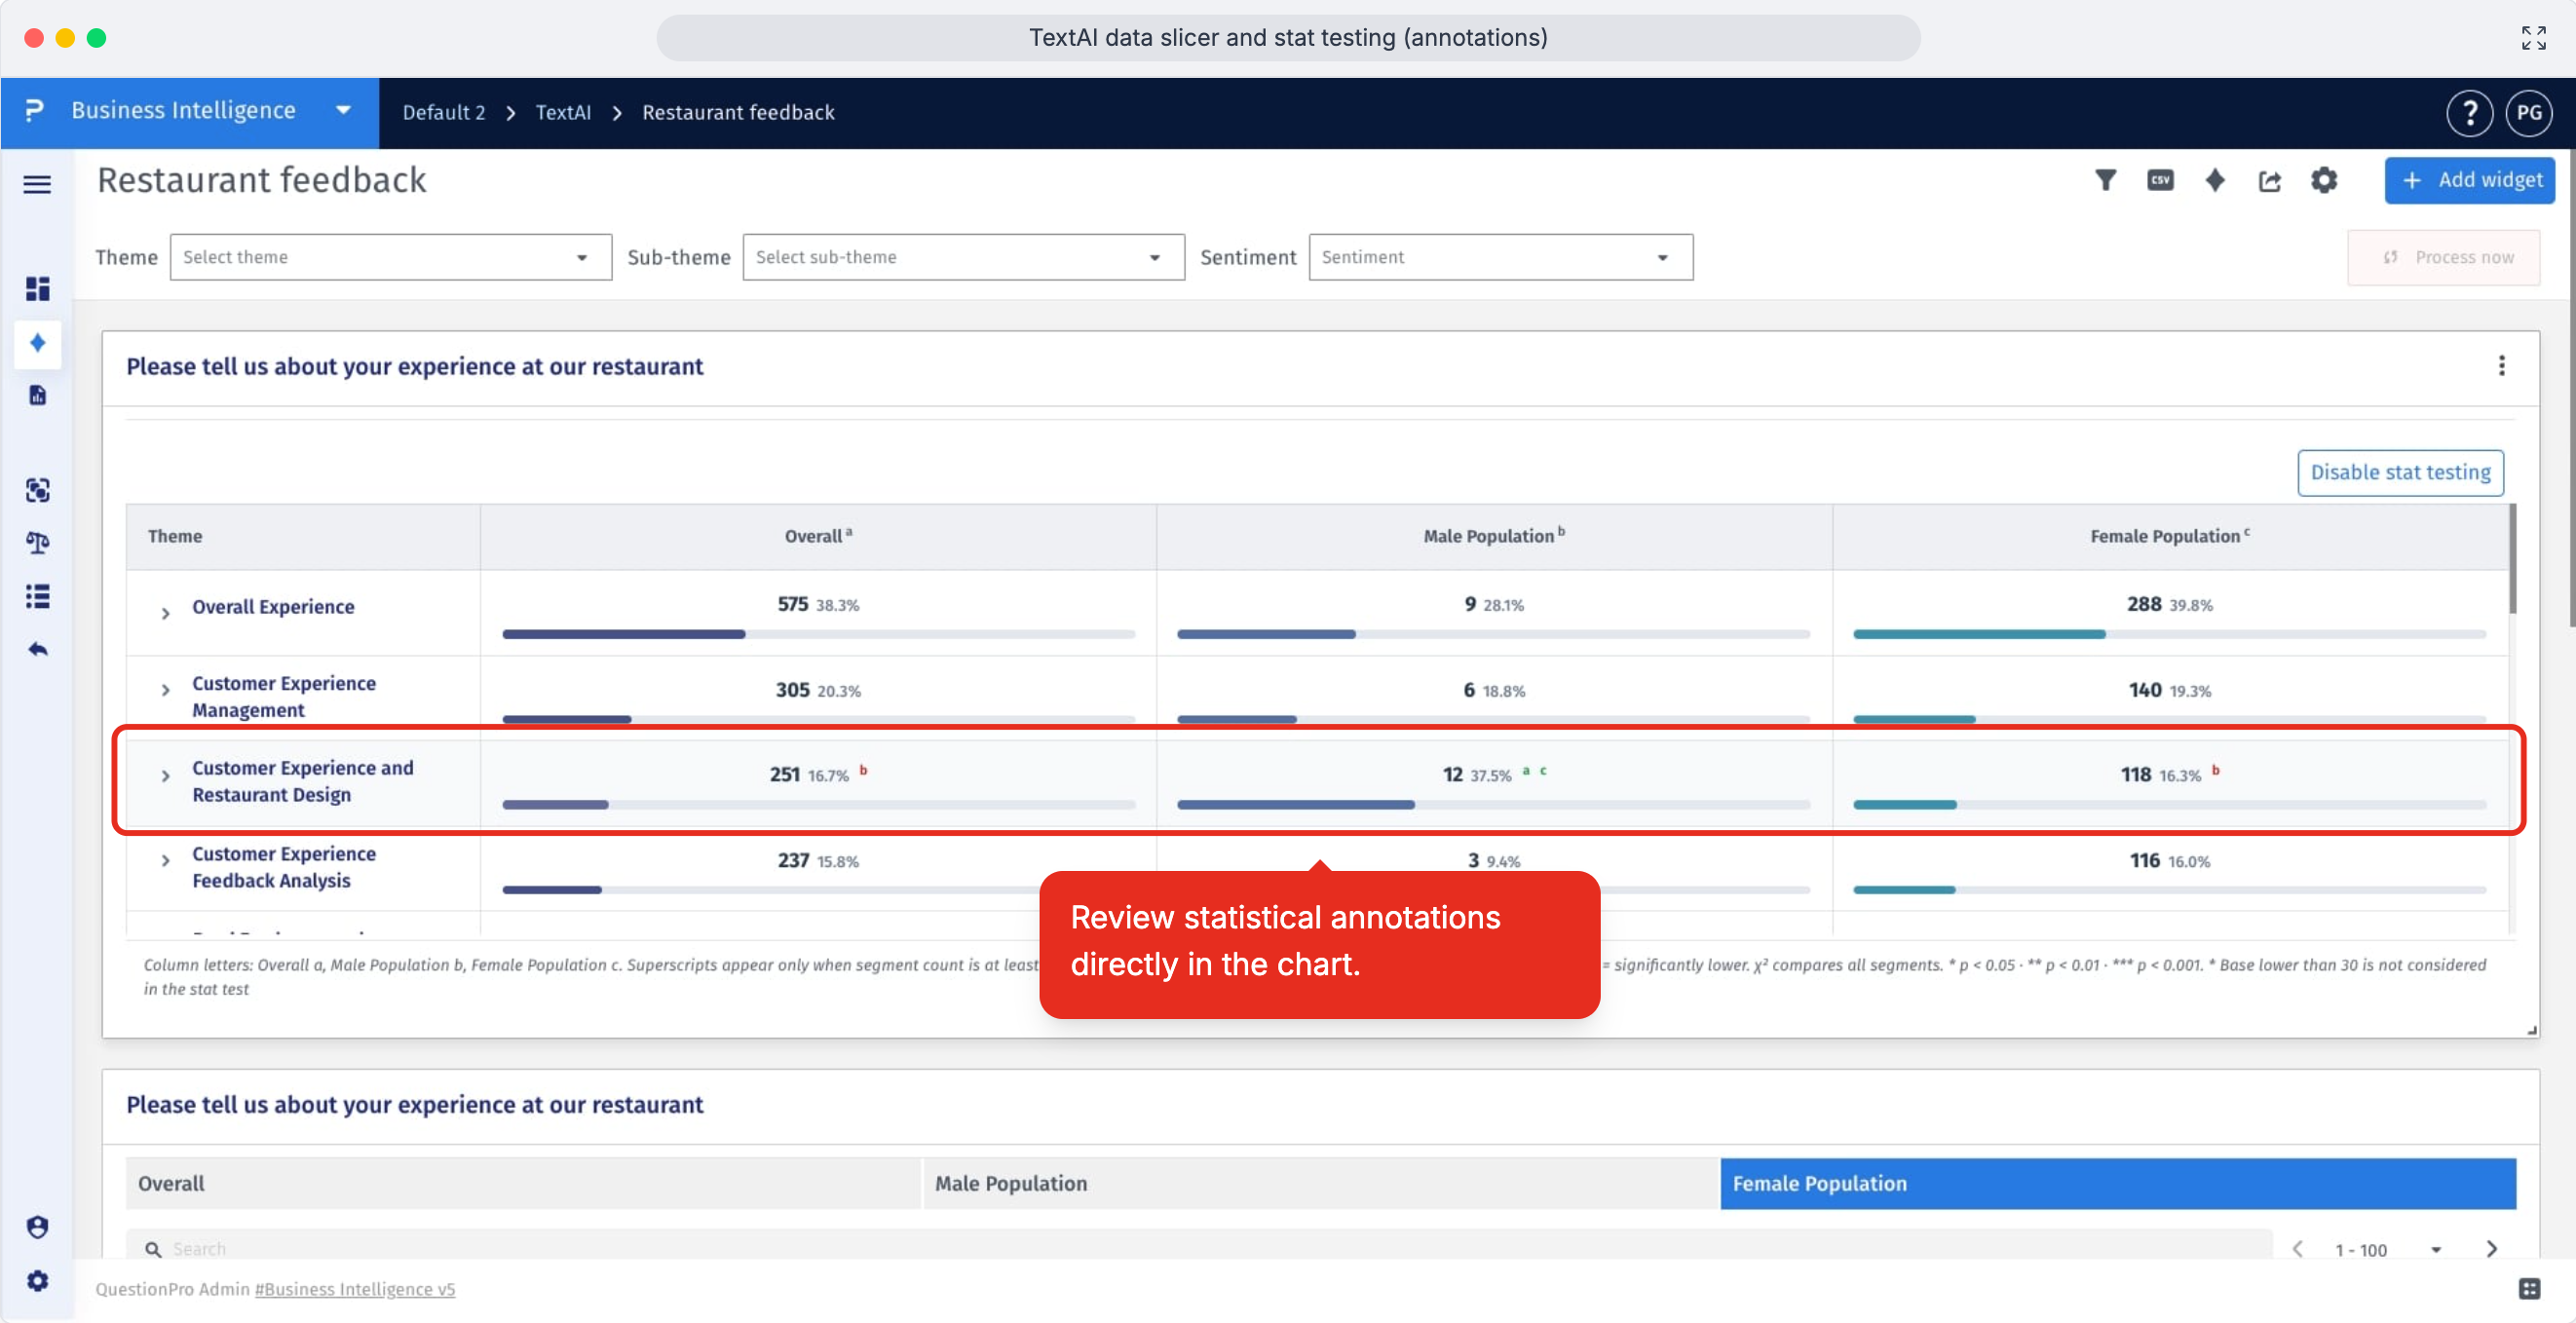
- Review the statistical annotations directly in the chart to see which segment-level differences are meaningful.
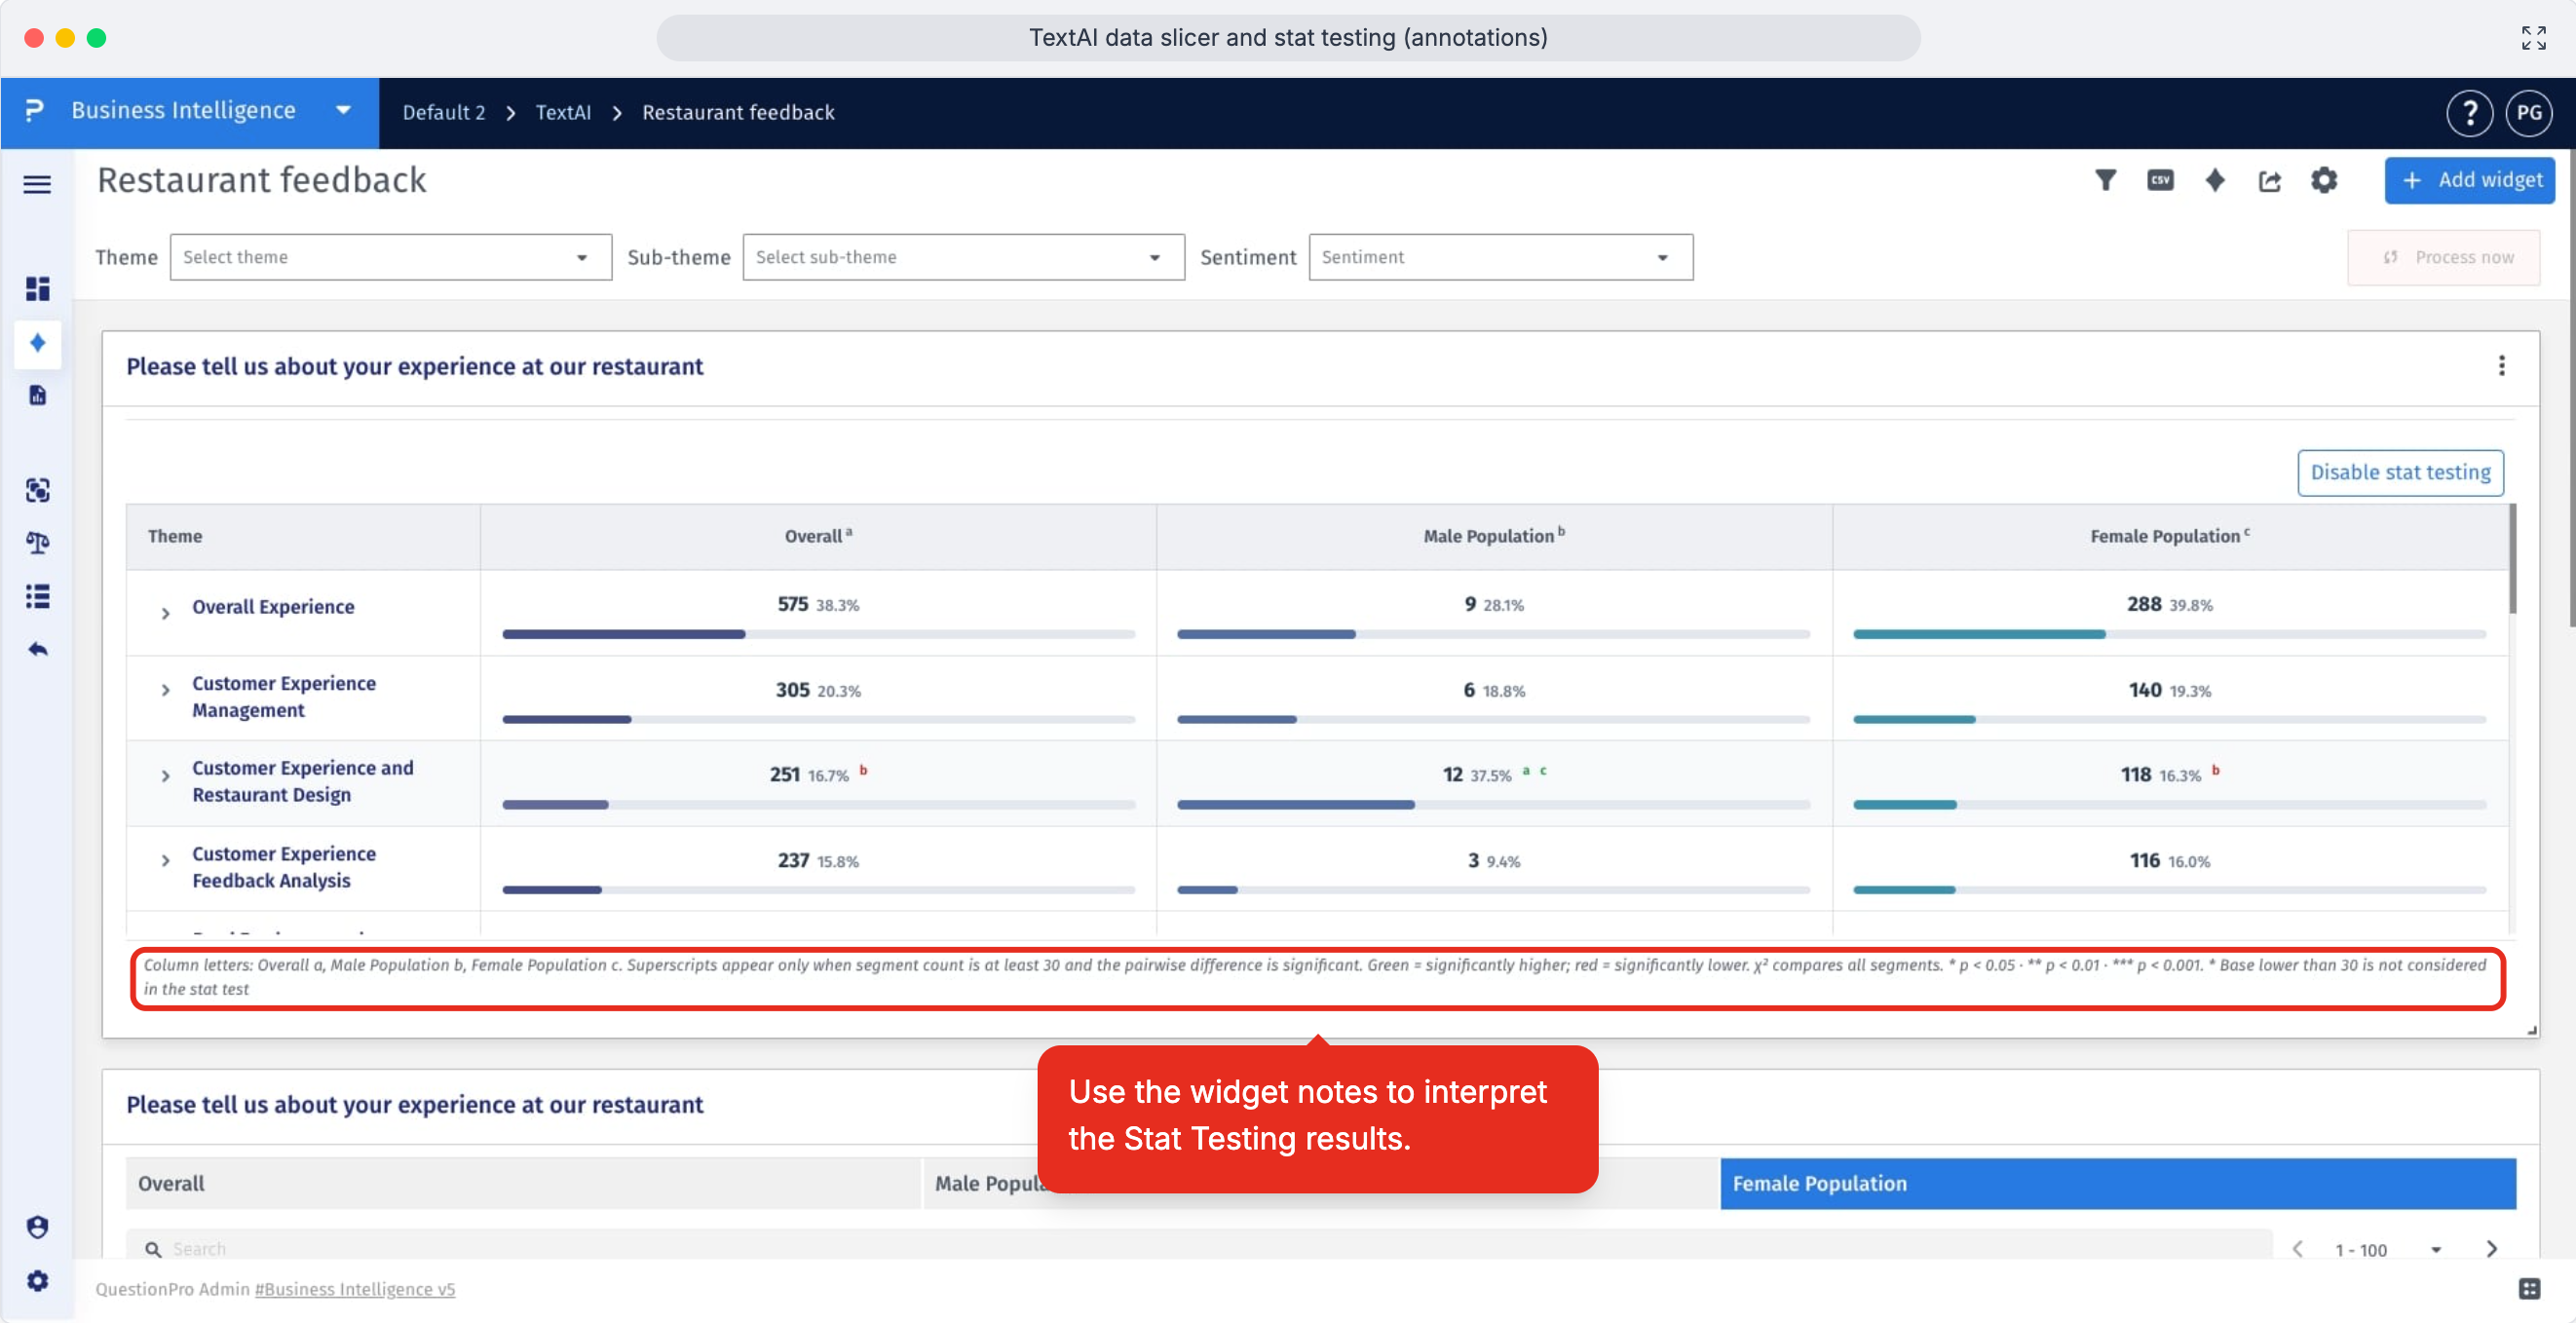
- Use the widget notes to interpret the Stat Testing results and understand what the markers or annotations mean for your comparison.
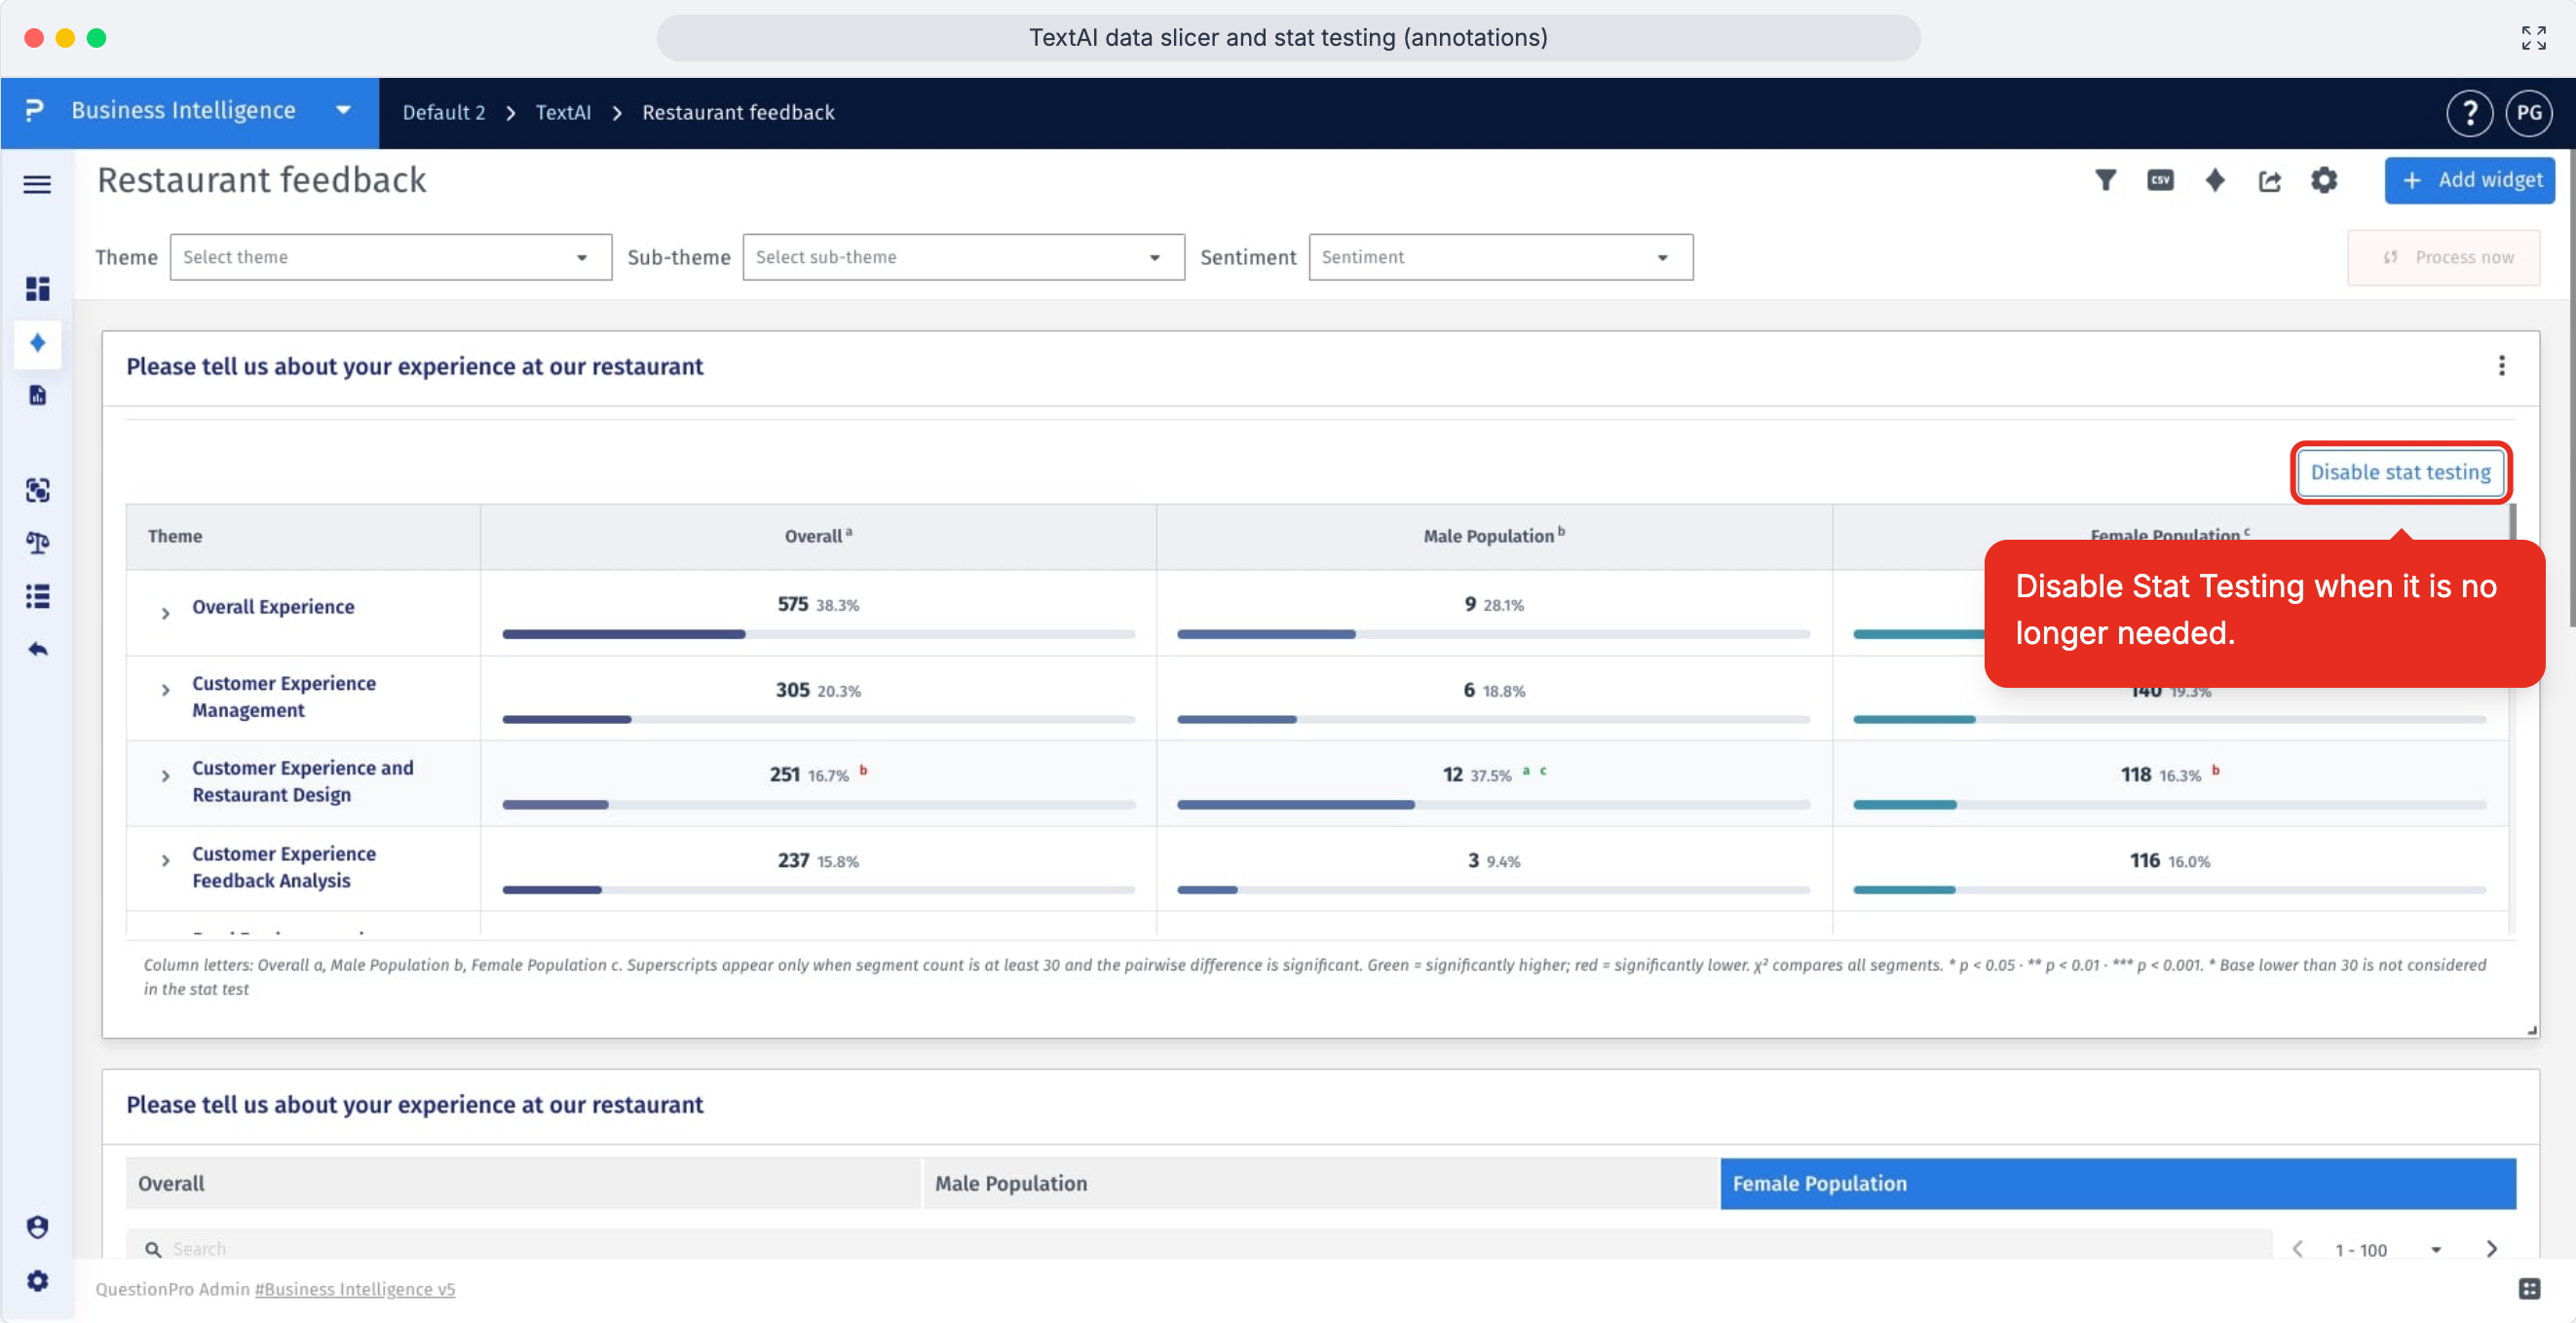
- Click Disable Stat Testing when you want to return the widget to the standard comparative chart view.
This feature is available with the following licenses :
Research Edition Communities Customer Experience Employee Experience University - Research Edition