


Bubble Chart Widget in TextAI
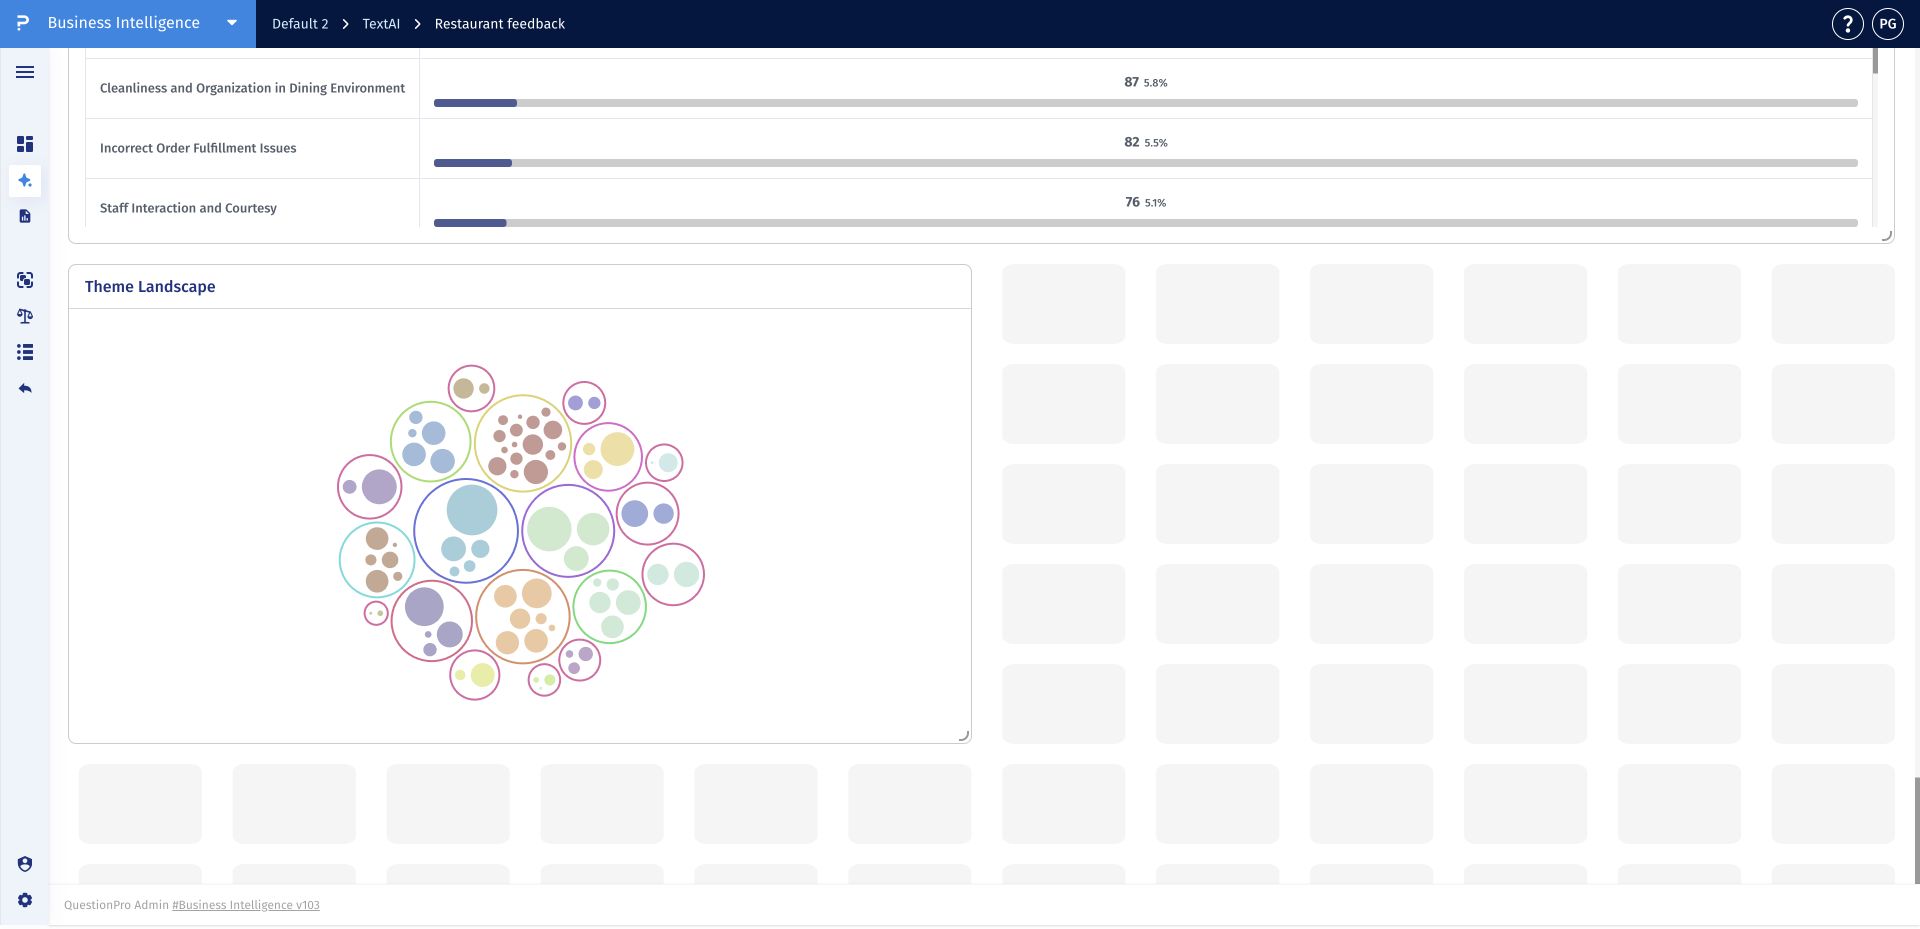
The Bubble chart widget provides a visual overview of the themes and related sub-themes found in an open-ended question. Grouped bubbles make it easier to scan the structure of the analysis and recognize which categories are more prominent without reading a detailed response table.
Use the chart as an exploratory view of the analysis structure. Larger bubbles indicate more prominent categories, while the grouping and labels help reveal how sub-themes relate to their parent themes.
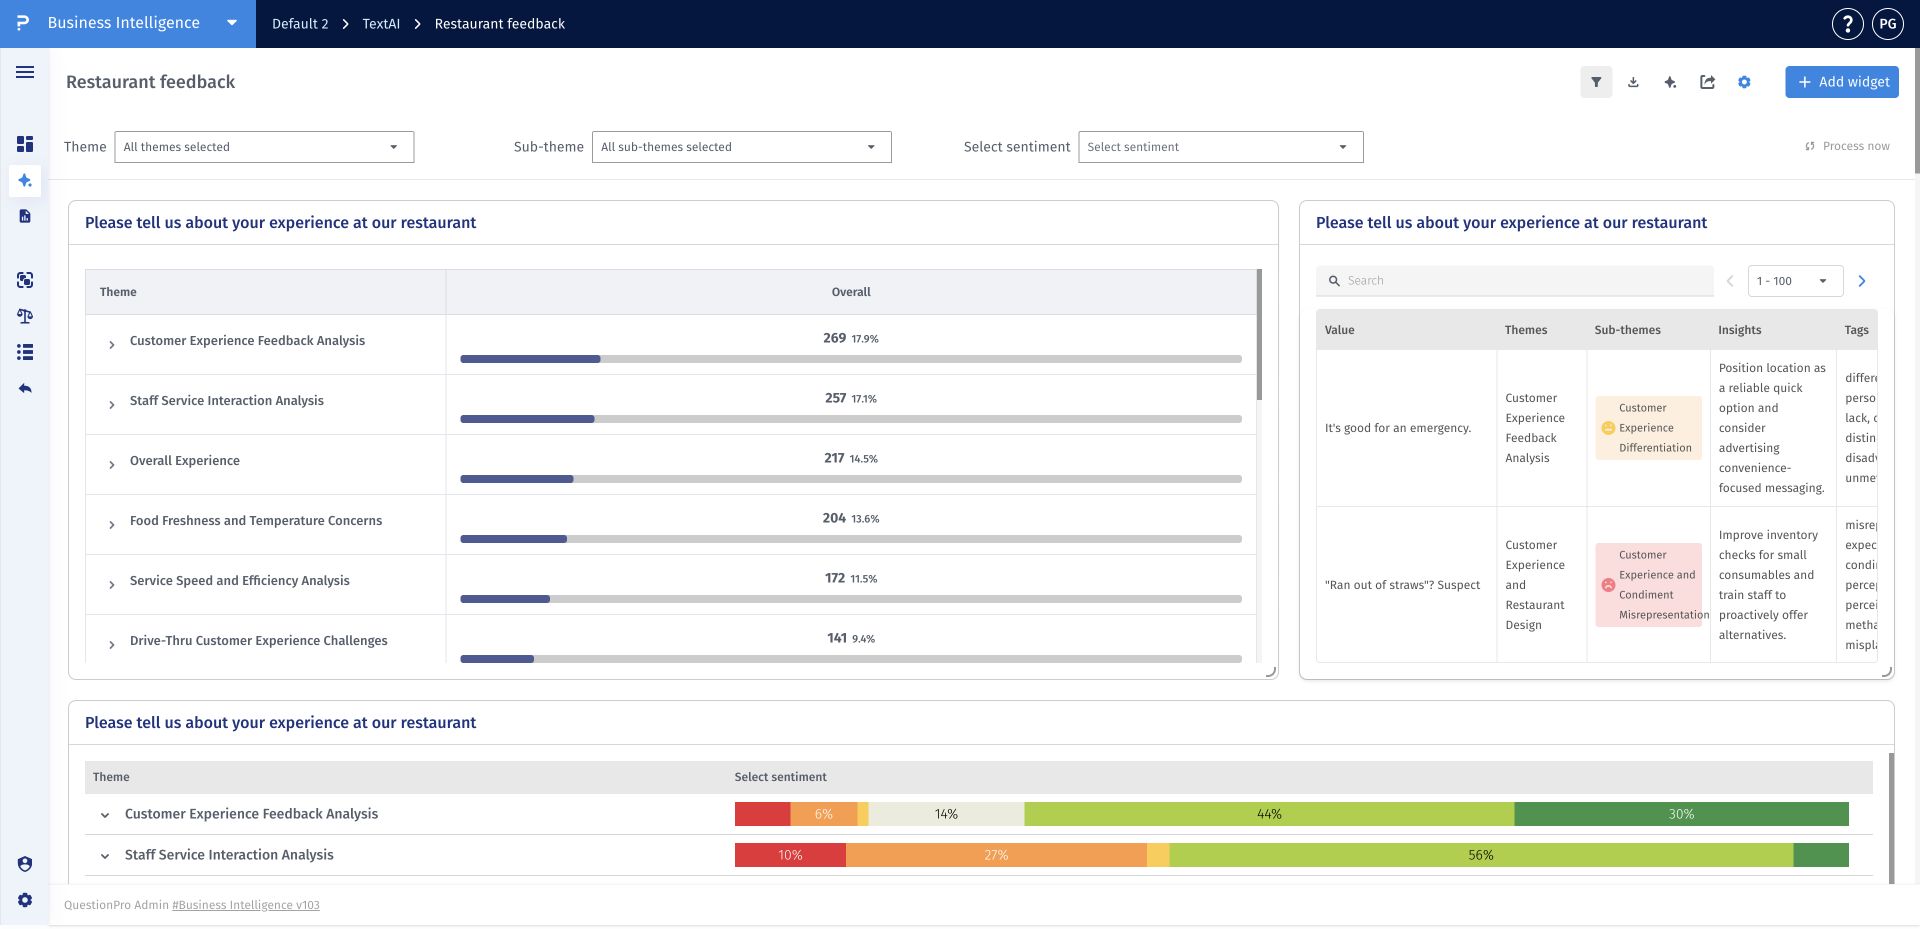
- Step 1: Open a TextAI dashboard and click Add widget.
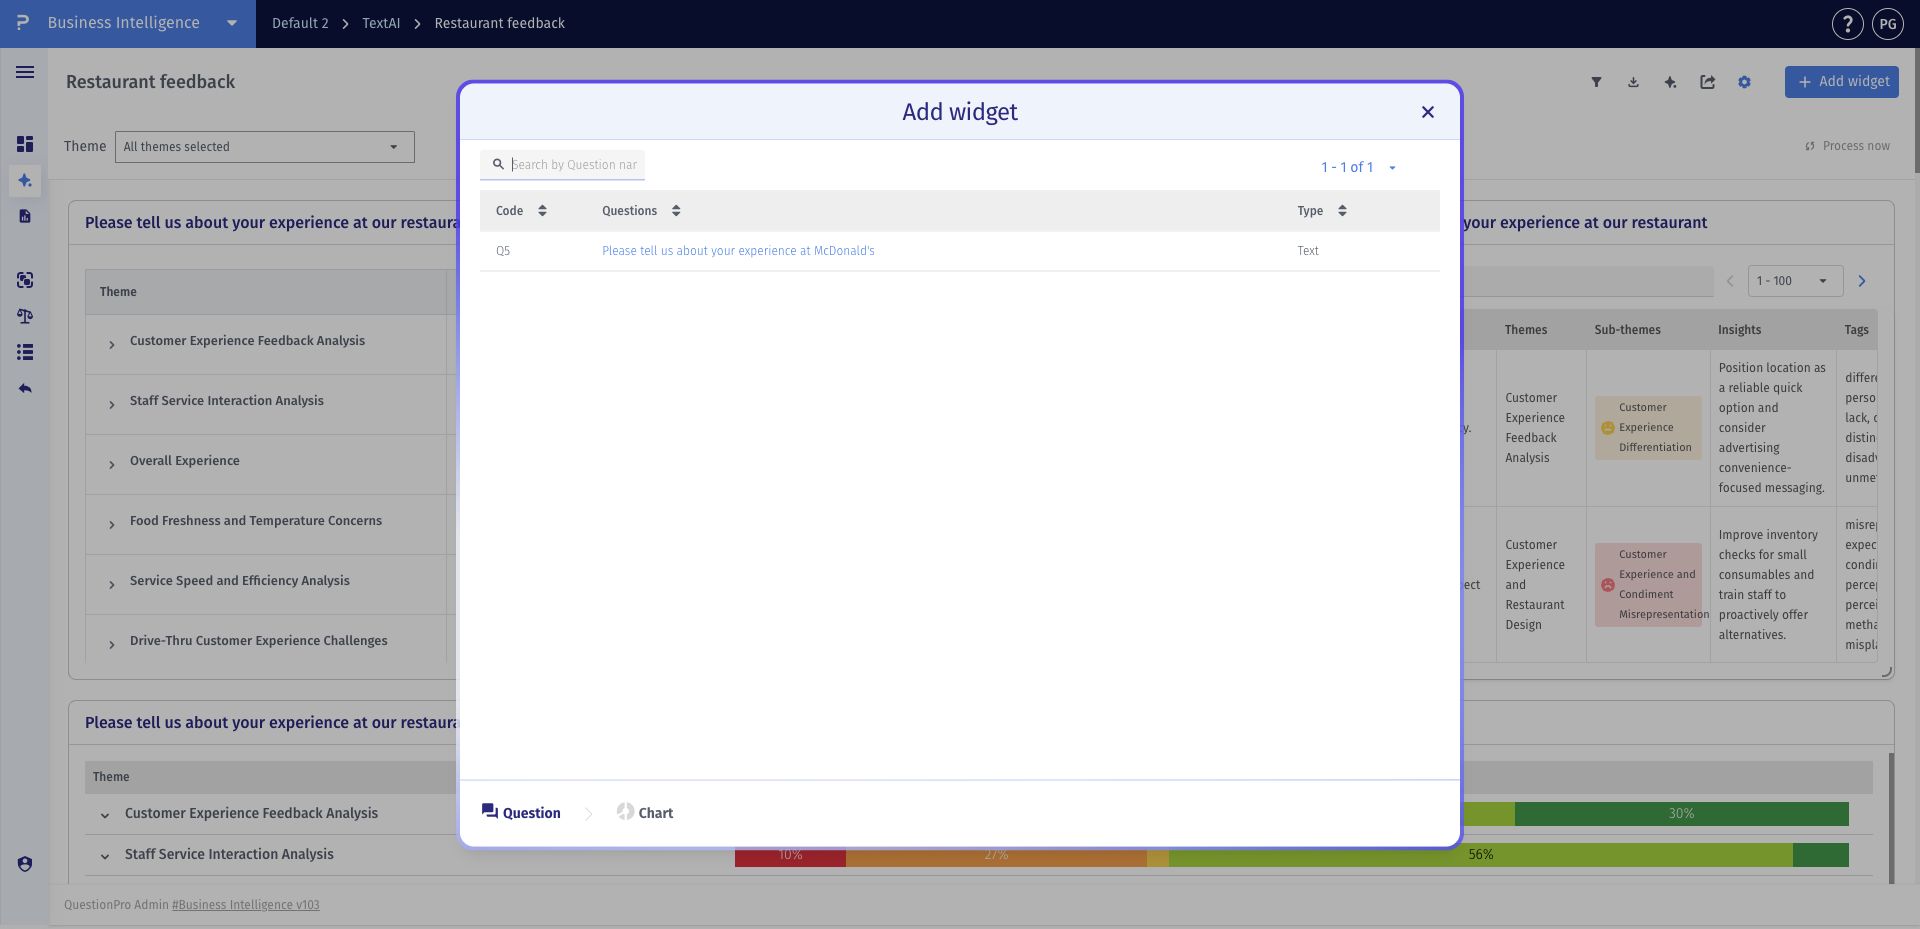
- Step 2: Select the open-ended question you want to explore.
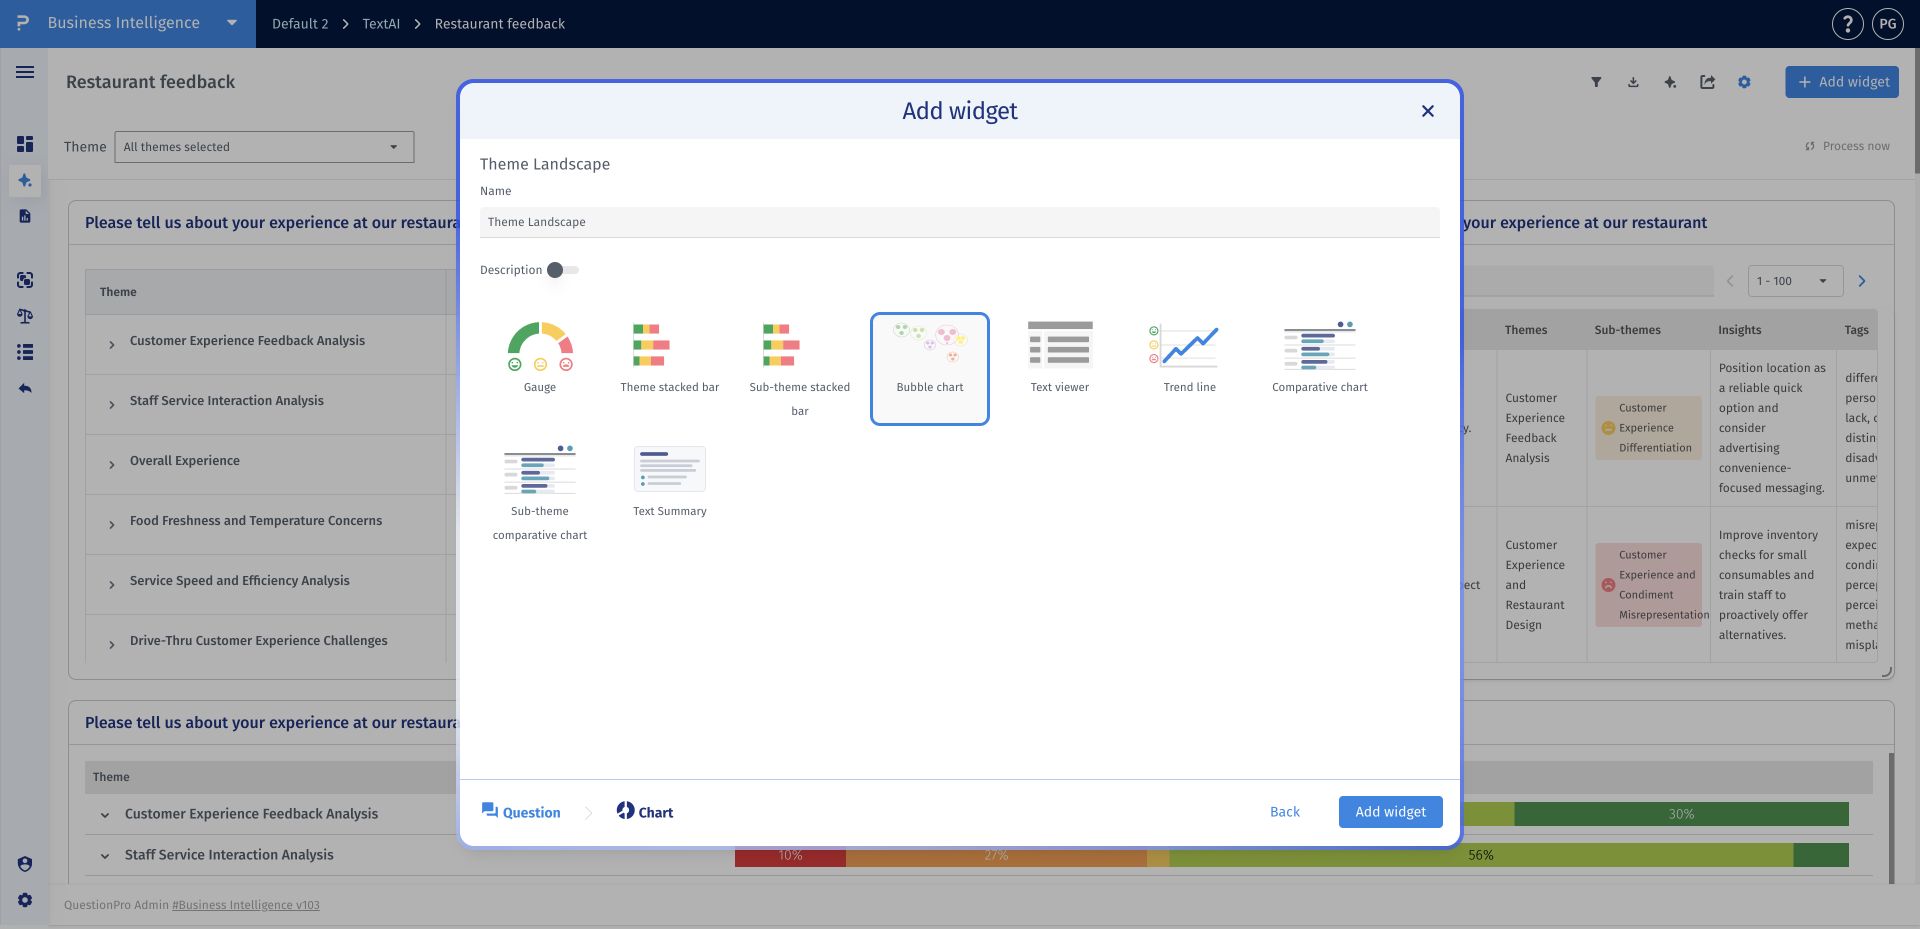
- Step 3: Choose Bubble chart, enter a clear widget name, and click Add widget.
- Step 4: Compare bubble sizes, colors, groupings, and labels to identify prominent themes and their related sub-themes.
How do I inspect the responses associated with a bubble?
Click a populated sub-theme bubble to open its matching responses. Use the original comments and coding to understand the pattern represented by that category.
Can the same response appear under different bubbles?
Yes. A response discussing several issues can be assigned to more than one theme or sub-theme. Matching response groups can overlap, so do not add them together as if they were mutually exclusive.
What is the difference between themes and sub-themes in this view?
Themes group broad topics in the feedback. Sub-themes identify more specific issues within those topics. Review the category label and underlying responses to understand the level of detail represented by a bubble.
How can I verify a pattern before sharing it?
Inspect the relevant bubble's response view and compare the pattern with the comparative charts or Text Viewer for the same question and scope. Use the original feedback to support the conclusion you report.
This feature is available with the following licenses :
Research Edition Communities Customer Experience Employee Experience University - Research Edition
