

- Community Settings
- Survey Opt-Out for Members
- Security
- Facebook setup
- LinkedIn setup
- Google setup
- Twitch setup
- Social login
- Mobile app - privacy policy
- HMAC
- External passback
- Google Analytics
- Survey swipe
- Communities Authentication - SAML SSO
- Merge all Pending Surveys
- Regional Sign Ups
- User Roles and Permissions
- Data Sharing Options
- Login Authentication
- Global community member profile
- Profiling surveys
- Default surveys
- Global community profile - settings
- Hidden field
- Move profile fields
- Profile fields - survey integration
- Profile sync
- Confidence score
- Import Profile Data
- Profile Groups
- Default Surveys 2.0
- Profiling Surveys 2.0
- Member Profile Fields 2.0
- Send new invitation
- Multiple Responses (Email/SMS)
- SMS pricing
- Survey authentication
- Send Invitation Multilingual
- New invitation profile exclusion
- Custom filter by member ID
- Send later
- Profile field mapping
- Automatic Closure
- Survey Alias
- AI create
- Community WhatsApp Integration
- Whatsapp Integration for Community

Community Dashboard Report
The Community Dashboard Report brings together the information panel managers need to review recruitment, onboarding, research readiness, engagement, rewards, and member access. It helps you move from a high-level view of your panel to the member groups or activities that need closer attention.
Use the dashboard to understand whether recruitment is meeting your goals, whether members have the profile information needed for upcoming studies, which activities attract participation, and where follow-up may improve the member experience. The report supports your decisions; review the relevant member or activity details before taking action.Watch this video to see how to review member health, recruitment sources, profile readiness, engagement, rewards, and session activity.
Click to download the videoGo to: Communities » My Communities » Select your community » Analytics » Community Dashboard
Start with the member summary cards at the top of the page, then select the tab relevant to your task:- Member acquisition and profile readiness: Review recruitment sources and the completeness of member profile information.
- Member engagements: Review activity breakdowns, participation trends, activity timing, and engagement rankings.
- Rewards: Review approval requests, inventory, redemption, and the top-earner highlight.
- Sessions: Review portal and mobile app activity, trends, and distinct members by channel.
Open Analytics in your selected community.
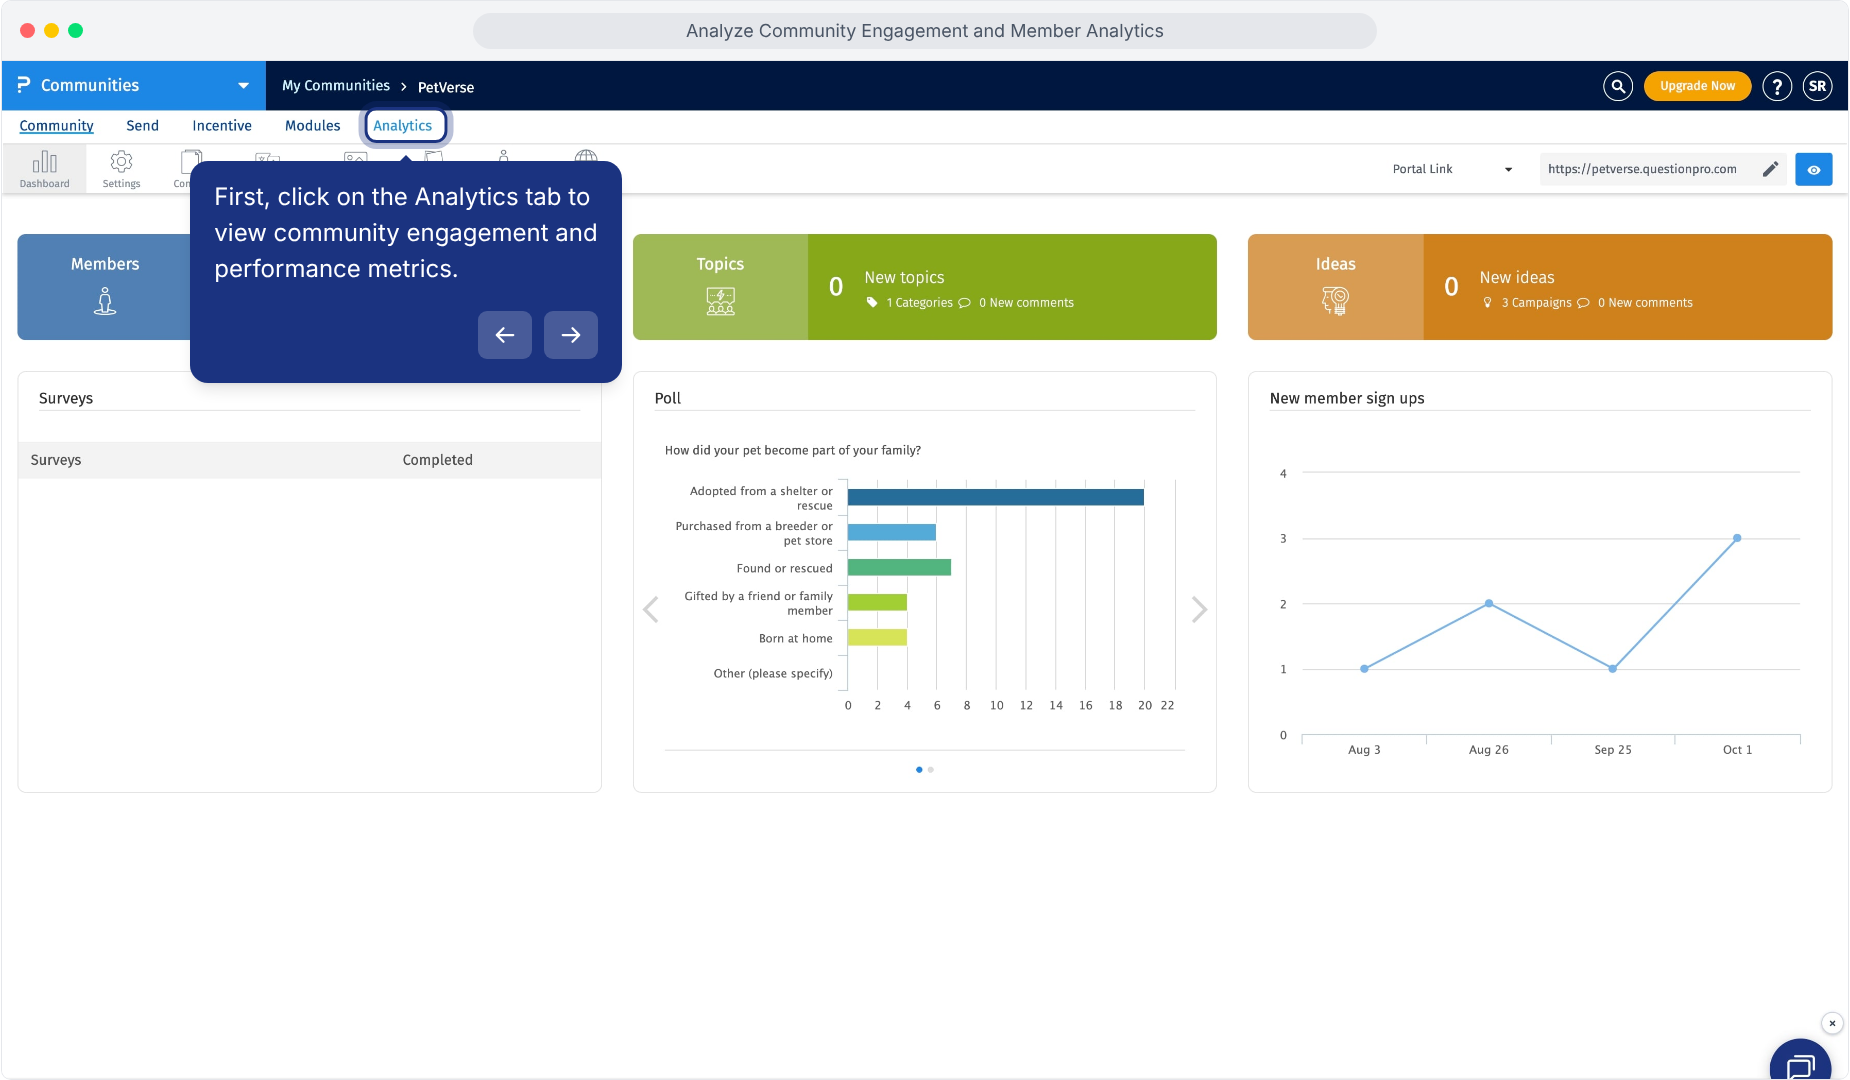
Review the Community dashboard.
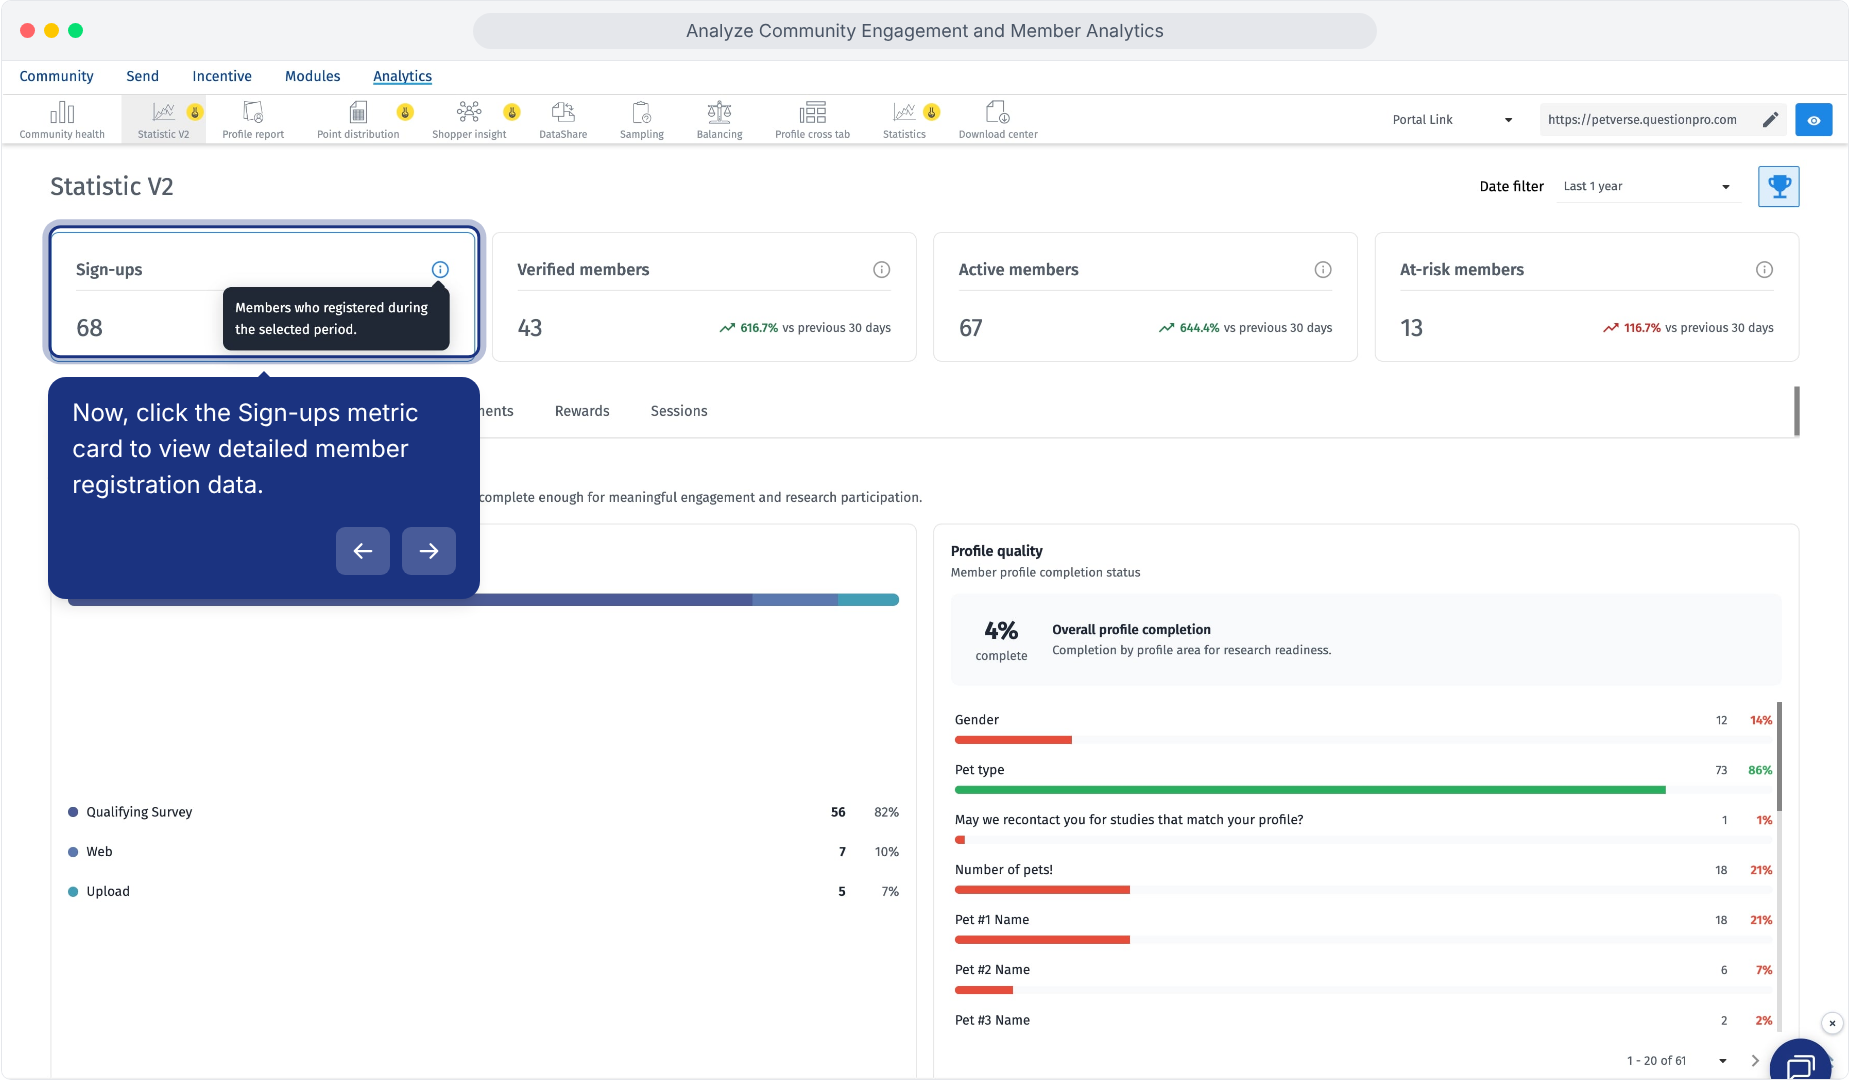
Open the Date filter and select Last 24 hours, Last 7 days, Last 30 days, Last 90 days, Last 1 year, or Custom range.
Choose the period based on the question you want to answer:- Recent activity: Use a short period to review new registrations, activity after a recent launch, or members needing operational follow-up.
- Monthly review: Use a monthly window to assess recruitment progress and participation alongside your activity calendar.
- Longer-term planning: Use a longer period to review broader recruitment and engagement patterns.
- Specific research wave: Use Custom range to focus on the dates relevant to that wave.
Select a reporting period from the Date filter.
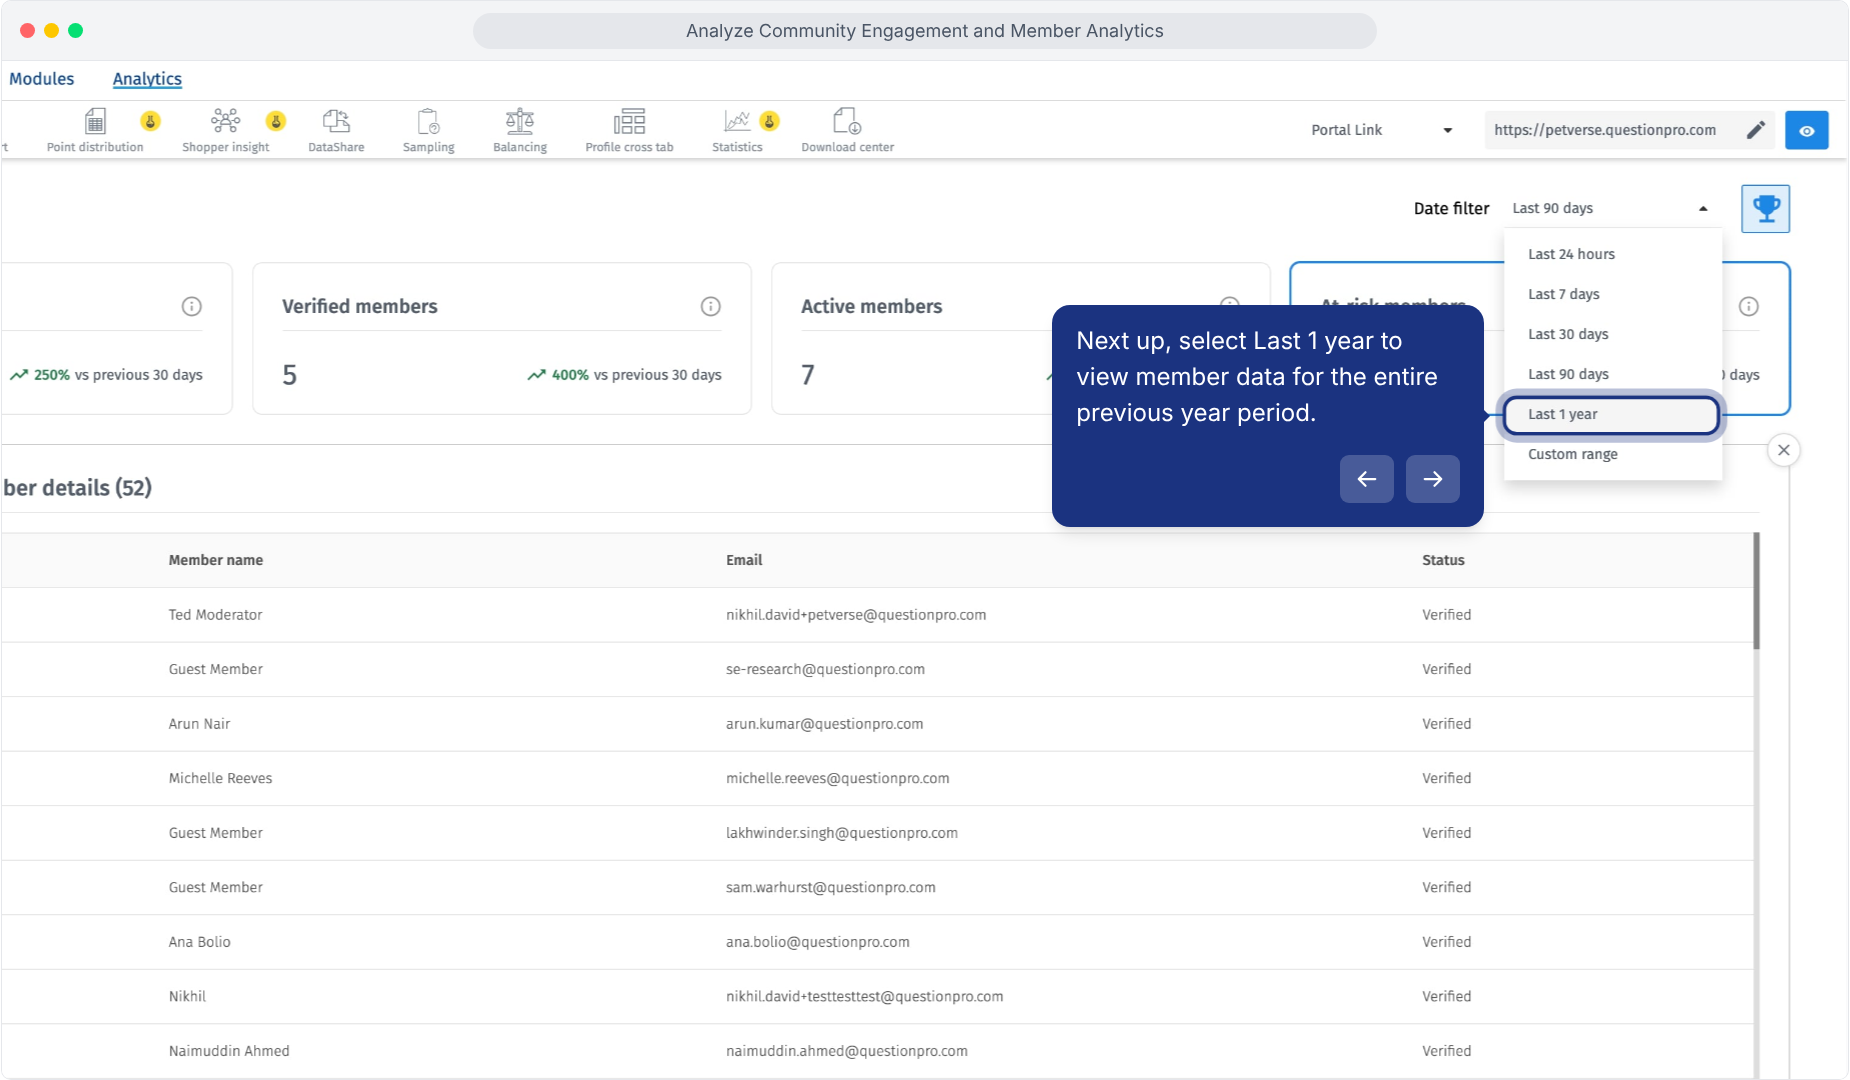
The summary cards provide a starting point for reviewing member growth and activity:
- Sign-ups: Members who registered during the selected period. Compare this count with your recruitment goal and the recruitment activities carried out during that period.
- Verified members: Members whose email verification is complete. Use the associated list when reviewing onboarding progress. Verification alone does not establish study eligibility.
- Active members: Members with at least one recorded activity during the selected period. Use this to understand the participating member group, then review engagement for more detail.
- At-risk members: Members with no recorded activity during the selected period. Review this group when planning re-engagement.
Select Verified members to review email verification.
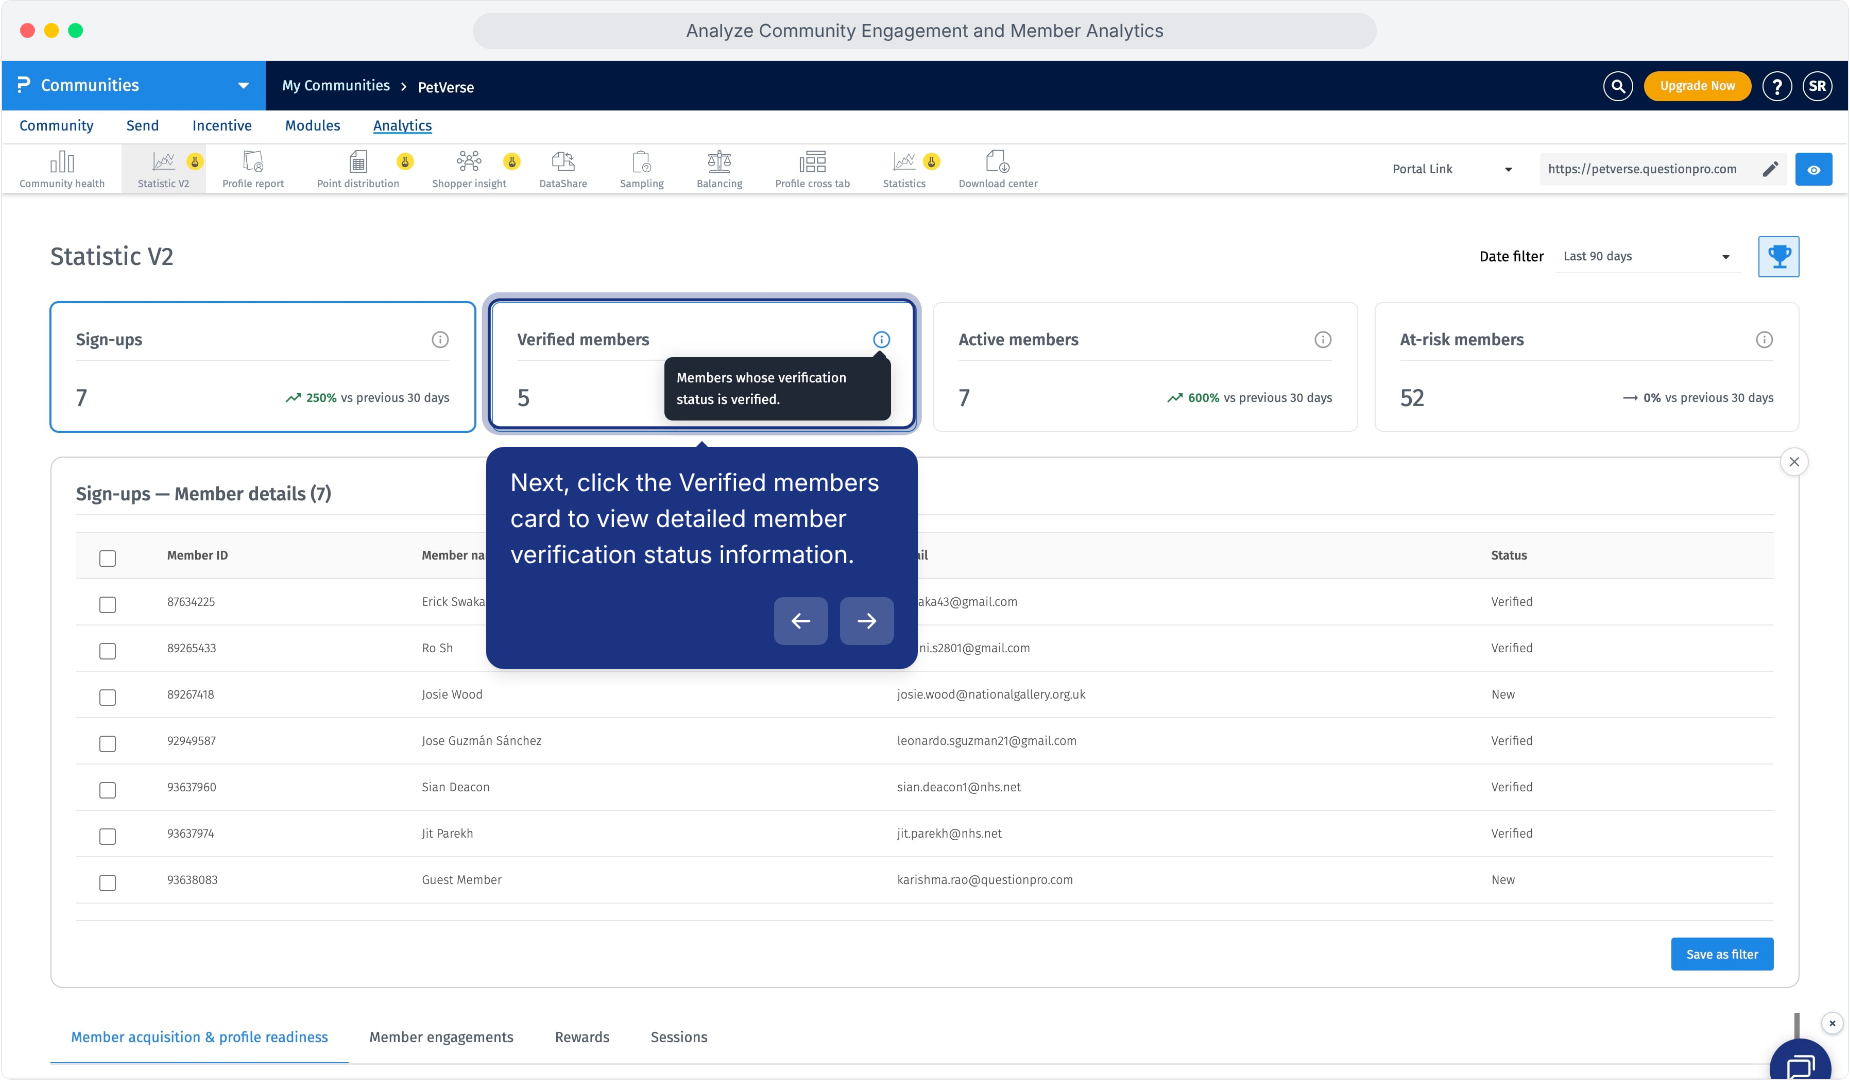
Select At-risk members to review members with no recorded activity.
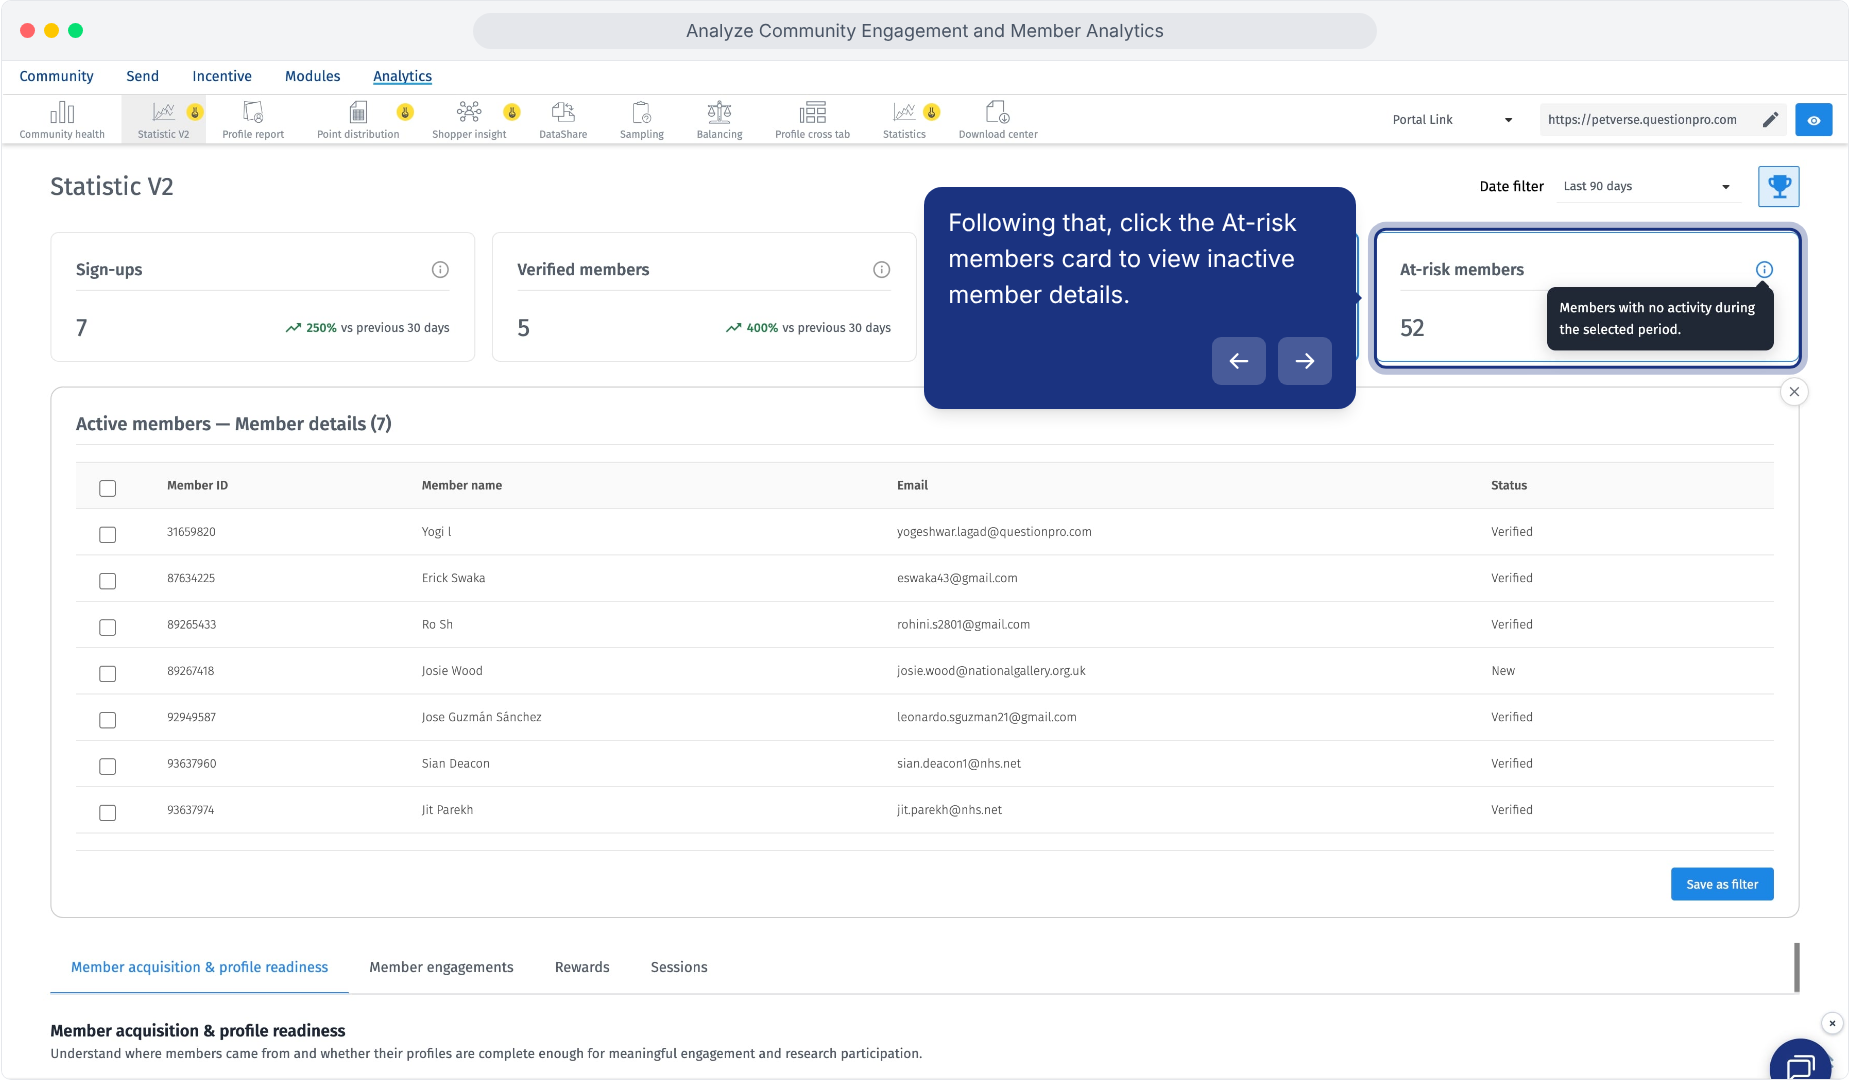
You can save a member selection from a summary card, recruitment source, or profile-field details list.
- Click the relevant card, source, or field to open its member-details list.
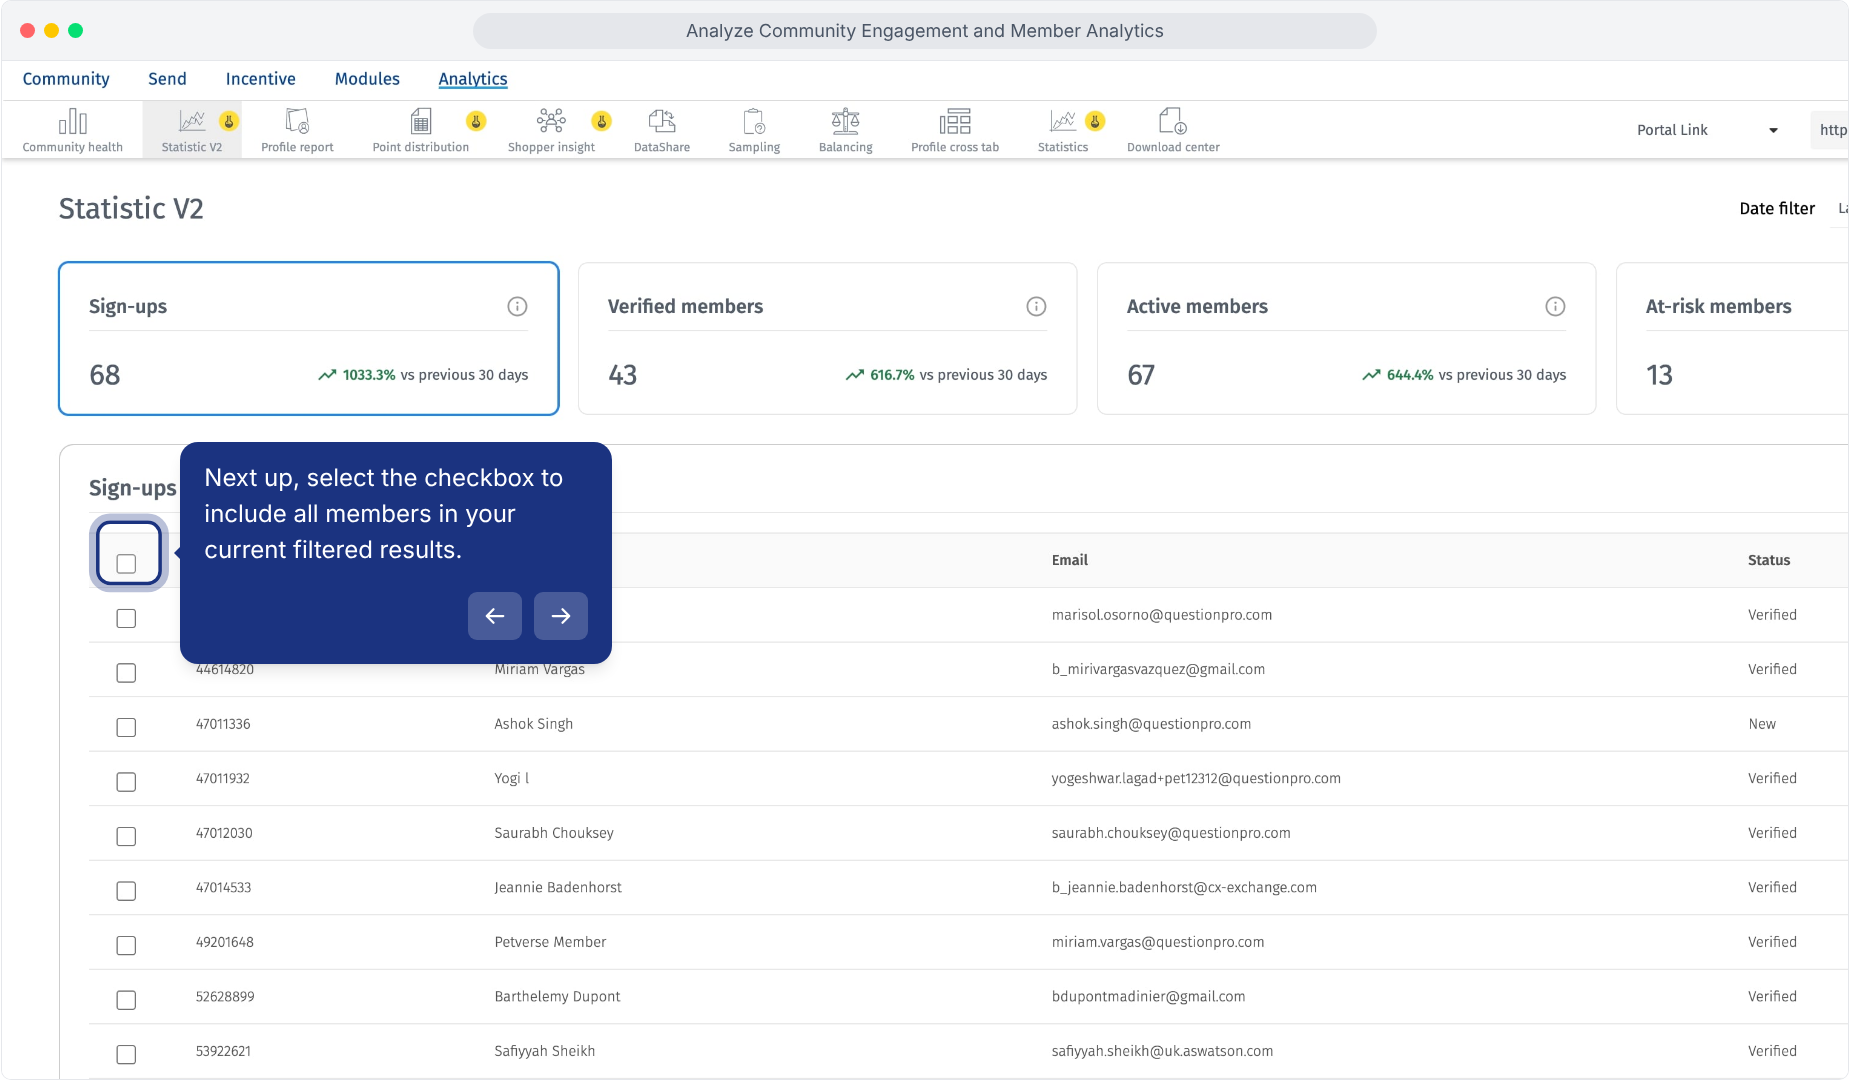
- Select individual members using the checkboxes, or use the header checkbox for the current list. Check the selected-member count.
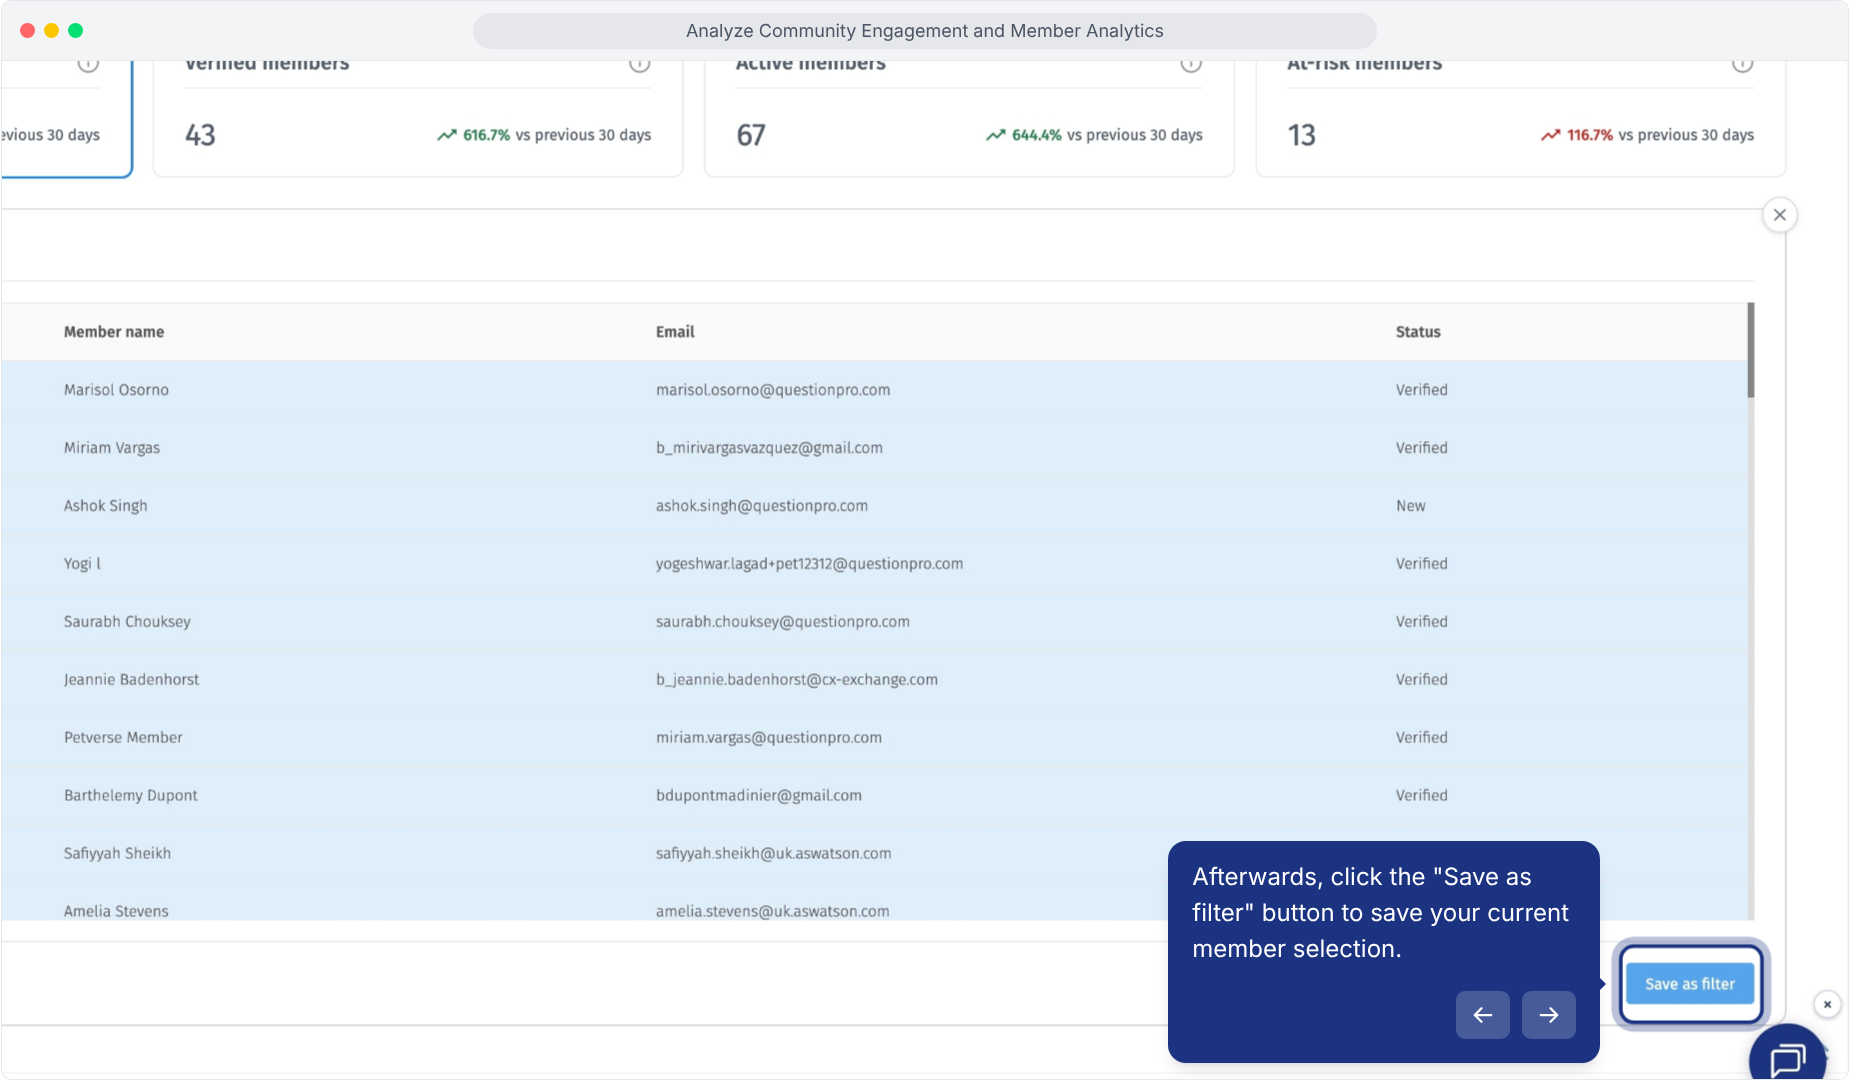
- Click Save as filter.
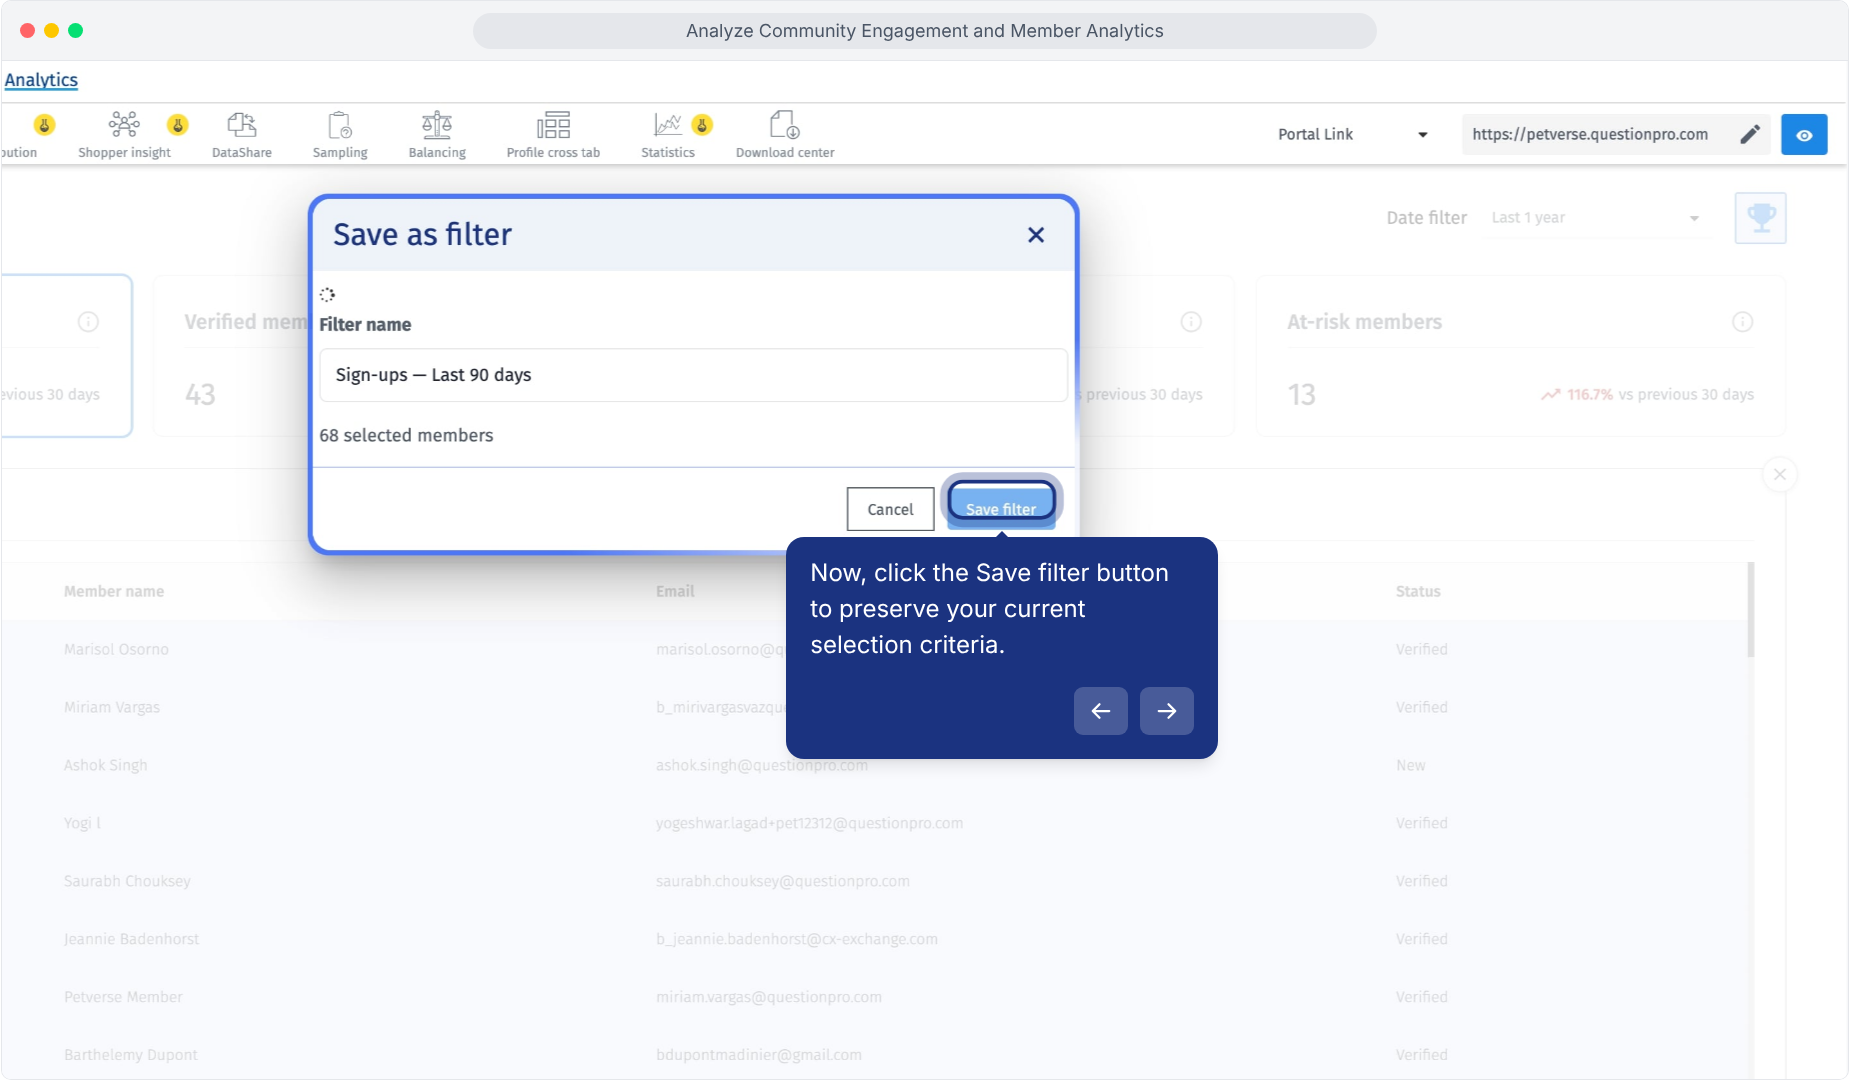
- Enter a descriptive Filter name, review the selection, and click Save filter.
Select members using the checkboxes.
Click Save as filter.
Name the filter and save your selection.
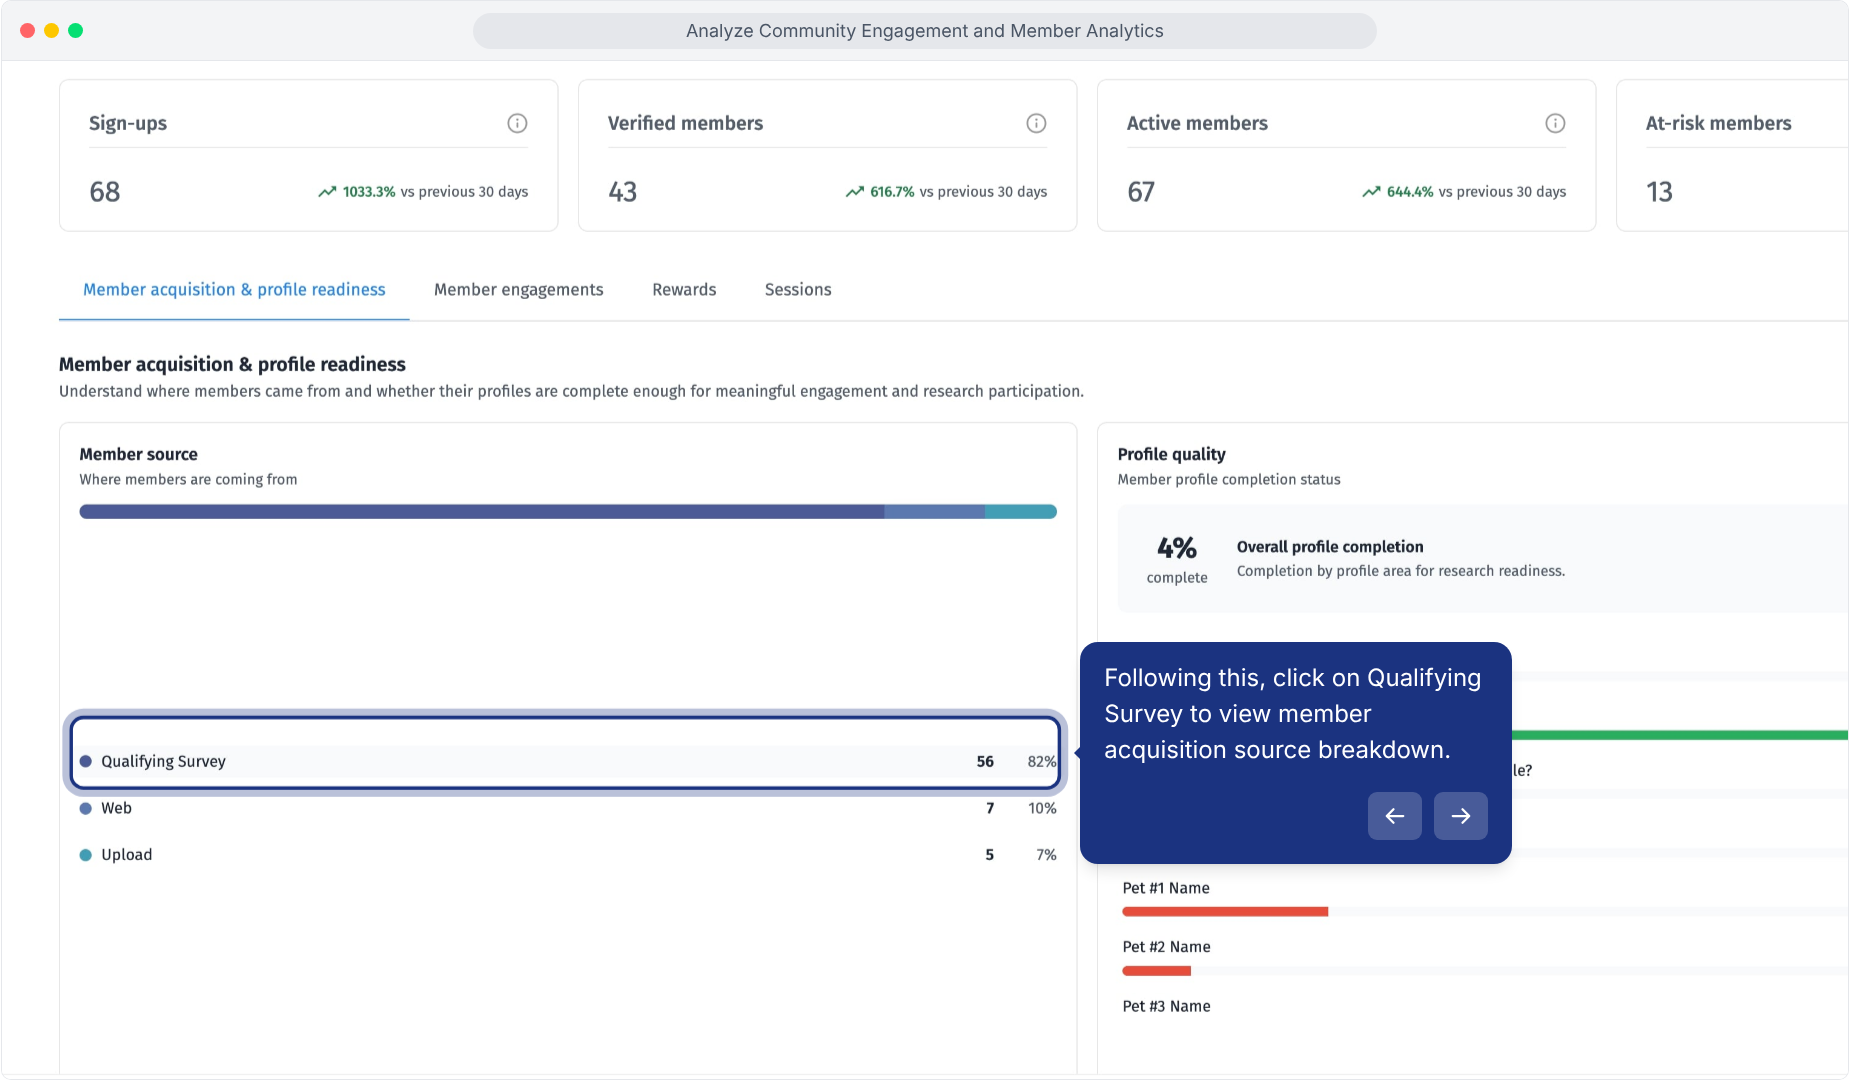
Open Member acquisition and profile readiness and review Member source. The chart displays member counts and percentages by source, including Web, Qualifying Survey, and Upload.
Click a source to view its associated members. Review the member details and statuses, and save a selection as a filter if you need to return to that group. Use this view to assess:- Which sources contribute most to recruitment during the selected period.
- Whether the panel depends heavily on one recruitment route.
- Which source groups need a closer onboarding or profile review.
Select a recruitment source from the source breakdown.
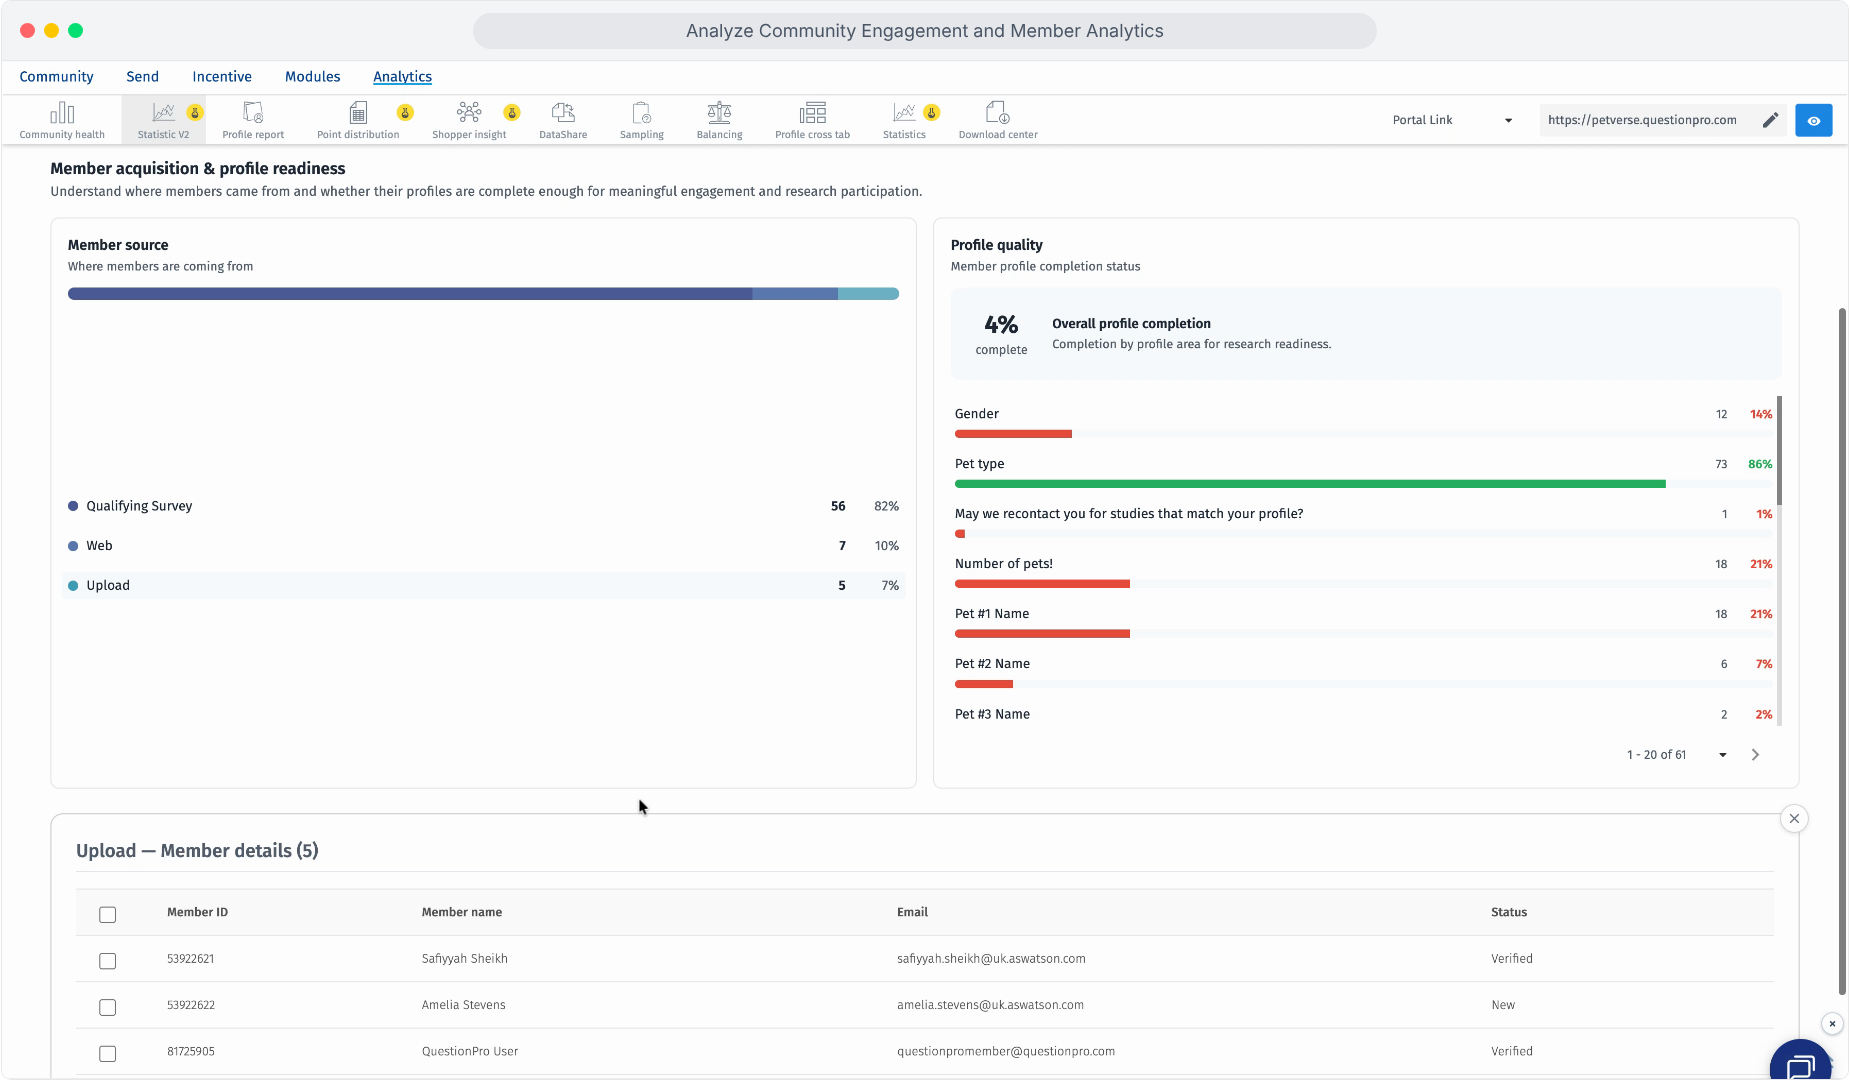
Inspect the members associated with the Upload source.
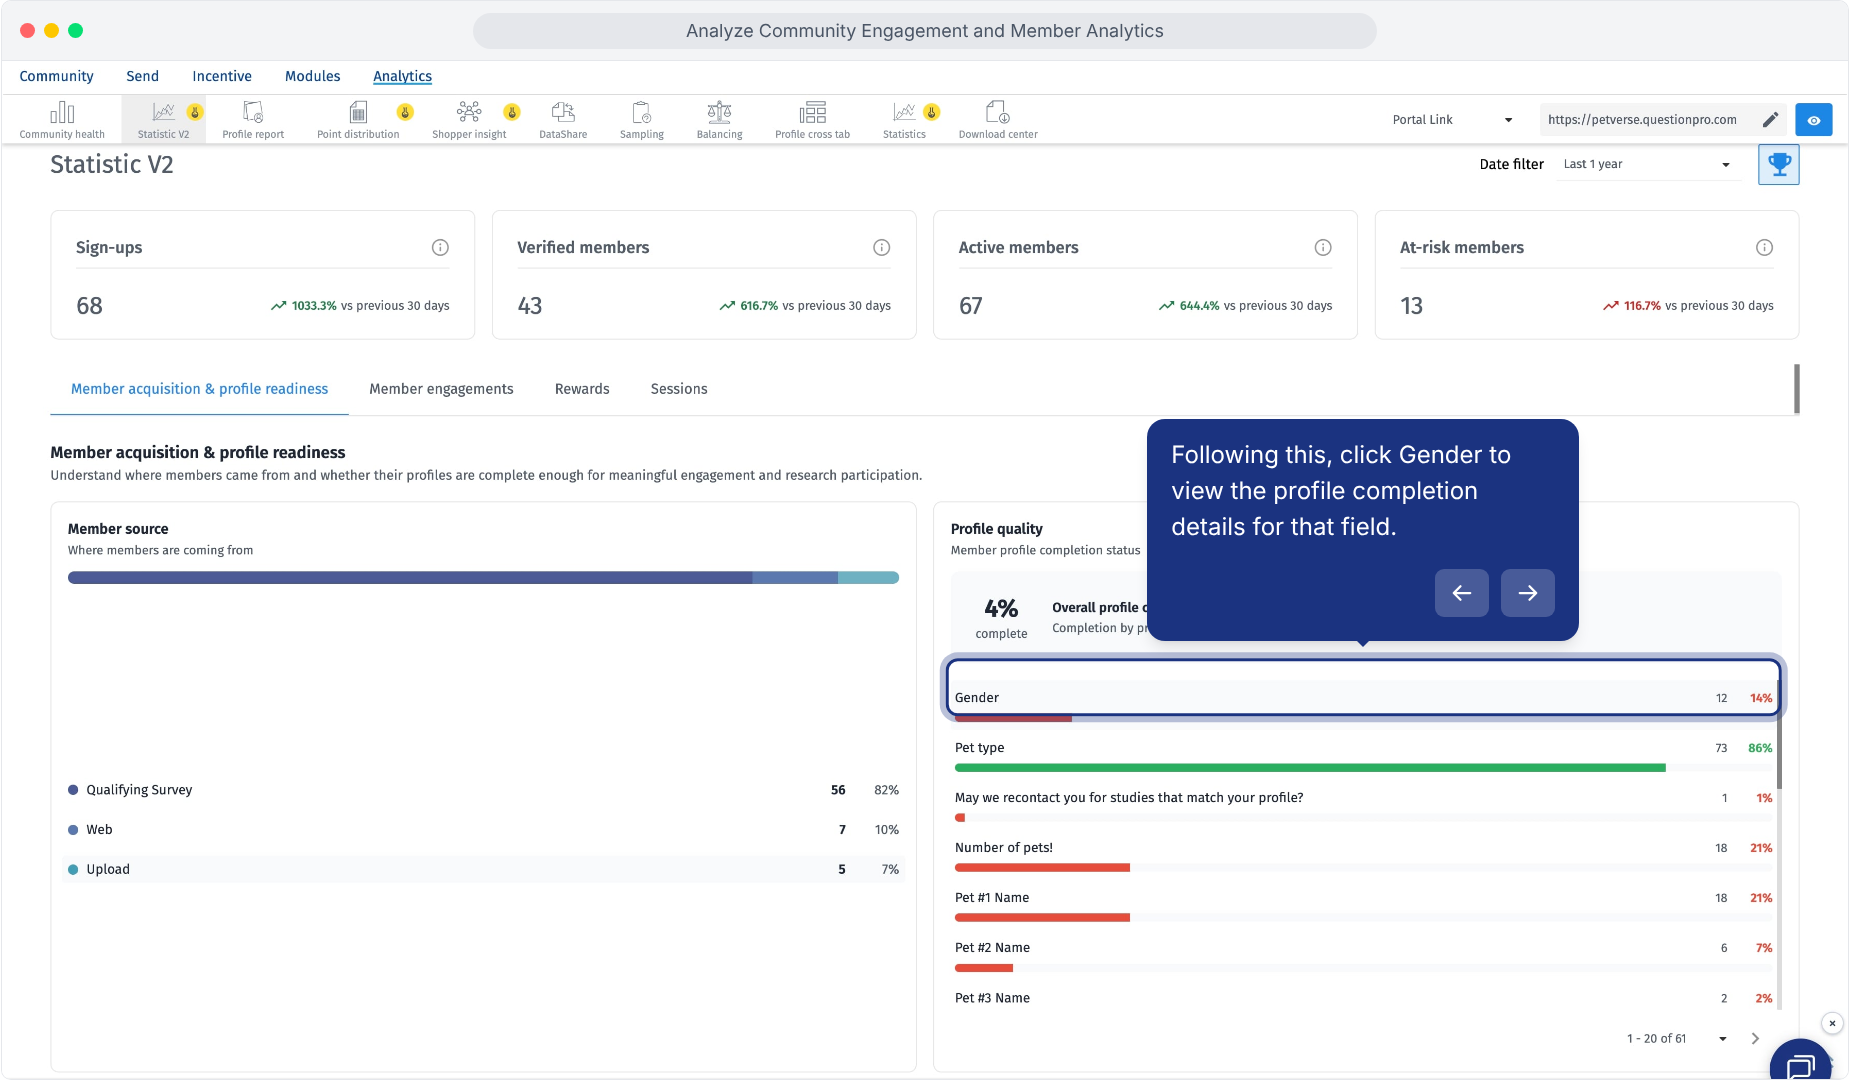
In Member acquisition and profile readiness, review the Profile quality panel.
- Overall profile completion: The overall completion percentage displayed for your community.
- Individual profile fields: Completion counts and percentages for the fields configured in your community.
Select a profile field to inspect its associated members.
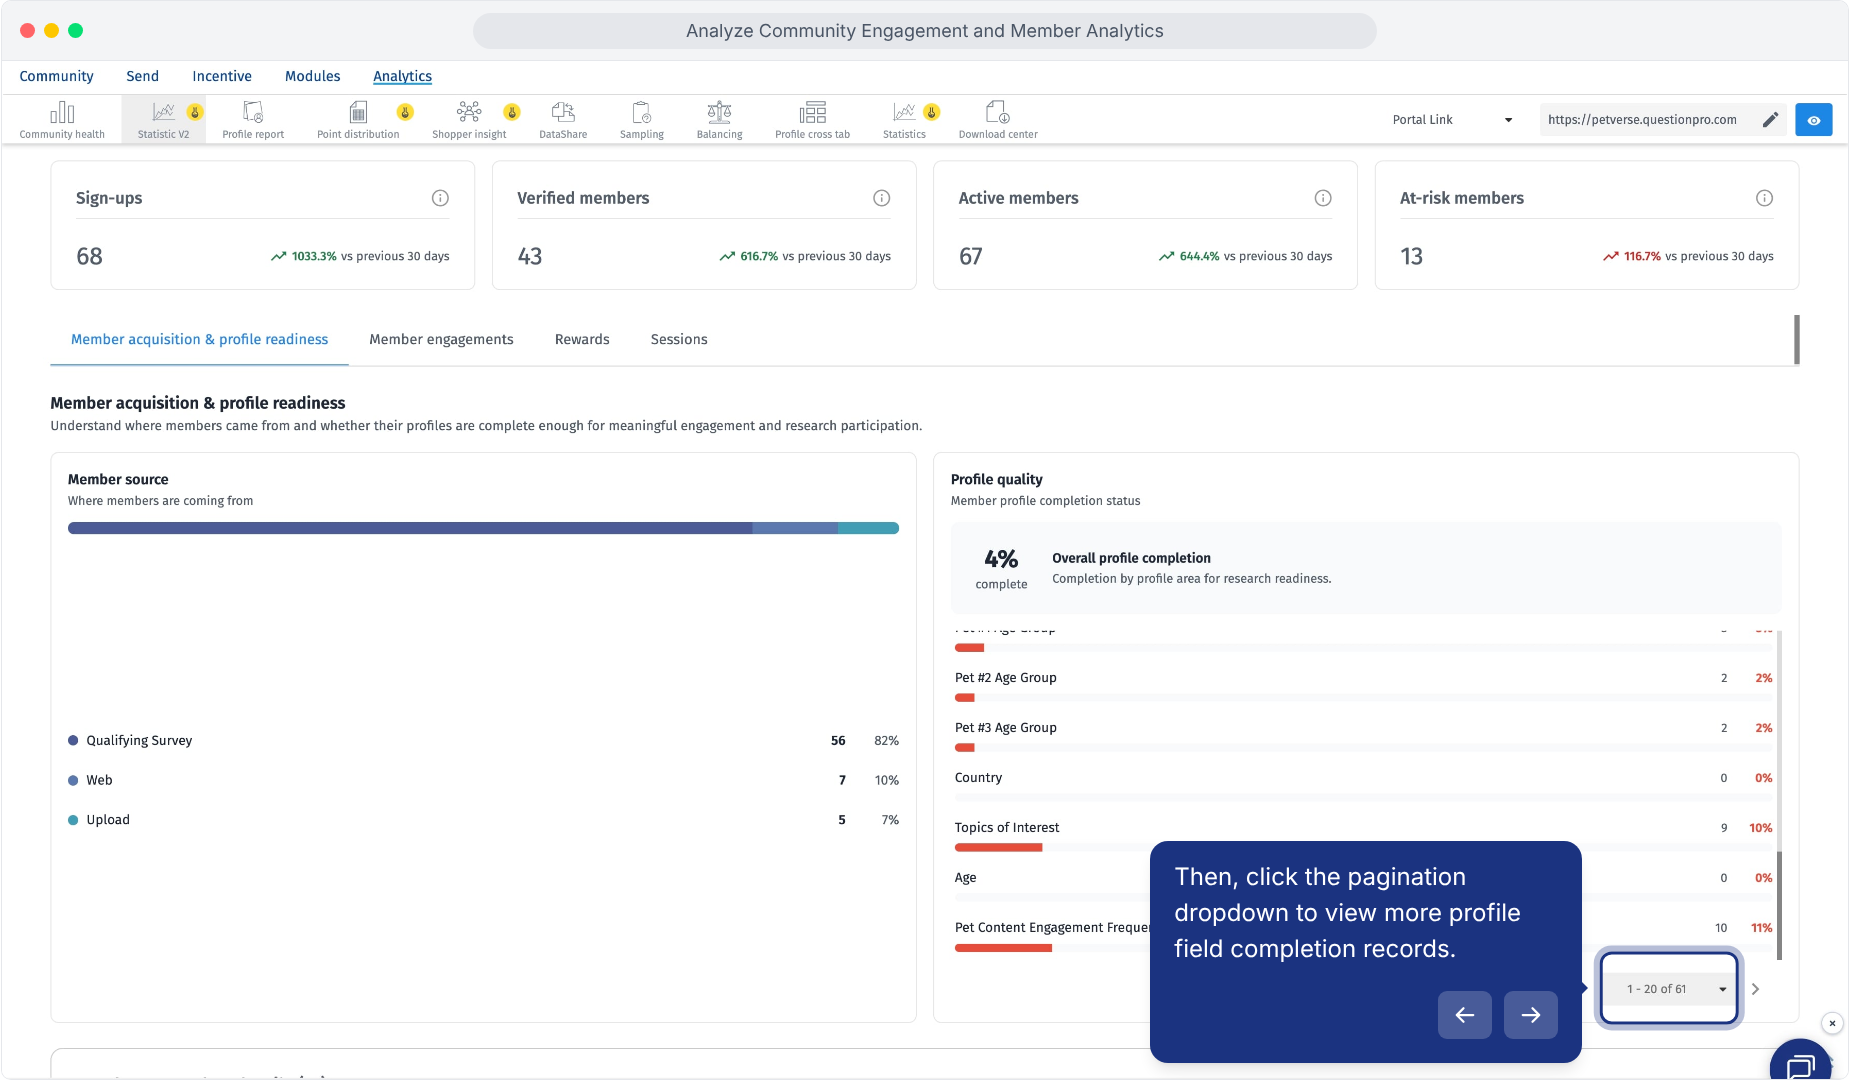
Use pagination to review more profile fields.
Review and select members in the profile-field details list.
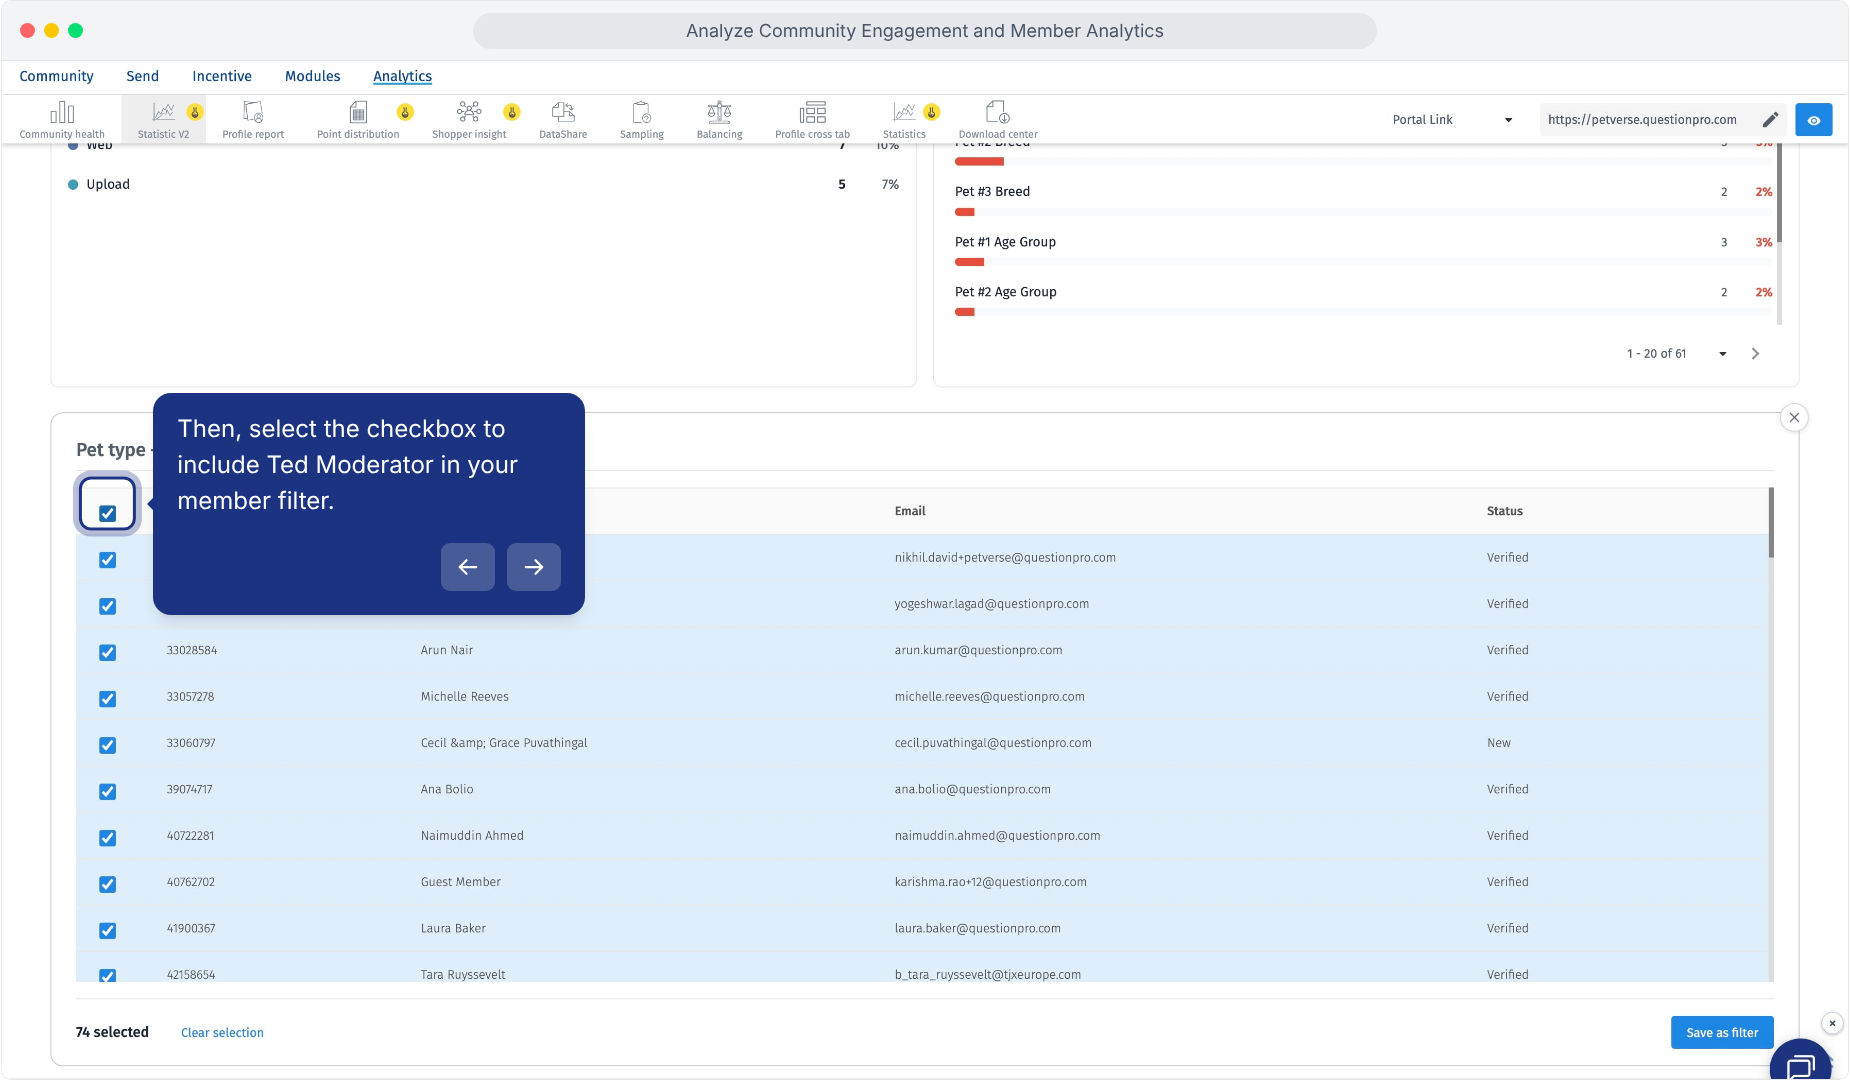
Open Member engagements and review the two main activity views:
- Activity Breakdown: Total recorded actions and their distribution across Surveys, Polls, Topics, and Ideaboards.
- Activity Trends: Participation over time for All activities or a selected activity type.
Review Activity Breakdown and the overall activity trend.
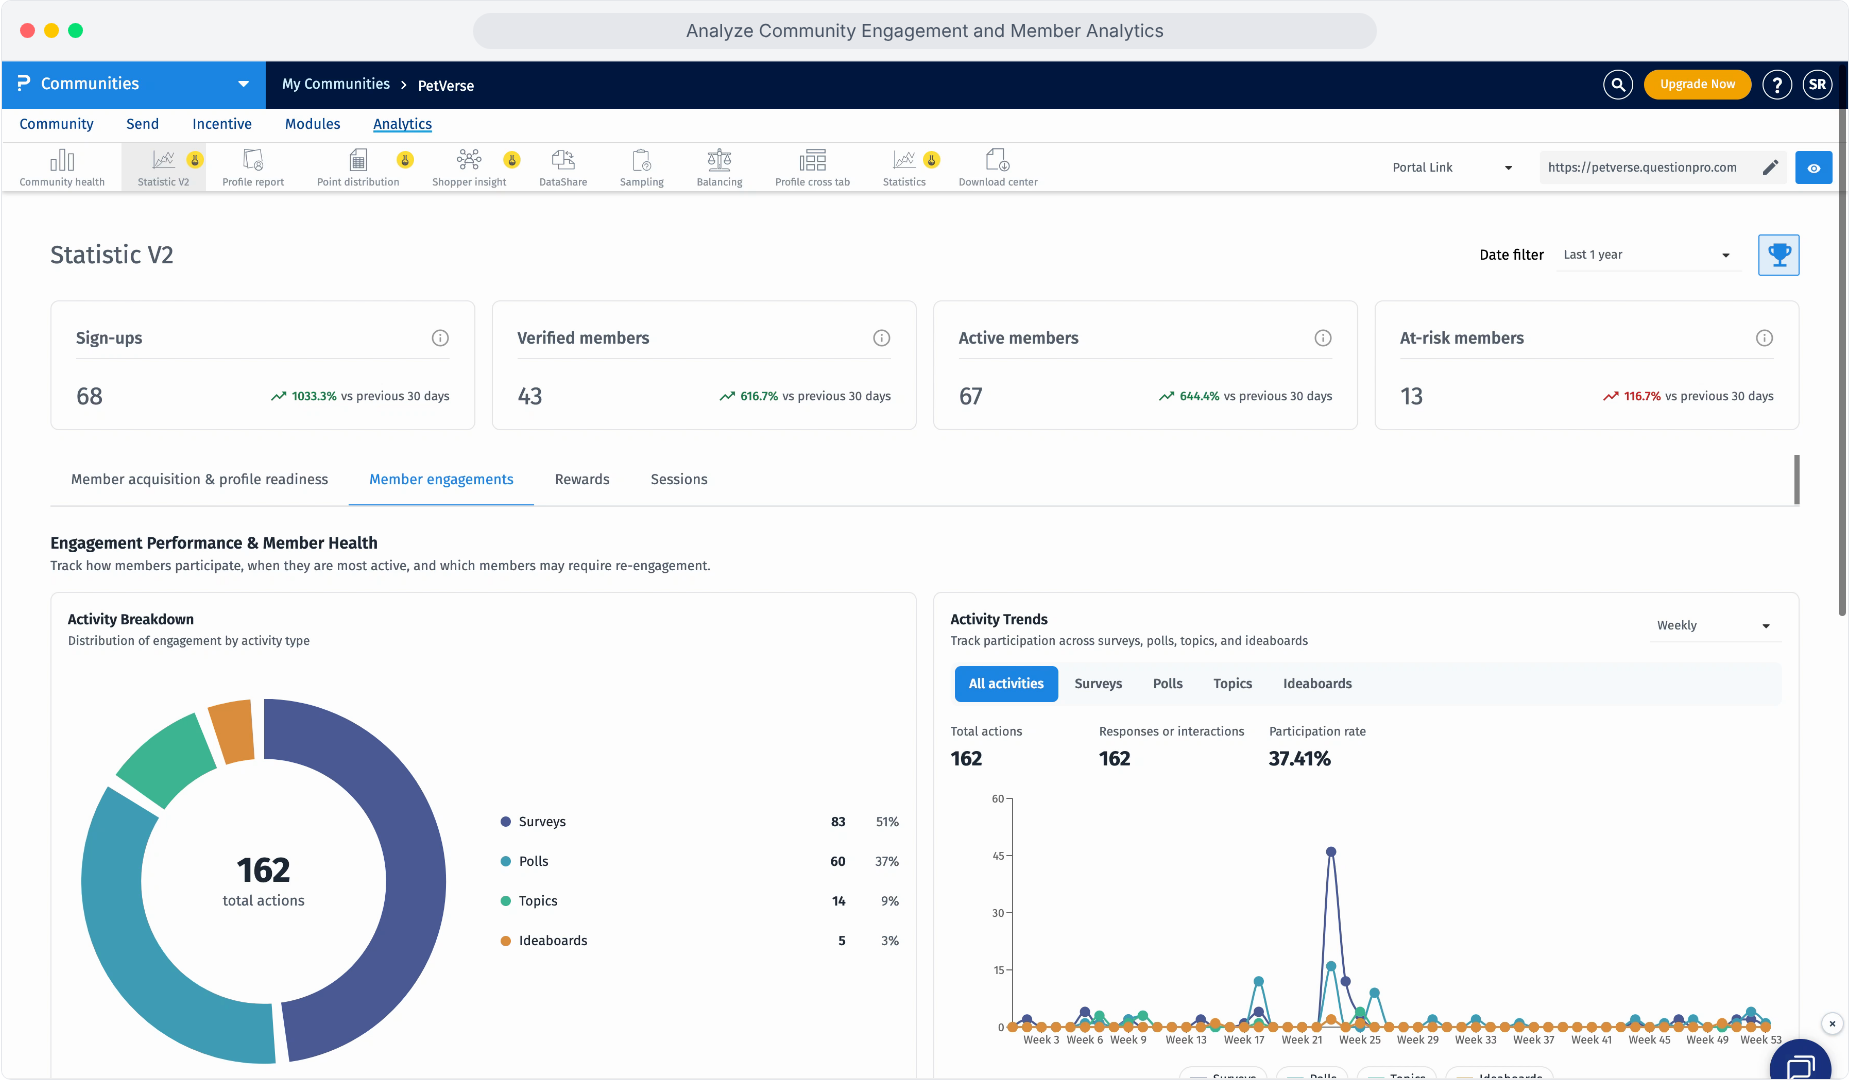
Change the Activity Trends chart grouping.
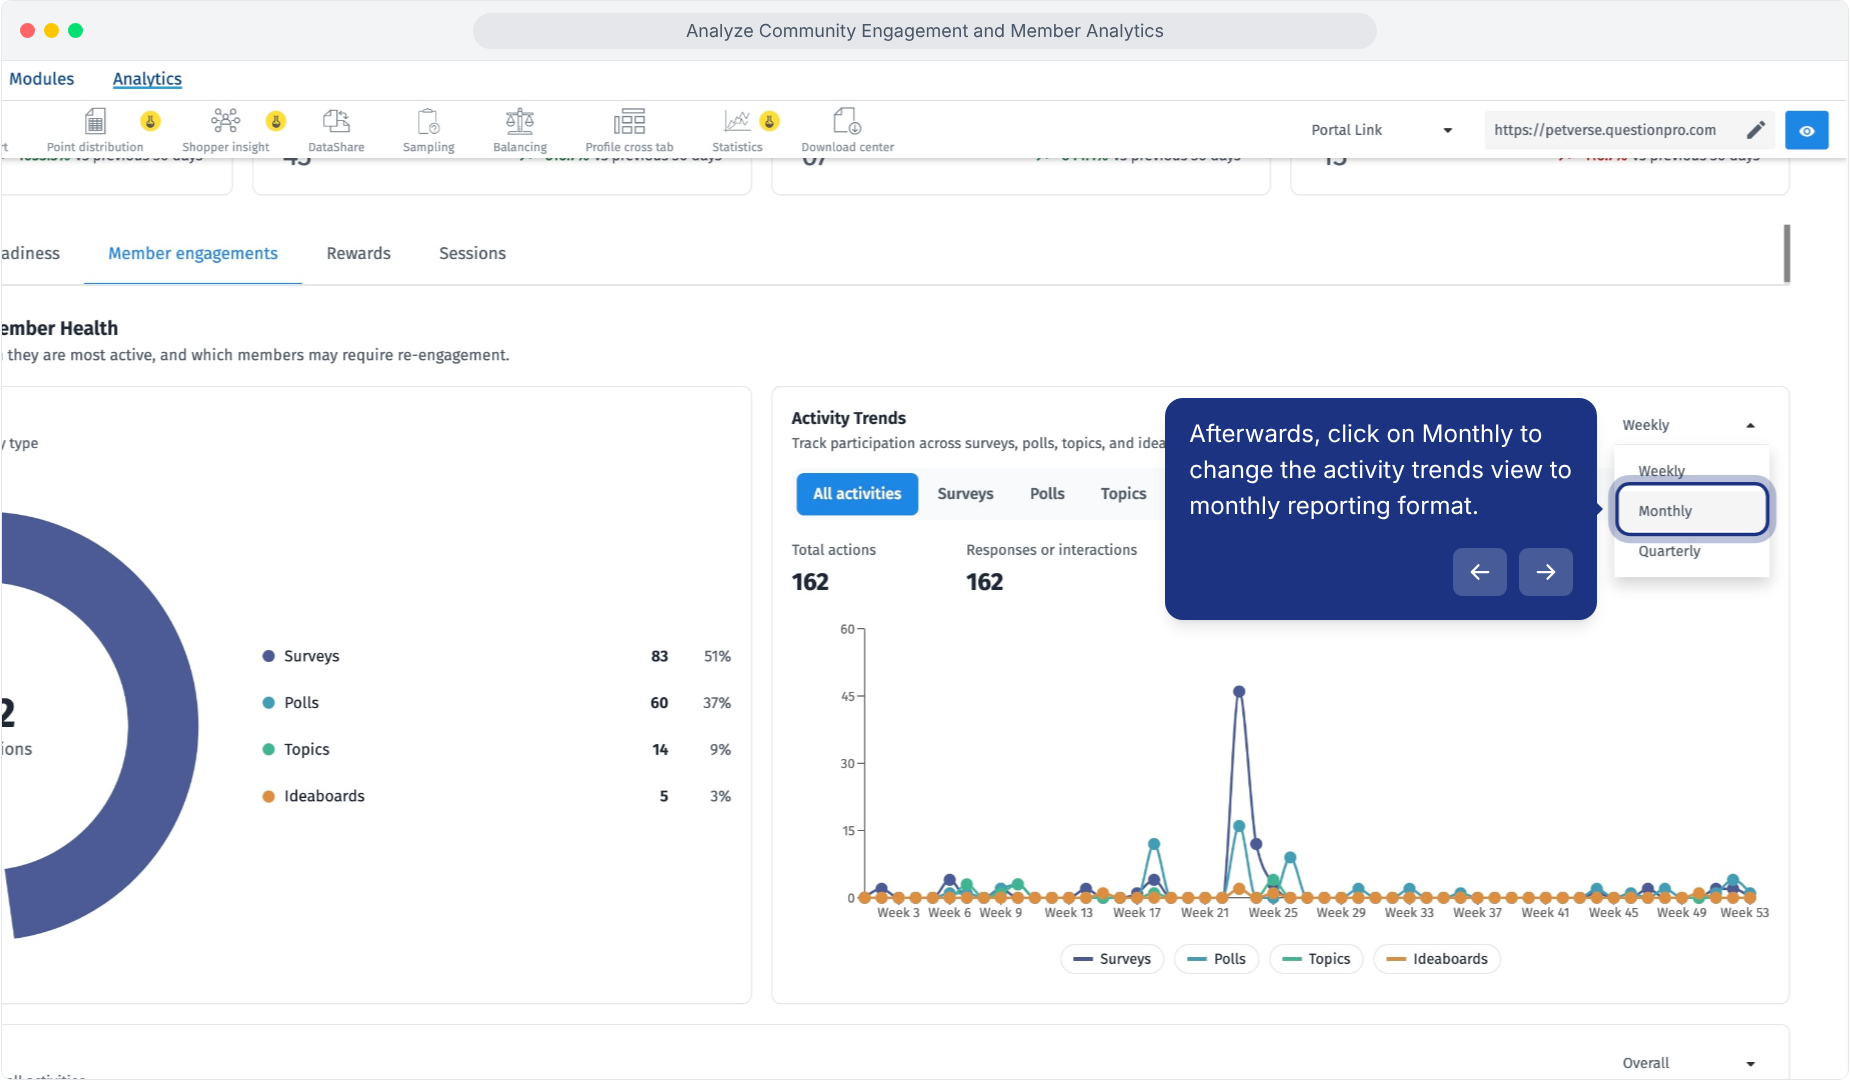
Select the relevant activity in Activity Trends:
- All activities: Review Total actions, Responses or interactions, and Participation rate for the combined view.
- Surveys: Compare Total invitations sent, Total responses, and Participation rate. If results are below expectations, investigate audience fit, invitation timing, study requirements, and recent member contact before planning reminders.
- Polls: Review Total invitations sent, Total votes cast, and Participation rate. Use the results to assess which quick-feedback opportunities attract participation.
- Topics: Review interactions, comments, likes, dislikes, and participation rate. Read the discussion content to understand what prompts members to contribute or needs moderator follow-up.
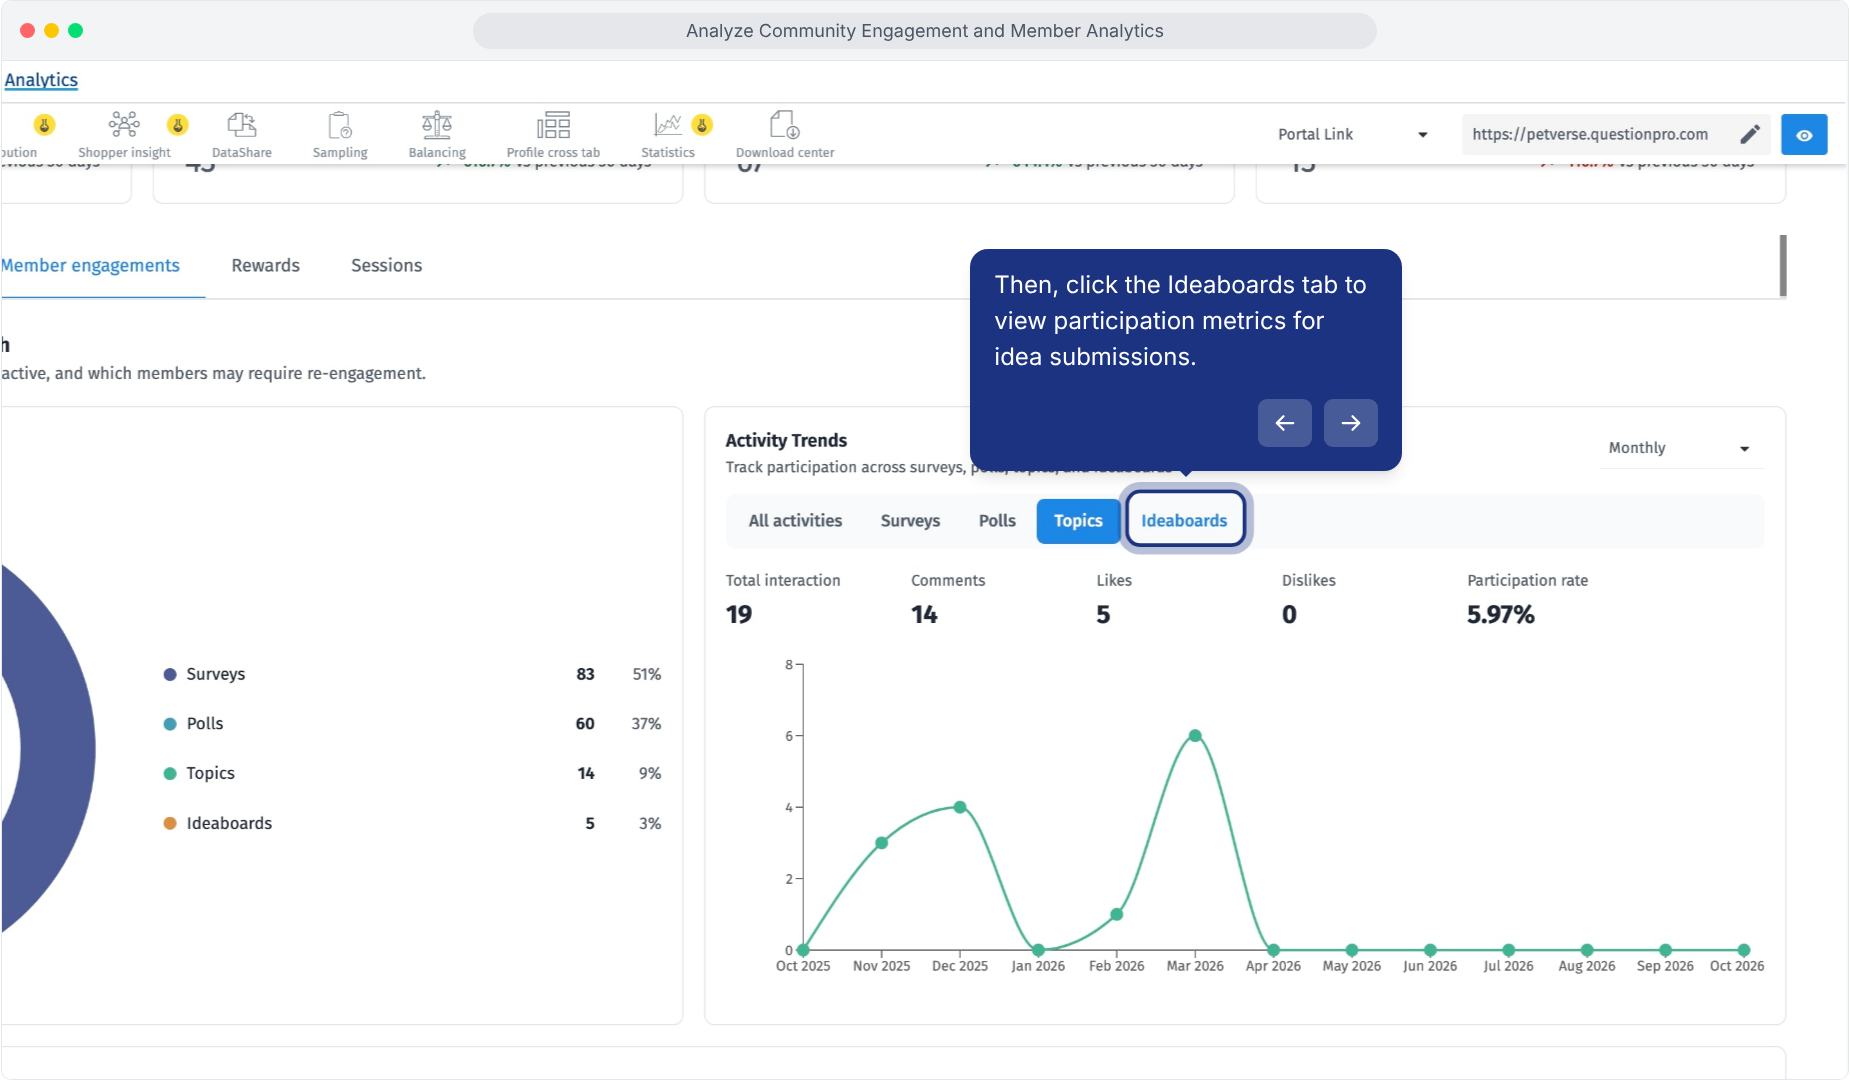
- Ideaboards: Review interactions, comments, likes, dislikes, and participation rate. Inspect the ideas and feedback behind the counts before deciding what to explore further.
Survey view: review invitations, responses, and participation.
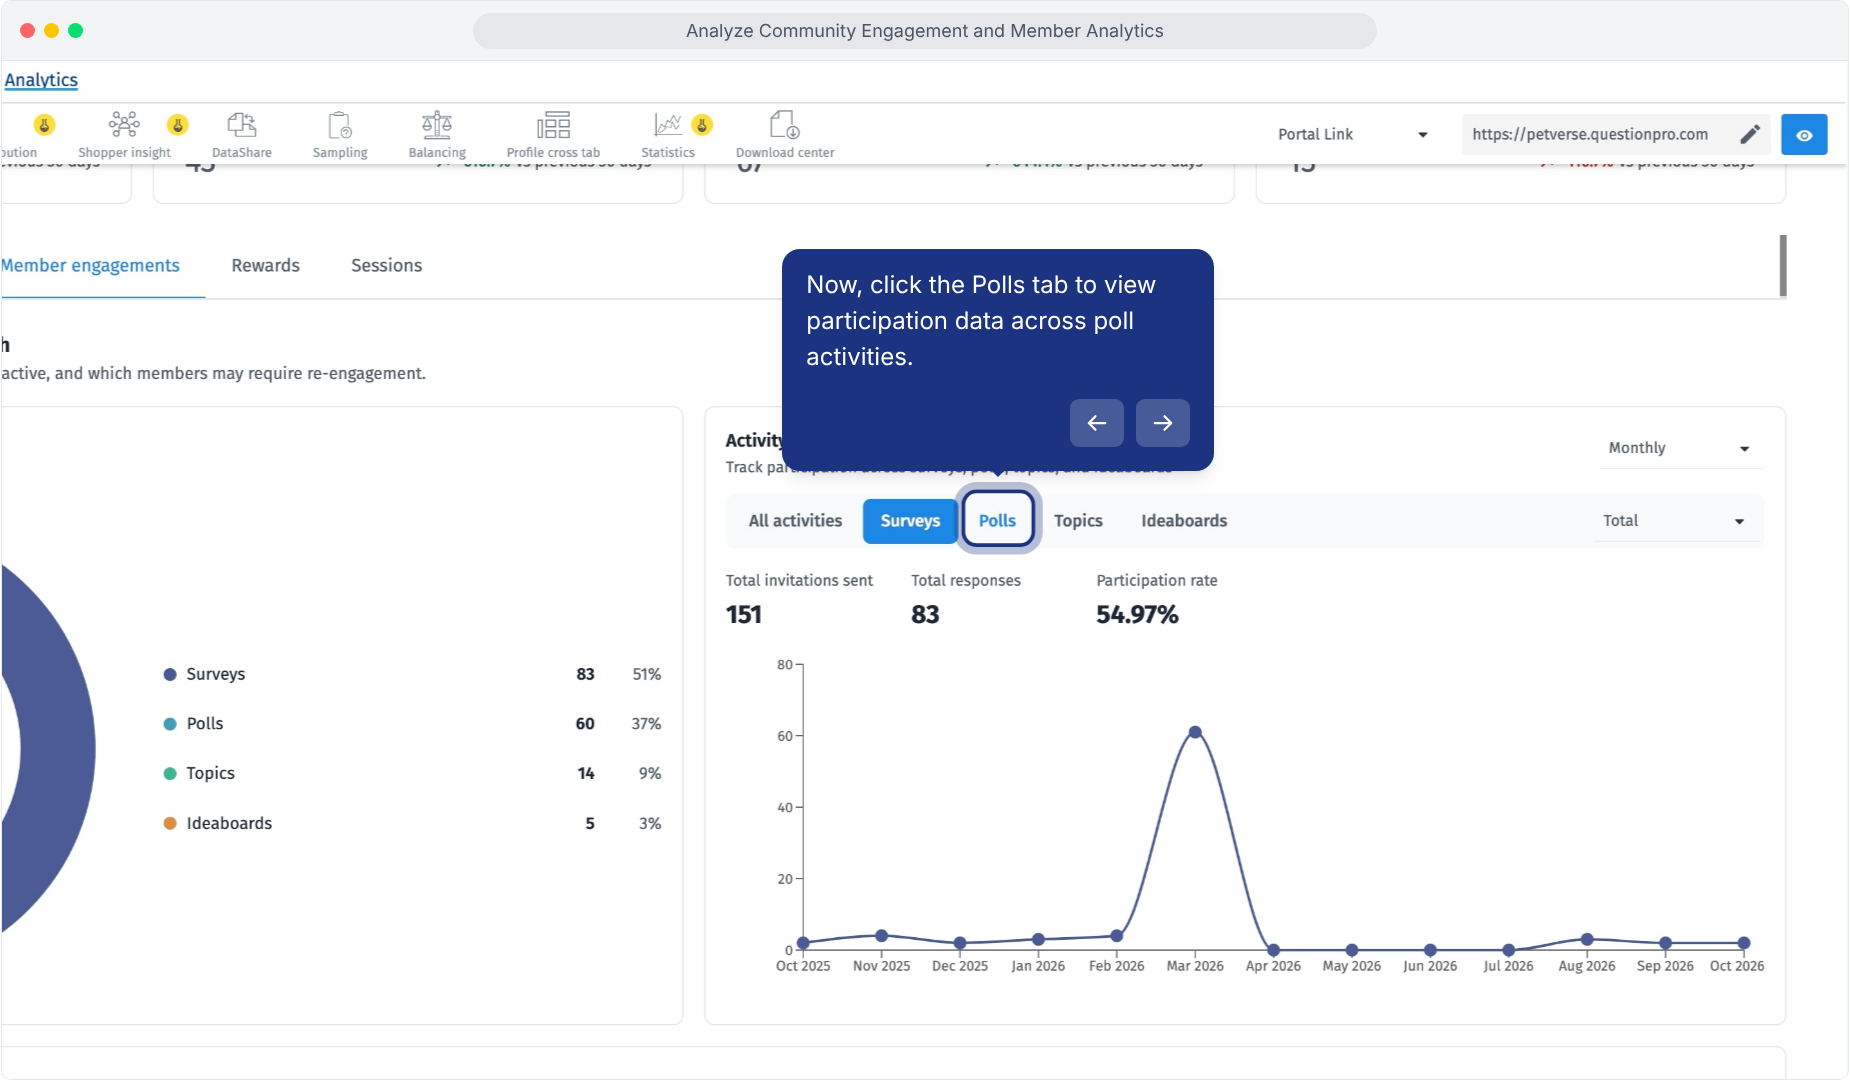
Poll view: review invitations, votes, and participation.
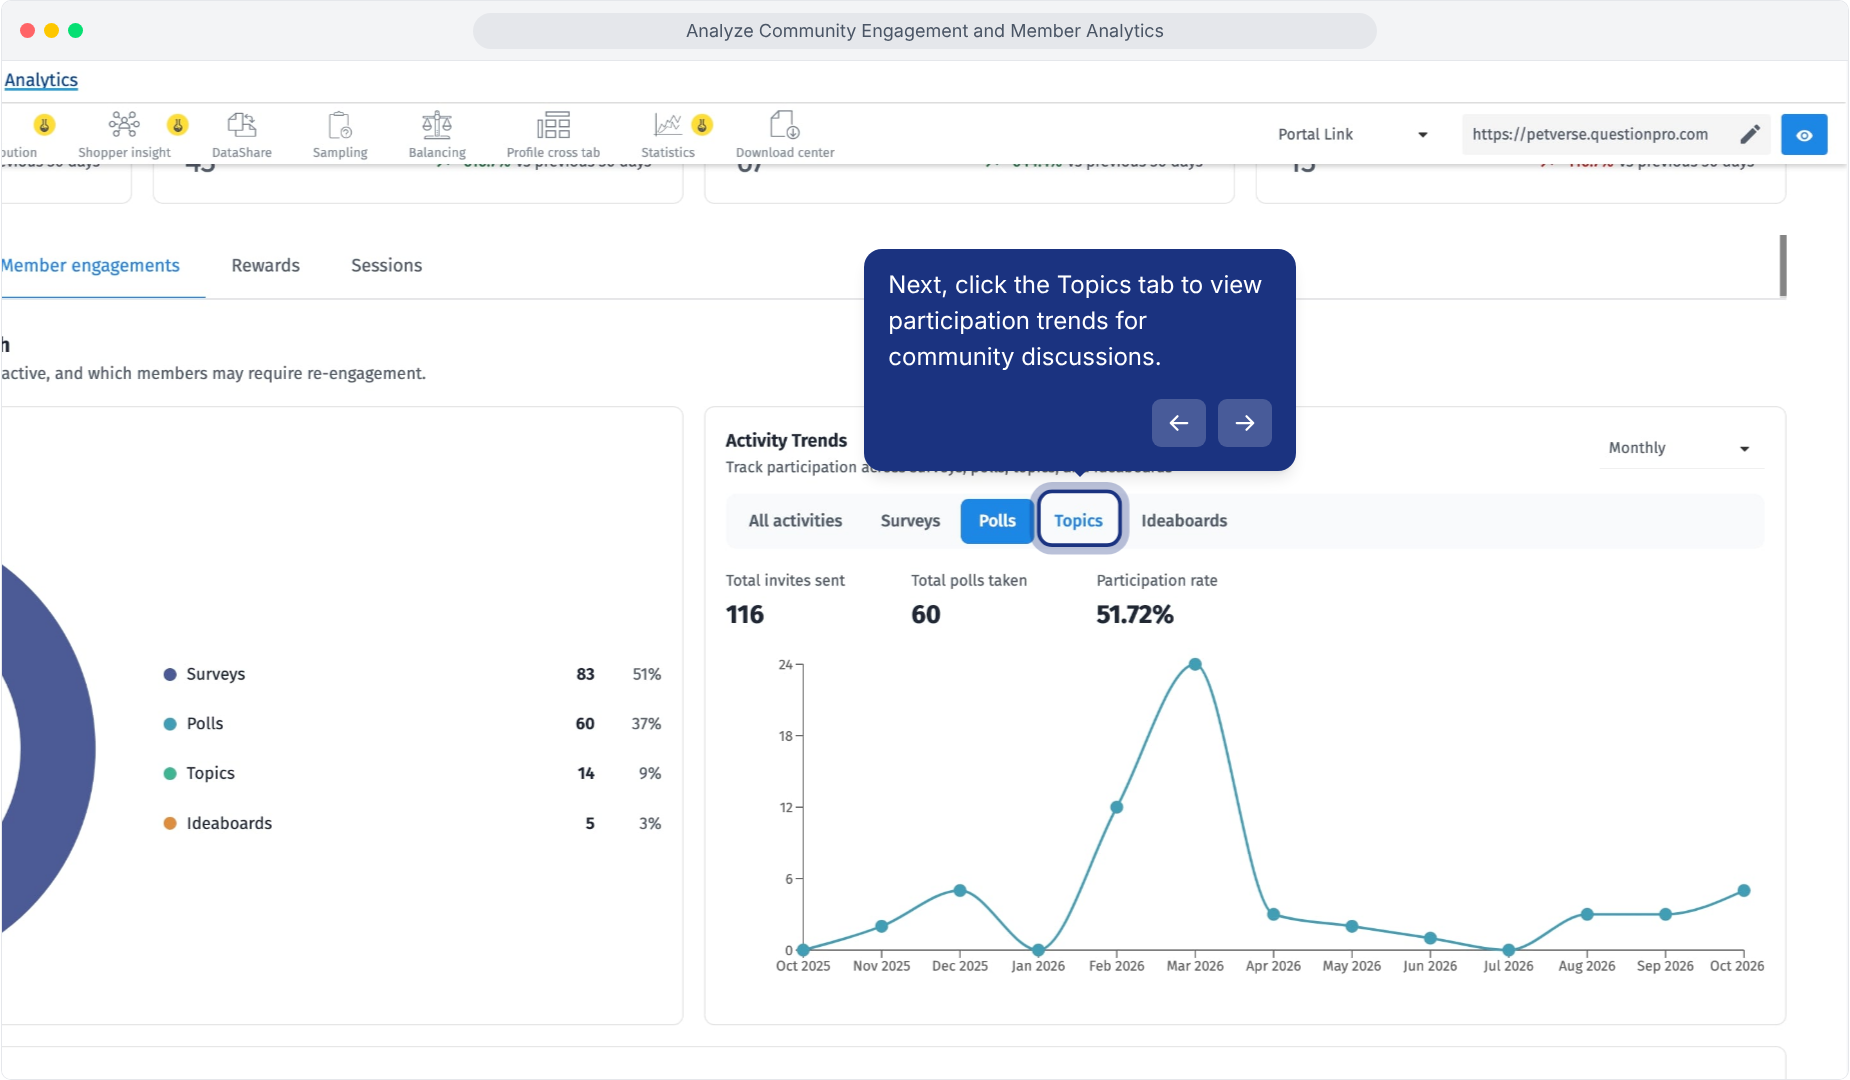
Topic view: review discussion interactions.
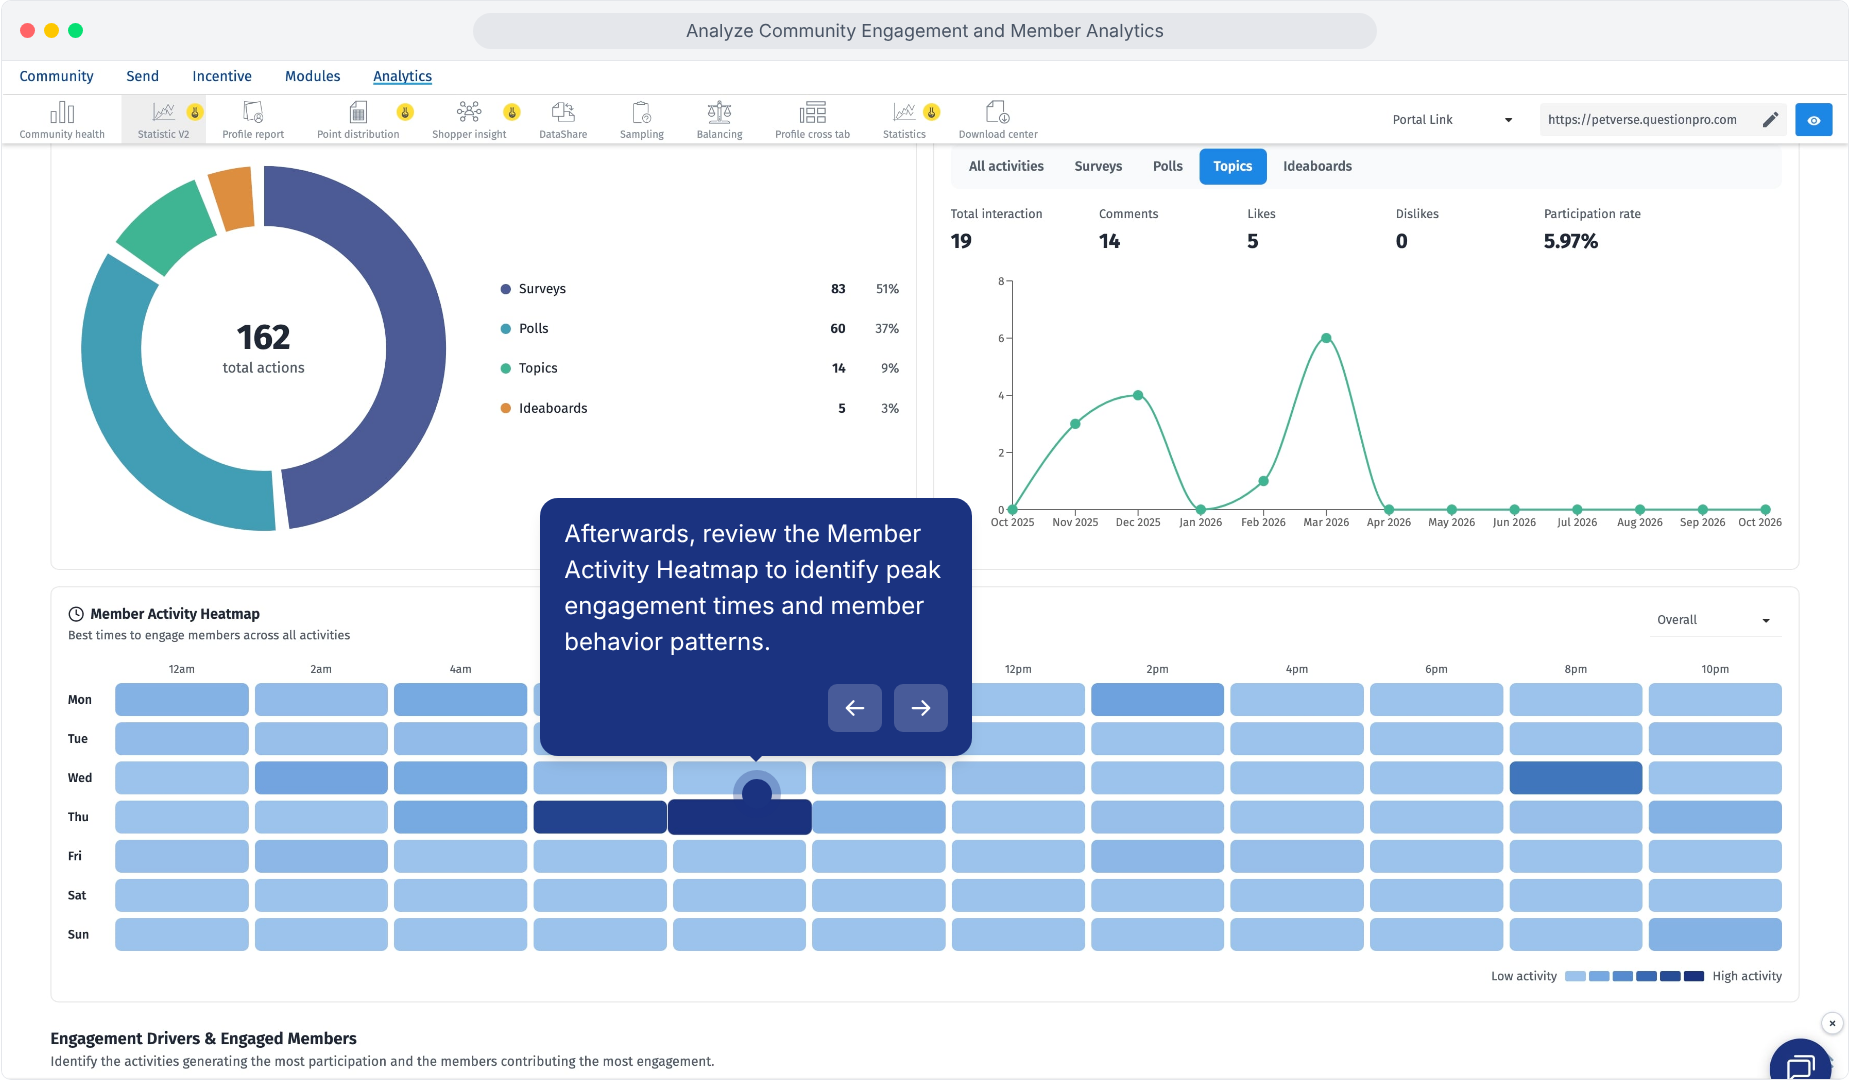
Select Ideaboards to switch from topic activity to idea activity.
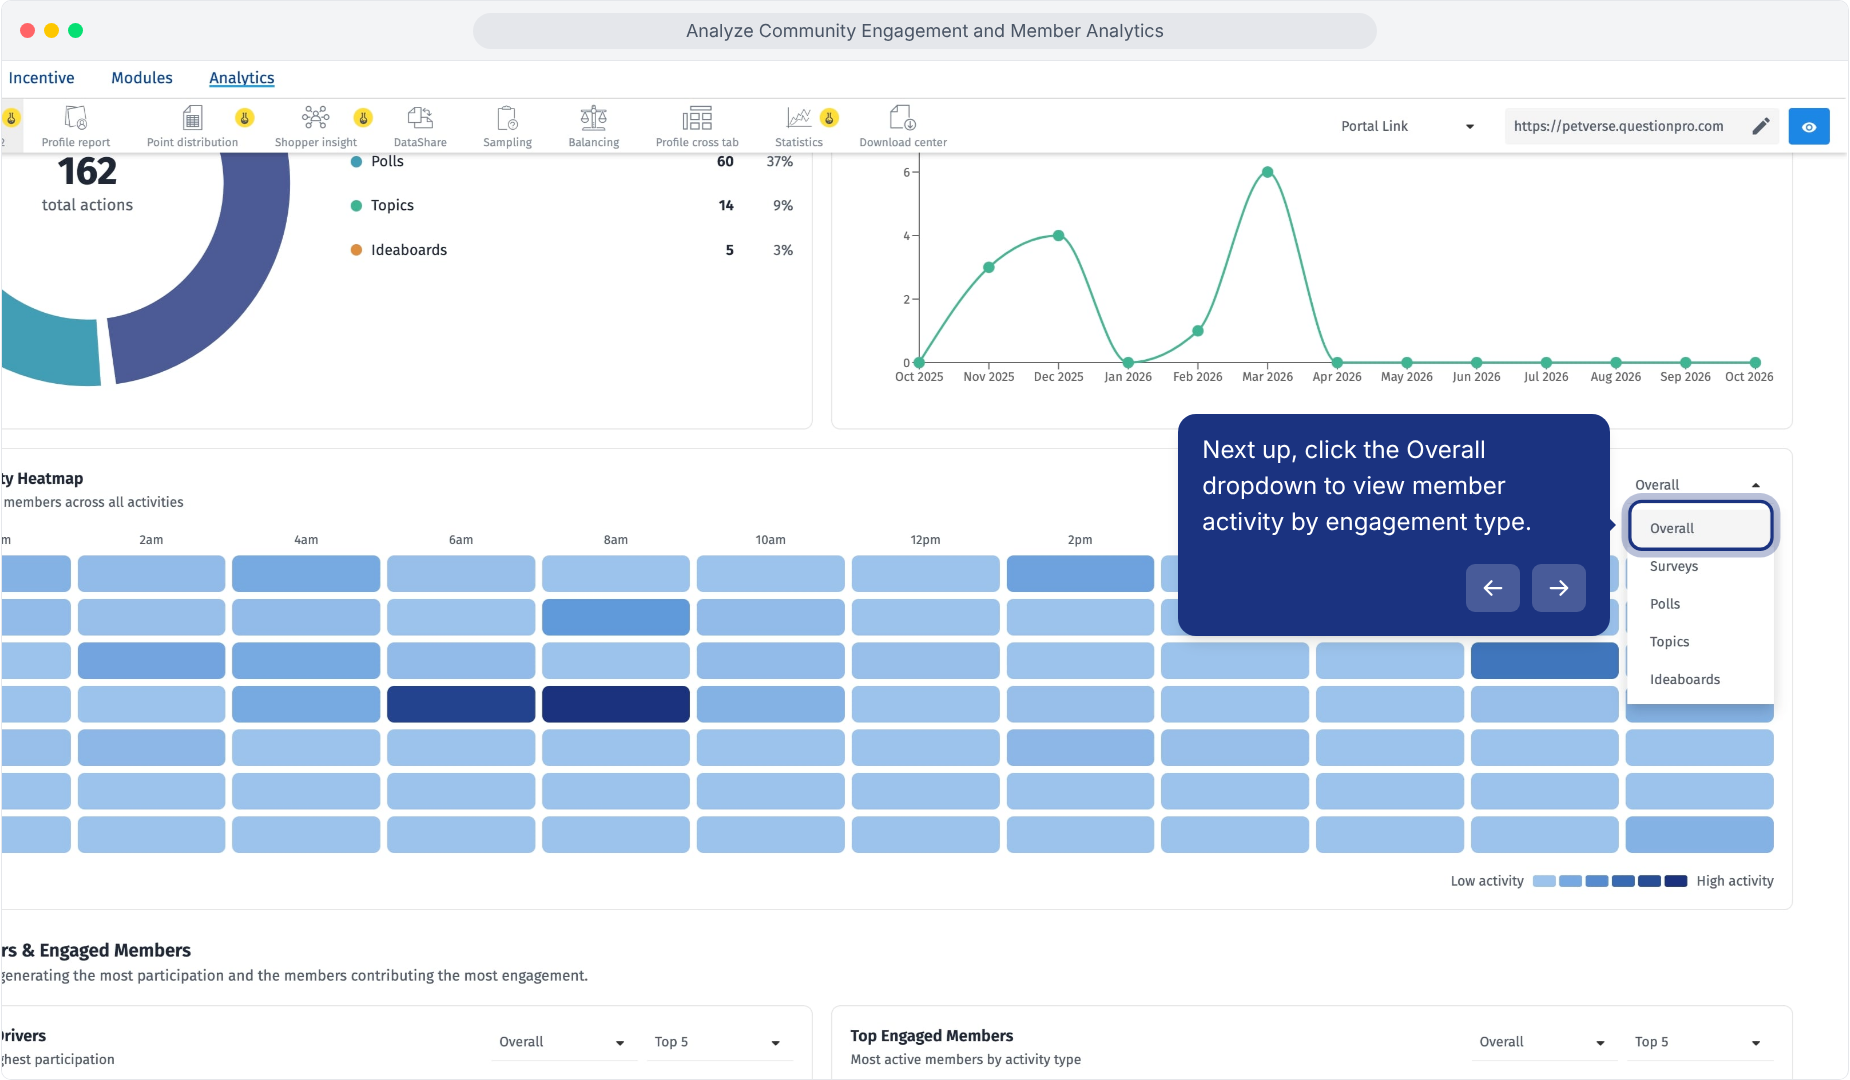
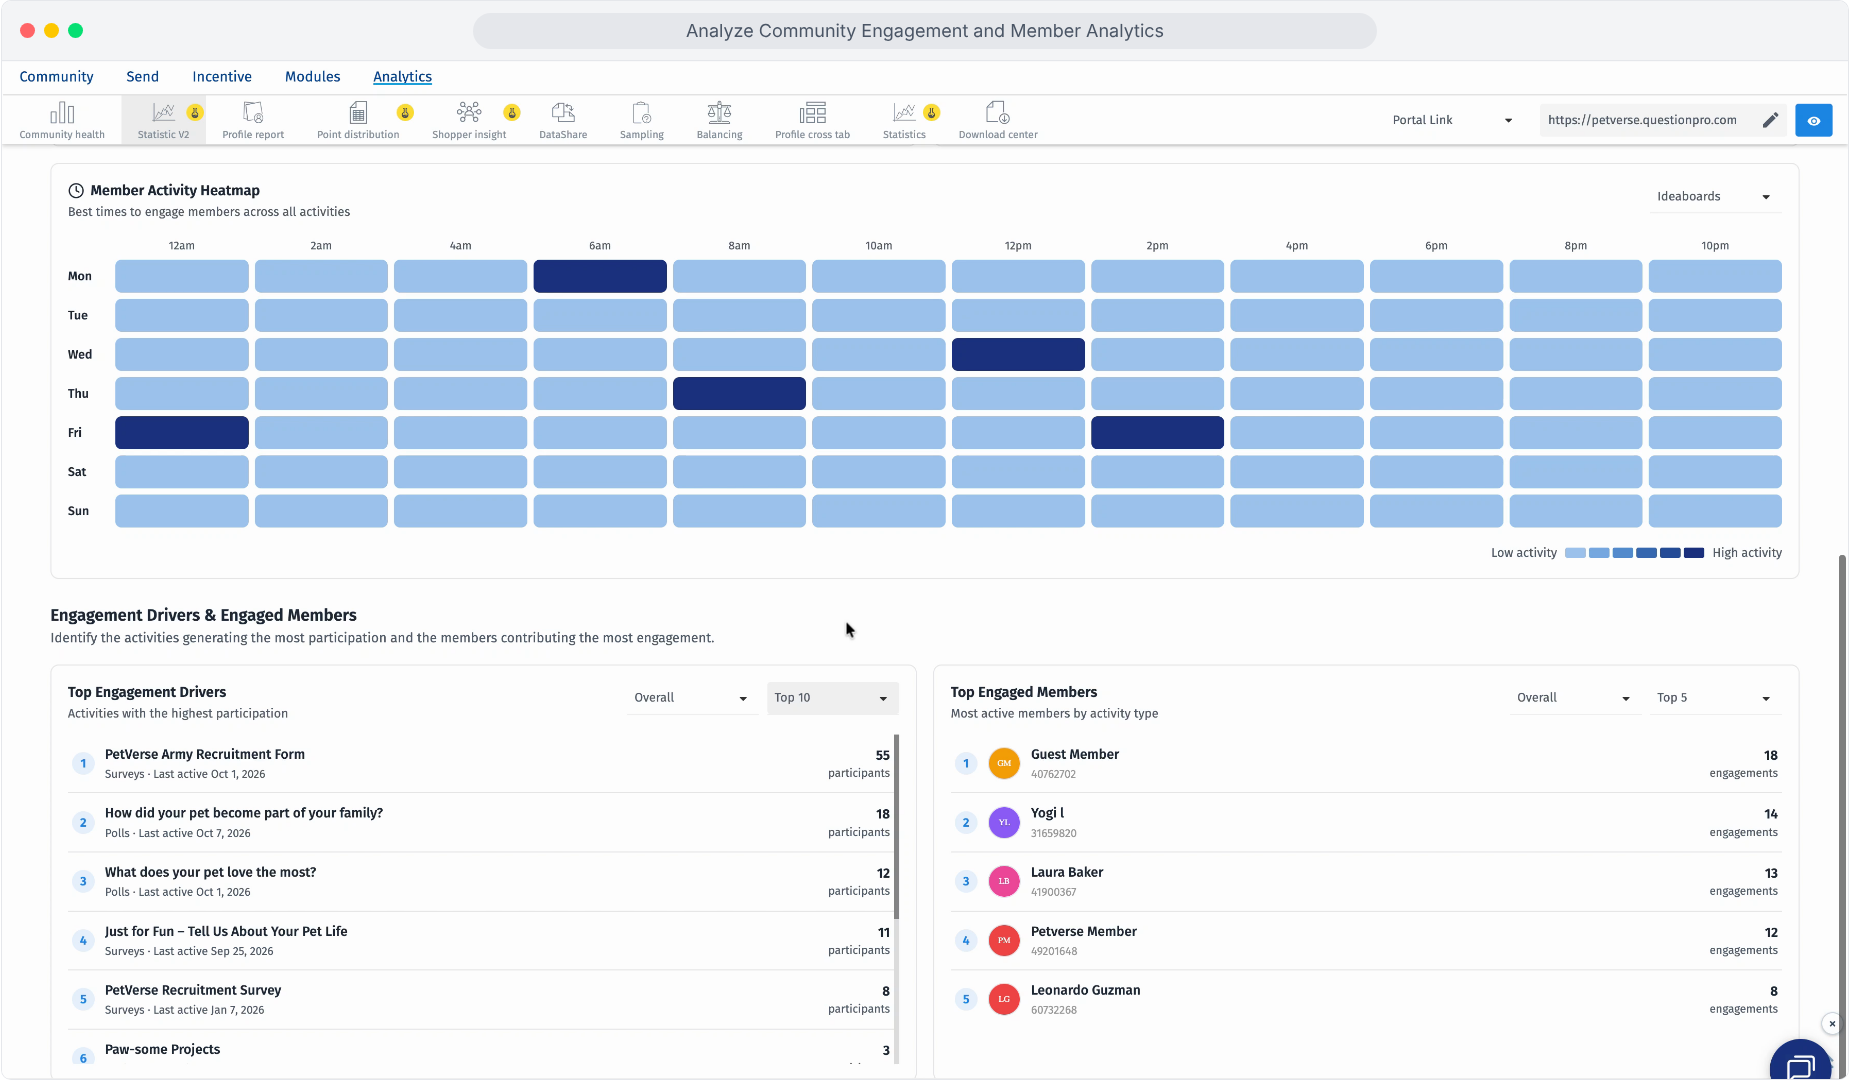
In Member engagements, scroll to Member Activity Heatmap. The rows and columns show activity by day and hour. Darker cells indicate higher recorded activity, as shown in the color legend.
Use the dropdown to select Overall, Surveys, Polls, Topics, or Ideaboards. The dropdown changes the activity type; use the dashboard's Date filter to change the reporting period. Start with Overall for a broad pattern, then select the activity relevant to your task. Survey activity may occur at different times from discussion or idea activity. Use these patterns to identify times to test for invitations, reminders, polls, or discussion prompts. Consider member time zones and your team's availability for follow-up. The busiest historical time is a useful starting point for testing, rather than a guarantee of better participation.Review activity by day and hour using the color legend.
Open the dropdown to filter the heatmap by activity type.
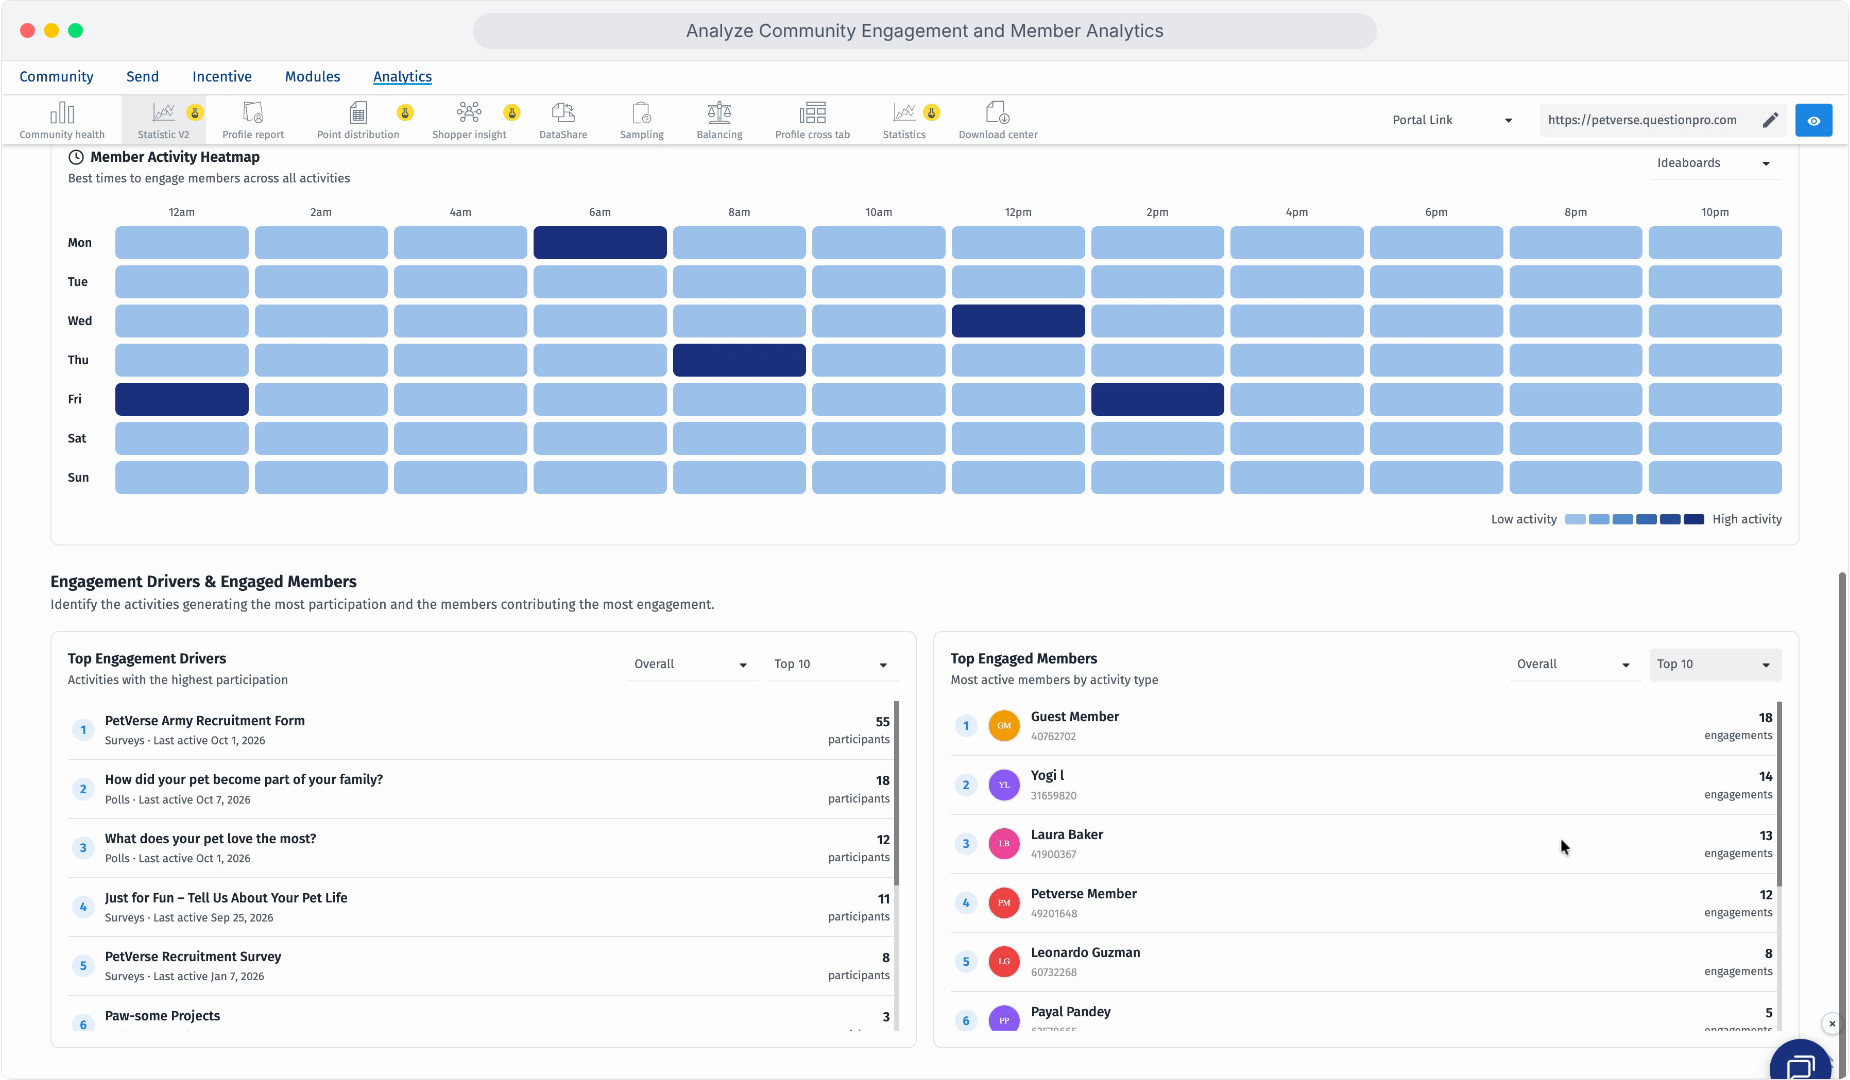
Scroll to Engagement Drivers and Engaged Members in the Member engagements tab.
- Top Engagement Drivers: Activities ranked by participation. Use the activity-type filter to focus the list and the ranking dropdown to display more leading activities.
- Top Engaged Members: Members ranked by their displayed engagement counts. Filter by activity type and choose Top 5, Top 10, or Top 20.
Review the expanded Top Engagement Drivers list.
Review the expanded Top Engaged Members list.
Open Rewards to review reward operations and member uptake.
- Reward Approval Activity: Total requests raised during the selected period, grouped by their current Approved, Rejected, or Pending status.
- Reward Inventory and Distribution: Total amount used and remaining, items used and remaining, eligible members, and members who redeemed.
- Redemption rate: The share of eligible members who redeemed during the selected period, including members whose balance fell below the reward cost after redeeming.
- Top earner: The highlighted member and their displayed points total.
Review approval requests, inventory, redemption, and the top earner.
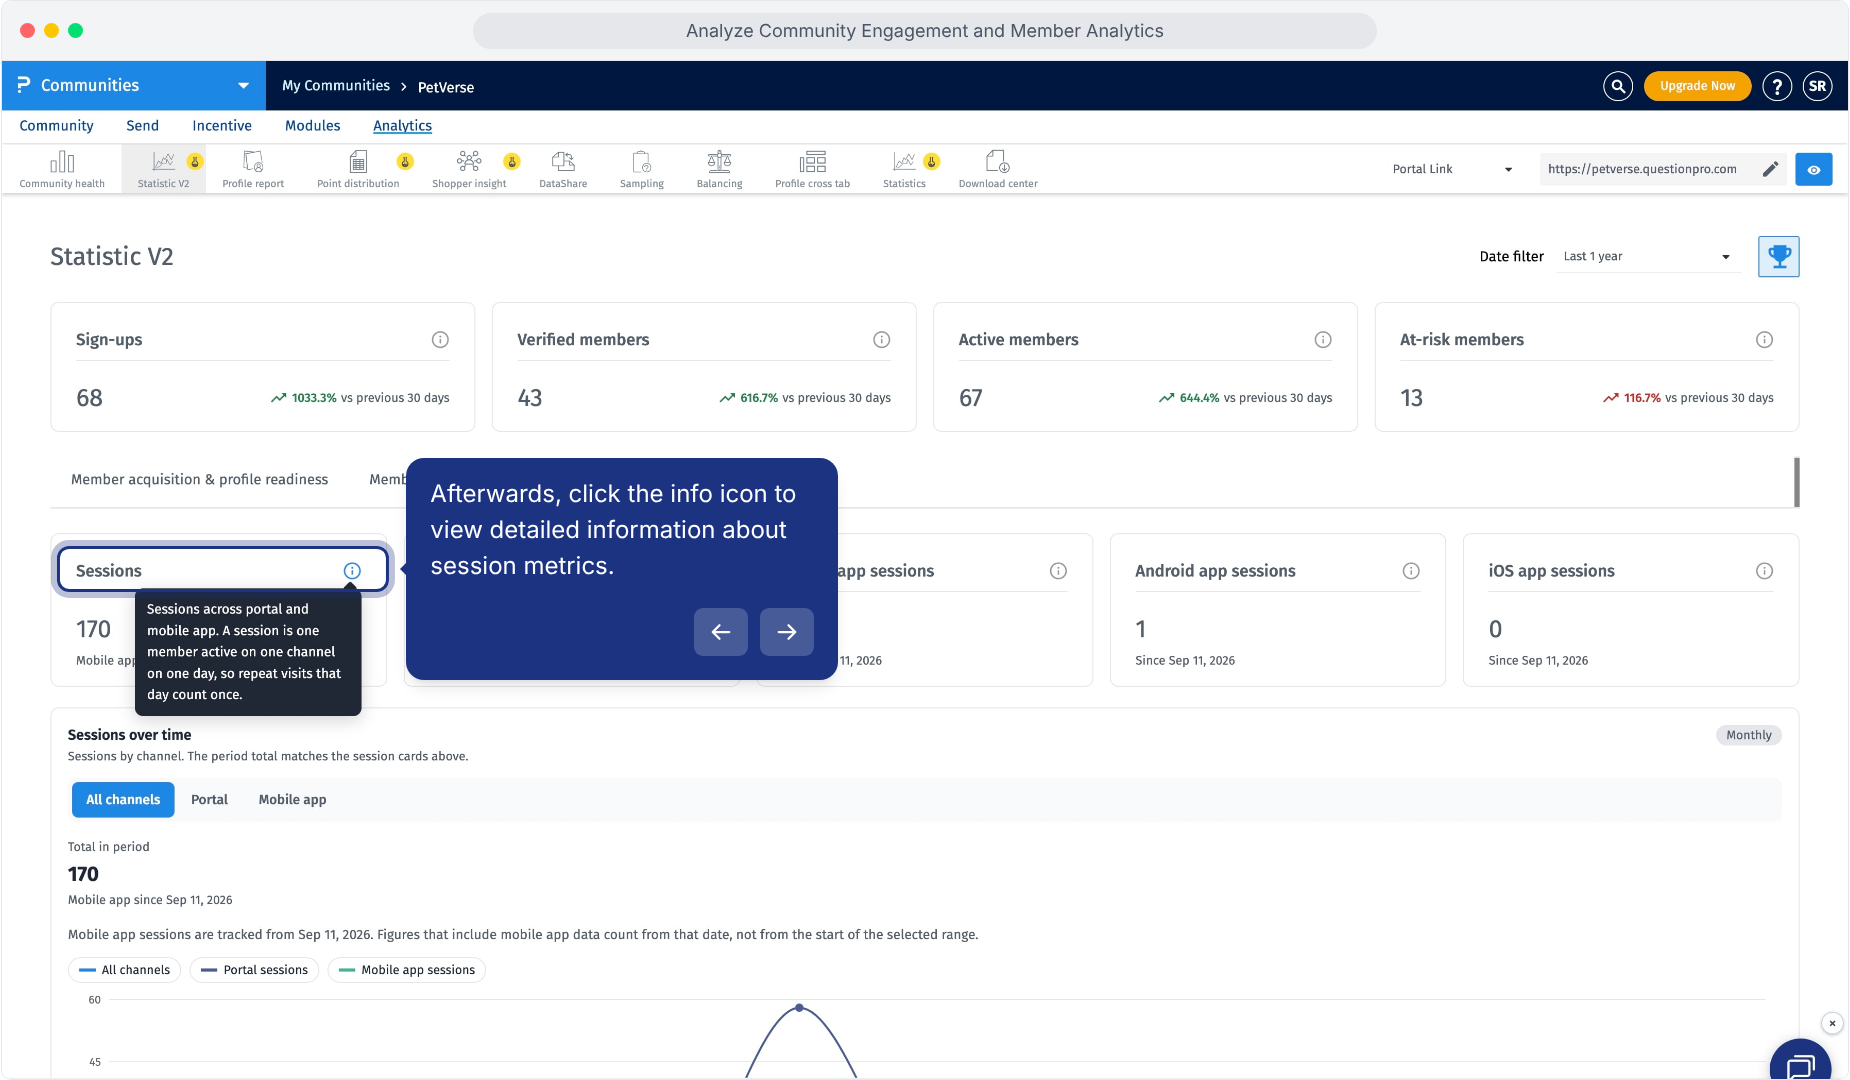
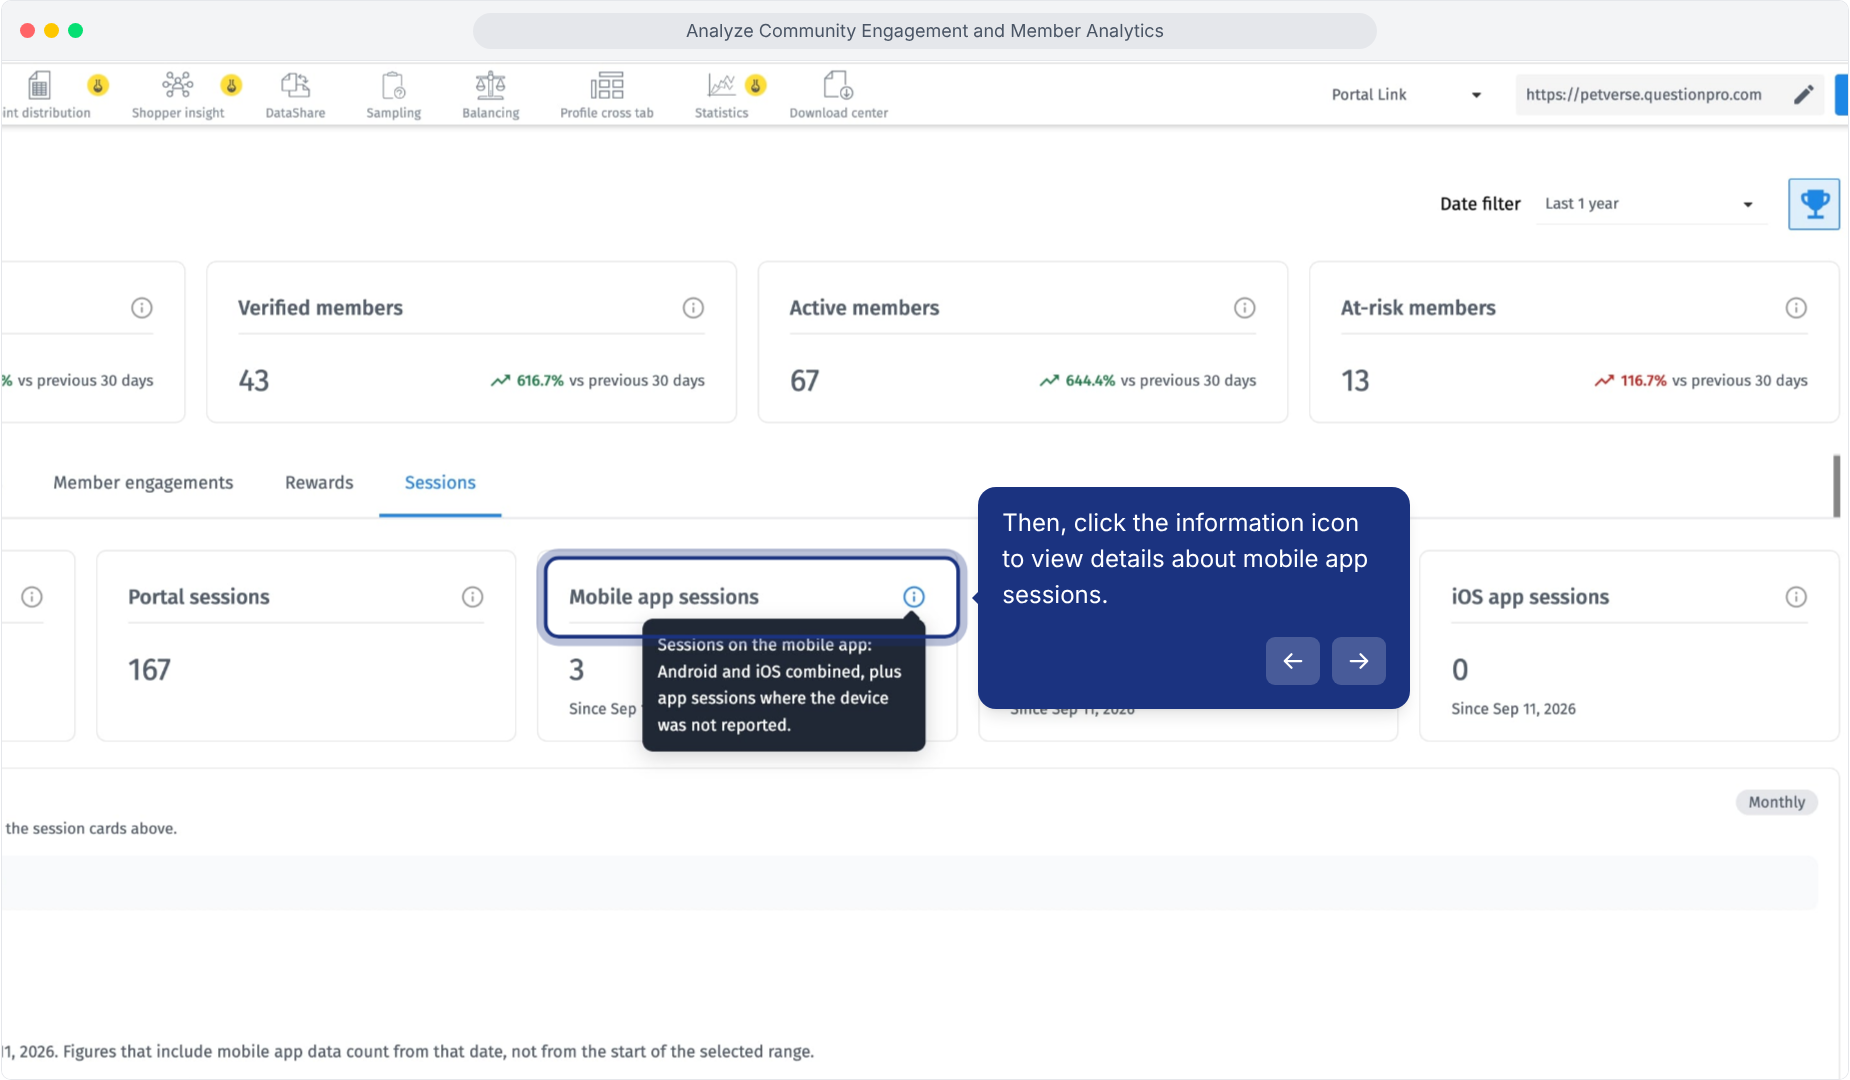
Open Sessions. Use the information icons to read the definitions of the session cards:
- Sessions: Activity across the portal and mobile app. A session counts one member active on one channel on one day; repeat visits to the same channel that day count once.
- Portal sessions: One session per member per day they log in to the portal, regardless of repeat logins that day.
- Mobile app sessions: Android, iOS, and app sessions where the device was not reported.
- Android app sessions and iOS app sessions: Platform-specific session counts.
Read the information tooltip to understand session counting.
Review the Mobile app sessions definition.
Review Mobile app session trends by platform.
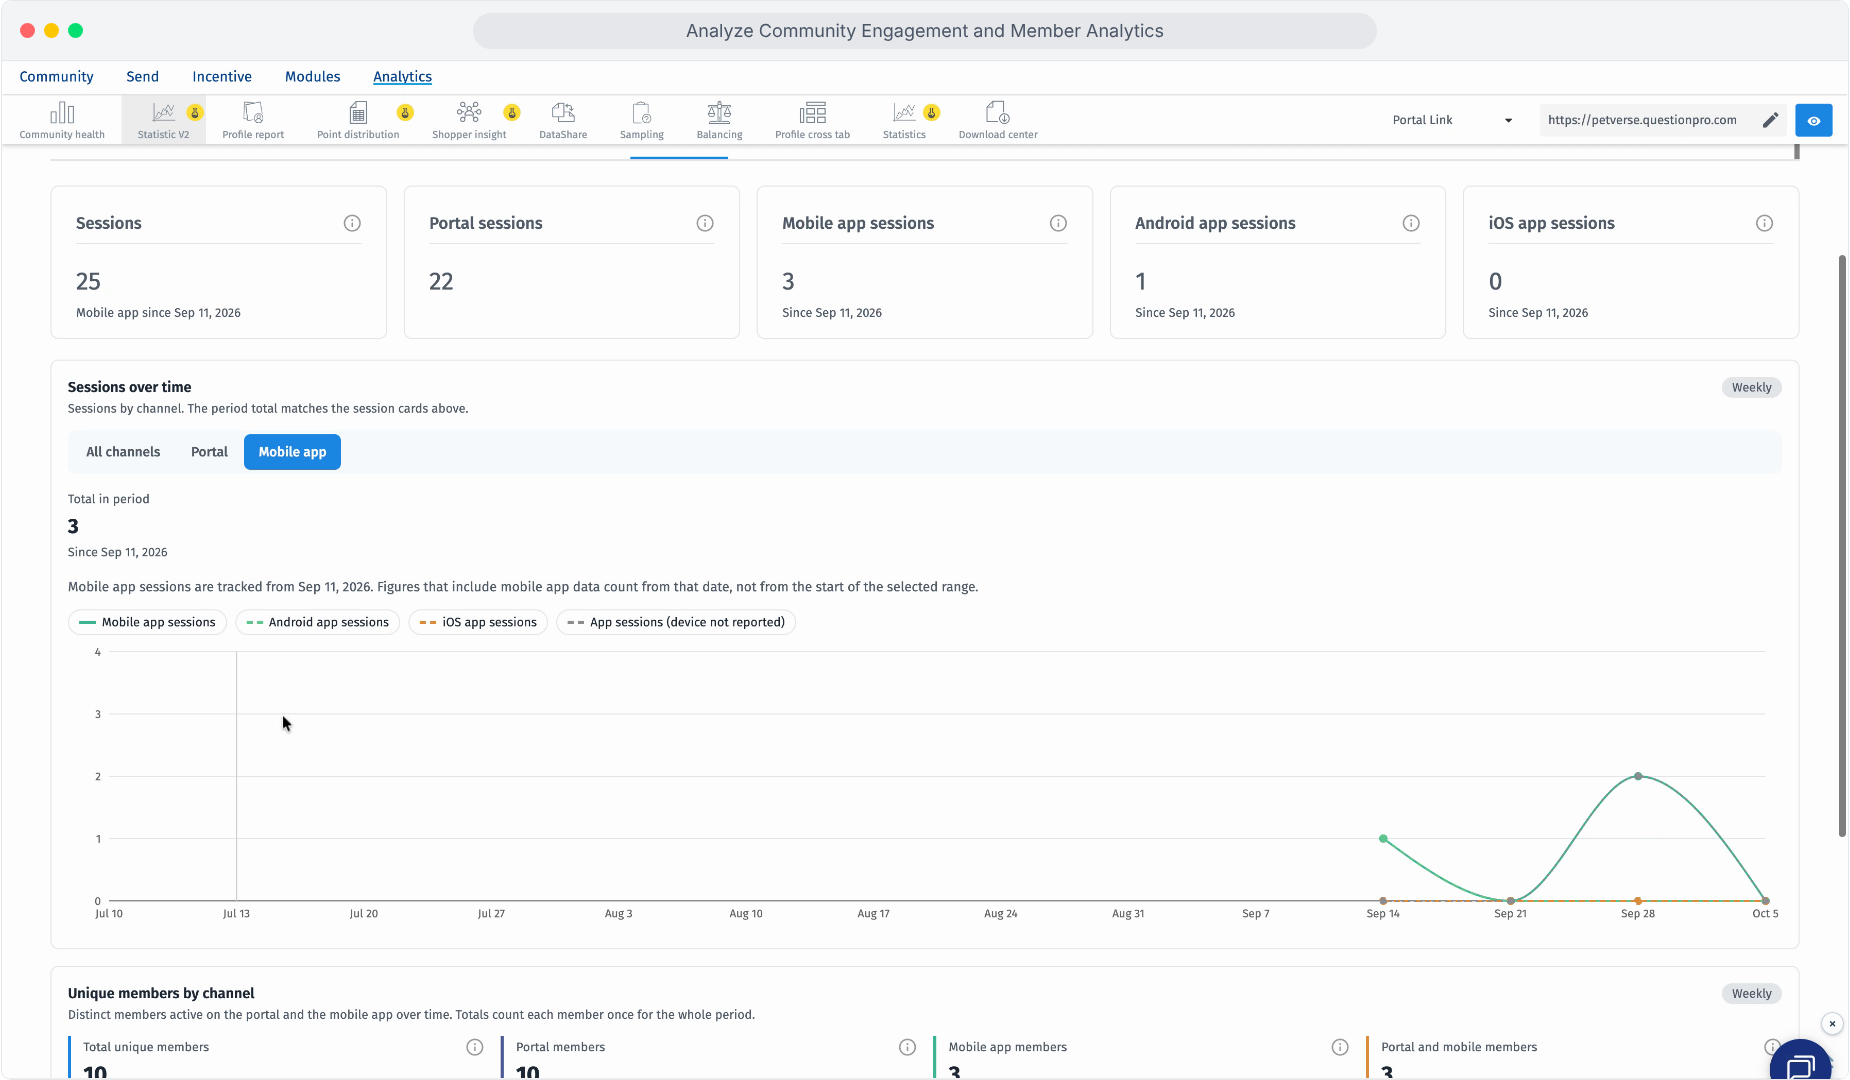
Unique members by channel shows distinct members active during the reporting period. Each member is counted once for the whole period in the relevant group.
- Total unique members: Distinct members active across the portal and mobile app.
- Portal members: Distinct members active on the portal.
- Mobile app members: Distinct members active on the app.
- Portal and mobile members: Members who used both channels.
Use a short checklist to connect your review with the work your team needs to do:
- Recruitment and onboarding: Compare sign-ups with your goals and review verification or source groups that need follow-up.
- Research readiness: Check the profile information and eligibility criteria needed for upcoming studies.
- Participation: Review activity trends, investigate unexpected changes, and select relevant activities or timing tests.
- Member experience: Review pending reward requests, inventory availability, and portal or app usage.
- Follow-through: Choose a few specific actions, assign owners, and review their results during the next reporting period.
This feature is available with the following licenses :
Essentials Advanced Team Edition Research Edition Communities
