Trend analysis is a methodology used in research to gather and study data for prediction-making about future consumer behavior based on the trend analysis of observed and recorded data from past and ongoing trends.
Trend analysis in market research is about studying data to understand and predict how customers might behave in the future. It helps identify trends, spot patterns, and figure out the key factors that influence customer behavior.
In other words, trend analysis is the process of studying statistical data and recording current market behavior over a specific period to generate valuable consumer insights. This data is employed to strategize future business plans. It is also called a horizontal trend. It helps determine the main characteristics of the stock market and the consumers associated with it.
Trend analysis is the practice that gives us the ability to look at data over time for a long-running survey. Horizontal trends can be helpful in comparing quiz or test scores (see an increase in knowledge over the course if you manage the same survey multiple times over a few weeks or months) or identify a trend in data sets for a regularly distributed satisfaction survey.
But what does trend analysis mean? No need to worry! We have composed this article with everything you need to know about this type of trend analysis so that you can start using it in all your research projects.
Trend Analysis in Market Trends Research
With the performed trend analysis report, you can compare historical data and get answers to questions like:
Has your NPS score improved over time?
Has the customer experience changed as compared to the last quarter?
Do employees engage more now? Is there an increase in employee retention?
Are sales expected to grow this year?
Trend analysis helps to display a summary of long-term historical data and trend reversal. Use it to investigate variability at different time points and capture how the consumers and markets respond over time. Use trend analysis to identify the best time for demand in the market and also identify trends with low-demand phases to take action according to market research or consumer insights.
QuestionPro lets you filter results based on the below data filters:
Data set filter: You can choose to view the report on the entire data set or a group of responses that meet custom criteria.
Survey completion status: Filter results based on the surveys started, completed, or terminated.
Date: Set the start and end dates to compare data in a specific time frame.
Frequency: Select if you want the reports to be exported daily, weekly, monthly, or quarterly.
Output data: Choose whether you want to view the data items in percentages or detailed statistics in the trend analysis report of the survey results.
Researchers and businesses run a trend analysis report after data collection for the following:
To understand consumer behavior
Based on historical data, it helps companies understand what consumers need, consumer behavior, and what gets outrightly rejected. It helps them make timely changes in products for future events and then push them out into the market. For instance, it helps identify types of trends and target customers and make informed decisions in a bear market situation.
To identify a shift in consumer realization
Consumer perception concerning the product or service can be quite volatile. Short-term planning won't lead you too far with historical data. Consumer satisfaction or consumer behavior levels can change due to even minor changes in the business strategy or product. Trend analysis involves the technical analysis of consumer needs and how they perceive a product or a service.
To understand the cost drivers
Businesses need to study the financial statements or aspects of their market research, such as the stock price and cost drivers affecting their products or services over time. They need to innovate and come up with the best possible products at a lower price than their competitors. Analyzing the trend over a period of time helps identify these drivers and valuable insights. Trend analysis is a handy tool to gauge the profit for an investor.
Advantages of Analyzing Trends in Survey Data
Here are the business benefits of running a trend analysis:
Strategy building
Trend analysis helps predict new business entrants and allows the company to develop strategies to uphold its industrial position. Analyzing historical data of trends can help zero in new products to be launched. For instance, if the trend reports show that Millenials prefer watching content over the OTT platform than reading a newspaper, you can launch your ads on these platforms. You can optimize your marketing spend by switching from traditional mediums like TV and newspapers to OTT sites.
Business expansion
Trend analysis facilitates businesses and organizations in making strategic decisions or financial statements to expand their business. Identifying patterns in consumer trends will help you discover new market areas to expand your business. For instance, if you notice that the demand in rural areas has been increasing steadily, you can plan to target specific locations more aggressively.
Change-analysis indicator
Trend analysis is instrumental as an indicator in identifying the underperforming areas of the business. Most organizations conduct customer satisfaction surveys to identify trends, promoters, passives, and detractors. If there is a sharp rise in the number of passives and detractors, they might have concerns with product quality, service, delivery, or customer support. Once you identify the improvement areas aftermarket trend data analysis and work on them, conduct a survey and measure the change in results over time.
Business feedback
Trend analysis helps identify the areas in which the business is performing well and duplicates the strategies for business expansion. Analyzing trends in customer feedback enables businesses to identify areas for improvement, make informed strategic decisions, create momentum indicator strategies, enhance overall customer satisfaction, stay ahead of market demands, drive long-term growth, and build strong customer relationships.
Types of Trend Analysis
The most common way to classify the various types of Trend Analysis is based on the method used. These methods are divided into Temporal, Geographic, and Intuitive. Let's discuss them.
01. Temporal Method
This type of methodology is used to analyze patterns and trends of a given group of relevant data or objects of study in a specific cohort of time, as well as its change in that period.
A clear example of this type of study is longitudinal studies, which are designed to detect and analyze trends that arise from historical trends.
It is mainly used in ethnographic research and other types of event-focused studies. The great disadvantage of this type of trend analysis is that it is exposed to many variables that could affect the final result of the study.
02. Geographic Method
The geographic method of trend analysis is generally easy and reliable; it can identify commonalities and differences between user groups belonging to the same or different geographies.
The main purpose of the geographic method is to analyze market trends that develop in groups of users identified by their geographic location.
The downside of the geographic method is consequently the geographic limitation for data analysis, which can be influenced by factors such as culture and traditions specific to the geographic location of user groups.
03. Intuitive Method
The intuitive method is a type of trend analysis implemented to analyze trends within groups of users based on logical explanations, behavioral patterns, or other elements perceived by a futurist.
This market trend analysis is helpful for prediction-making without the need for large amounts of statistical data. However, some issues with the methodology include the overreliance on knowledge and logic provided by futurists and researchers, which makes it prone to becoming biased toward its researchers.
The intuitive method is the most difficult type of trend analysis and might not be as precise.
What are the Steps in Trend Analysis?
Trend analysis is a method used to identify patterns or trends in data over time. Here’s a streamlined approach to conducting effective trend analysis:
01. Define Your Goals
Begin by clearly outlining your starting point and desired outcomes. What insights are you seeking? Establishing clear goals helps focus your analysis and ensures you extract relevant trends that impact your business decisions.
02. Invest in Regular Trend Analysis
Trends develop over time, often in discernible patterns or waves. Regular data collection is essential to capture these trends effectively. Implementing surveys on a monthly, quarterly, or annual basis allows you to track changes in consumer preferences or market dynamics. Choose a frequency that aligns with the pace of change in your industry.
03. Use an Intuitive Survey Tool
Select a user-friendly survey platform to streamline data collection and analysis. Features that facilitate quicker insights such as:
Drag-and-drop interfaces
Automated analytics
Real-time reporting
Customizable dashboards
These features ensure the tool supports survey customization and can reach your target audience effectively.
04. Identify Your Sample
Accurate trend analysis depends on gathering data from the right demographic. Utilize survey tools that offer templates and panel-agnostic capabilities to ensure your sample reflects your target audience. This approach enhances data quality and relevance to your analysis goals.
05. Field and Analyze Your Data
Execute your survey and utilize a robust data analysis platform to interpret results in real-time. This capability allows for:
Immediate insights into emerging trend
Consumer behavior shifts
Competitive dynamics
Analyze trend analysis data across different demographics and parameters to gain comprehensive trend perspectives.
06. Act on Your Findings
Translate your analyzed data into actionable insights. Whether it’s launching a new product, adjusting marketing strategies, or anticipating market shifts, act decisively based on the identified trends. Use trend analysis to inform ongoing business decisions and maintain a competitive edge.
By following these steps, businesses can leverage trend analysis as a strategic tool for understanding market dynamics, predicting consumer behavior, and adapting proactively to industry trends.
Example of Trend Analysis
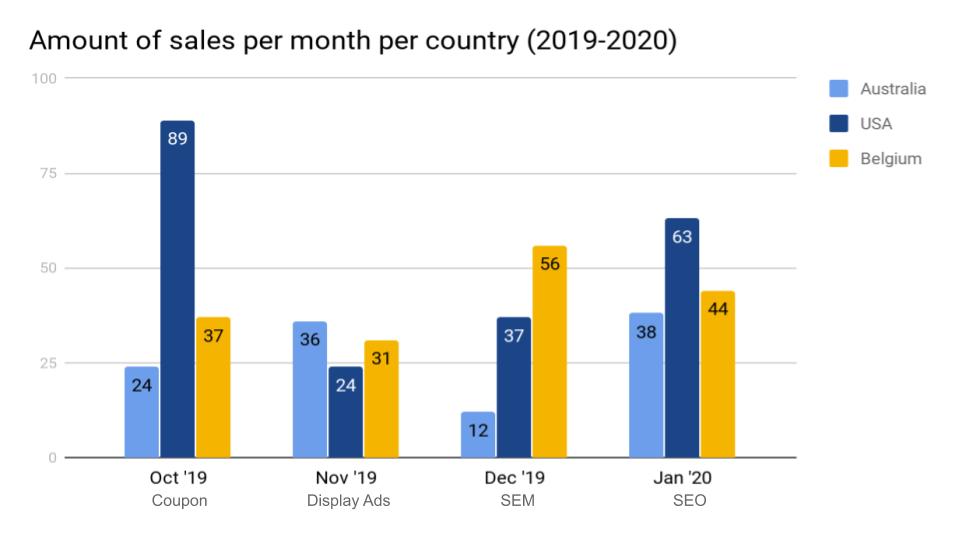
The graph below explains trend analysis over a period for channel sales per country. Channels are based on four categories:
Coupon
Display ads
SEM
SEO
This graph is an example of a sales pattern that is analyzed on a month-on-month basis. The table shows the calculation of the mean to predict the market trend for the coming months. The table is based on the sales figures for the last four months.
Trend Analysis Example Historical Data:
Best Practices for Effective Trend Analysis
Effective trend analysis is a critical tool for deriving actionable insights and guiding strategic business decisions. The following best practices will help ensure your trend analysis is both accurate and valuable:
Select Appropriate Data: Use accurate, relevant, and representative data. Choose suitable time frames and intervals to capture meaningful trends. It ensures the data reflects true patterns rather than anomalies.
Clean and Preprocess Your Data: Thoroughly clean and preprocess your data to address inconsistencies, missing values, and outliers. High-quality, clean data is essential for reliable trend analysis.
Maintain Consistent Data Formats: Ensure data formats and units are consistent to facilitate accurate comparisons. Standardize data to a common scale if necessary.
Use Visualizations: Employ charts, graphs, and dashboards to present trends clearly and understandably. Visual representations help stakeholders quickly grasp key insights, enhancing communication and decision-making.
Involve Stakeholders: Engage relevant stakeholders throughout the analysis process. Gathering input from domain experts and end-users ensures alignment with organizational goals and expectations, enhancing the relevance and impact of the findings.
Choose Appropriate Analysis Methods: Select methods that suit the data type and analysis objectives. This might include statistical methods, machine learning algorithms, or time series analysis, depending on the context.
Focus on Key Metrics: Identify and prioritize key performance indicators (KPIs) relevant to your analysis objectives. This focus helps maintain clarity and ensures the analysis addresses the most critical aspects of the business.
Communicate Effectively: Present the trend analysis results clearly and accessiblely. Tailor your communication to the audience, emphasizing key insights and actionable takeaways
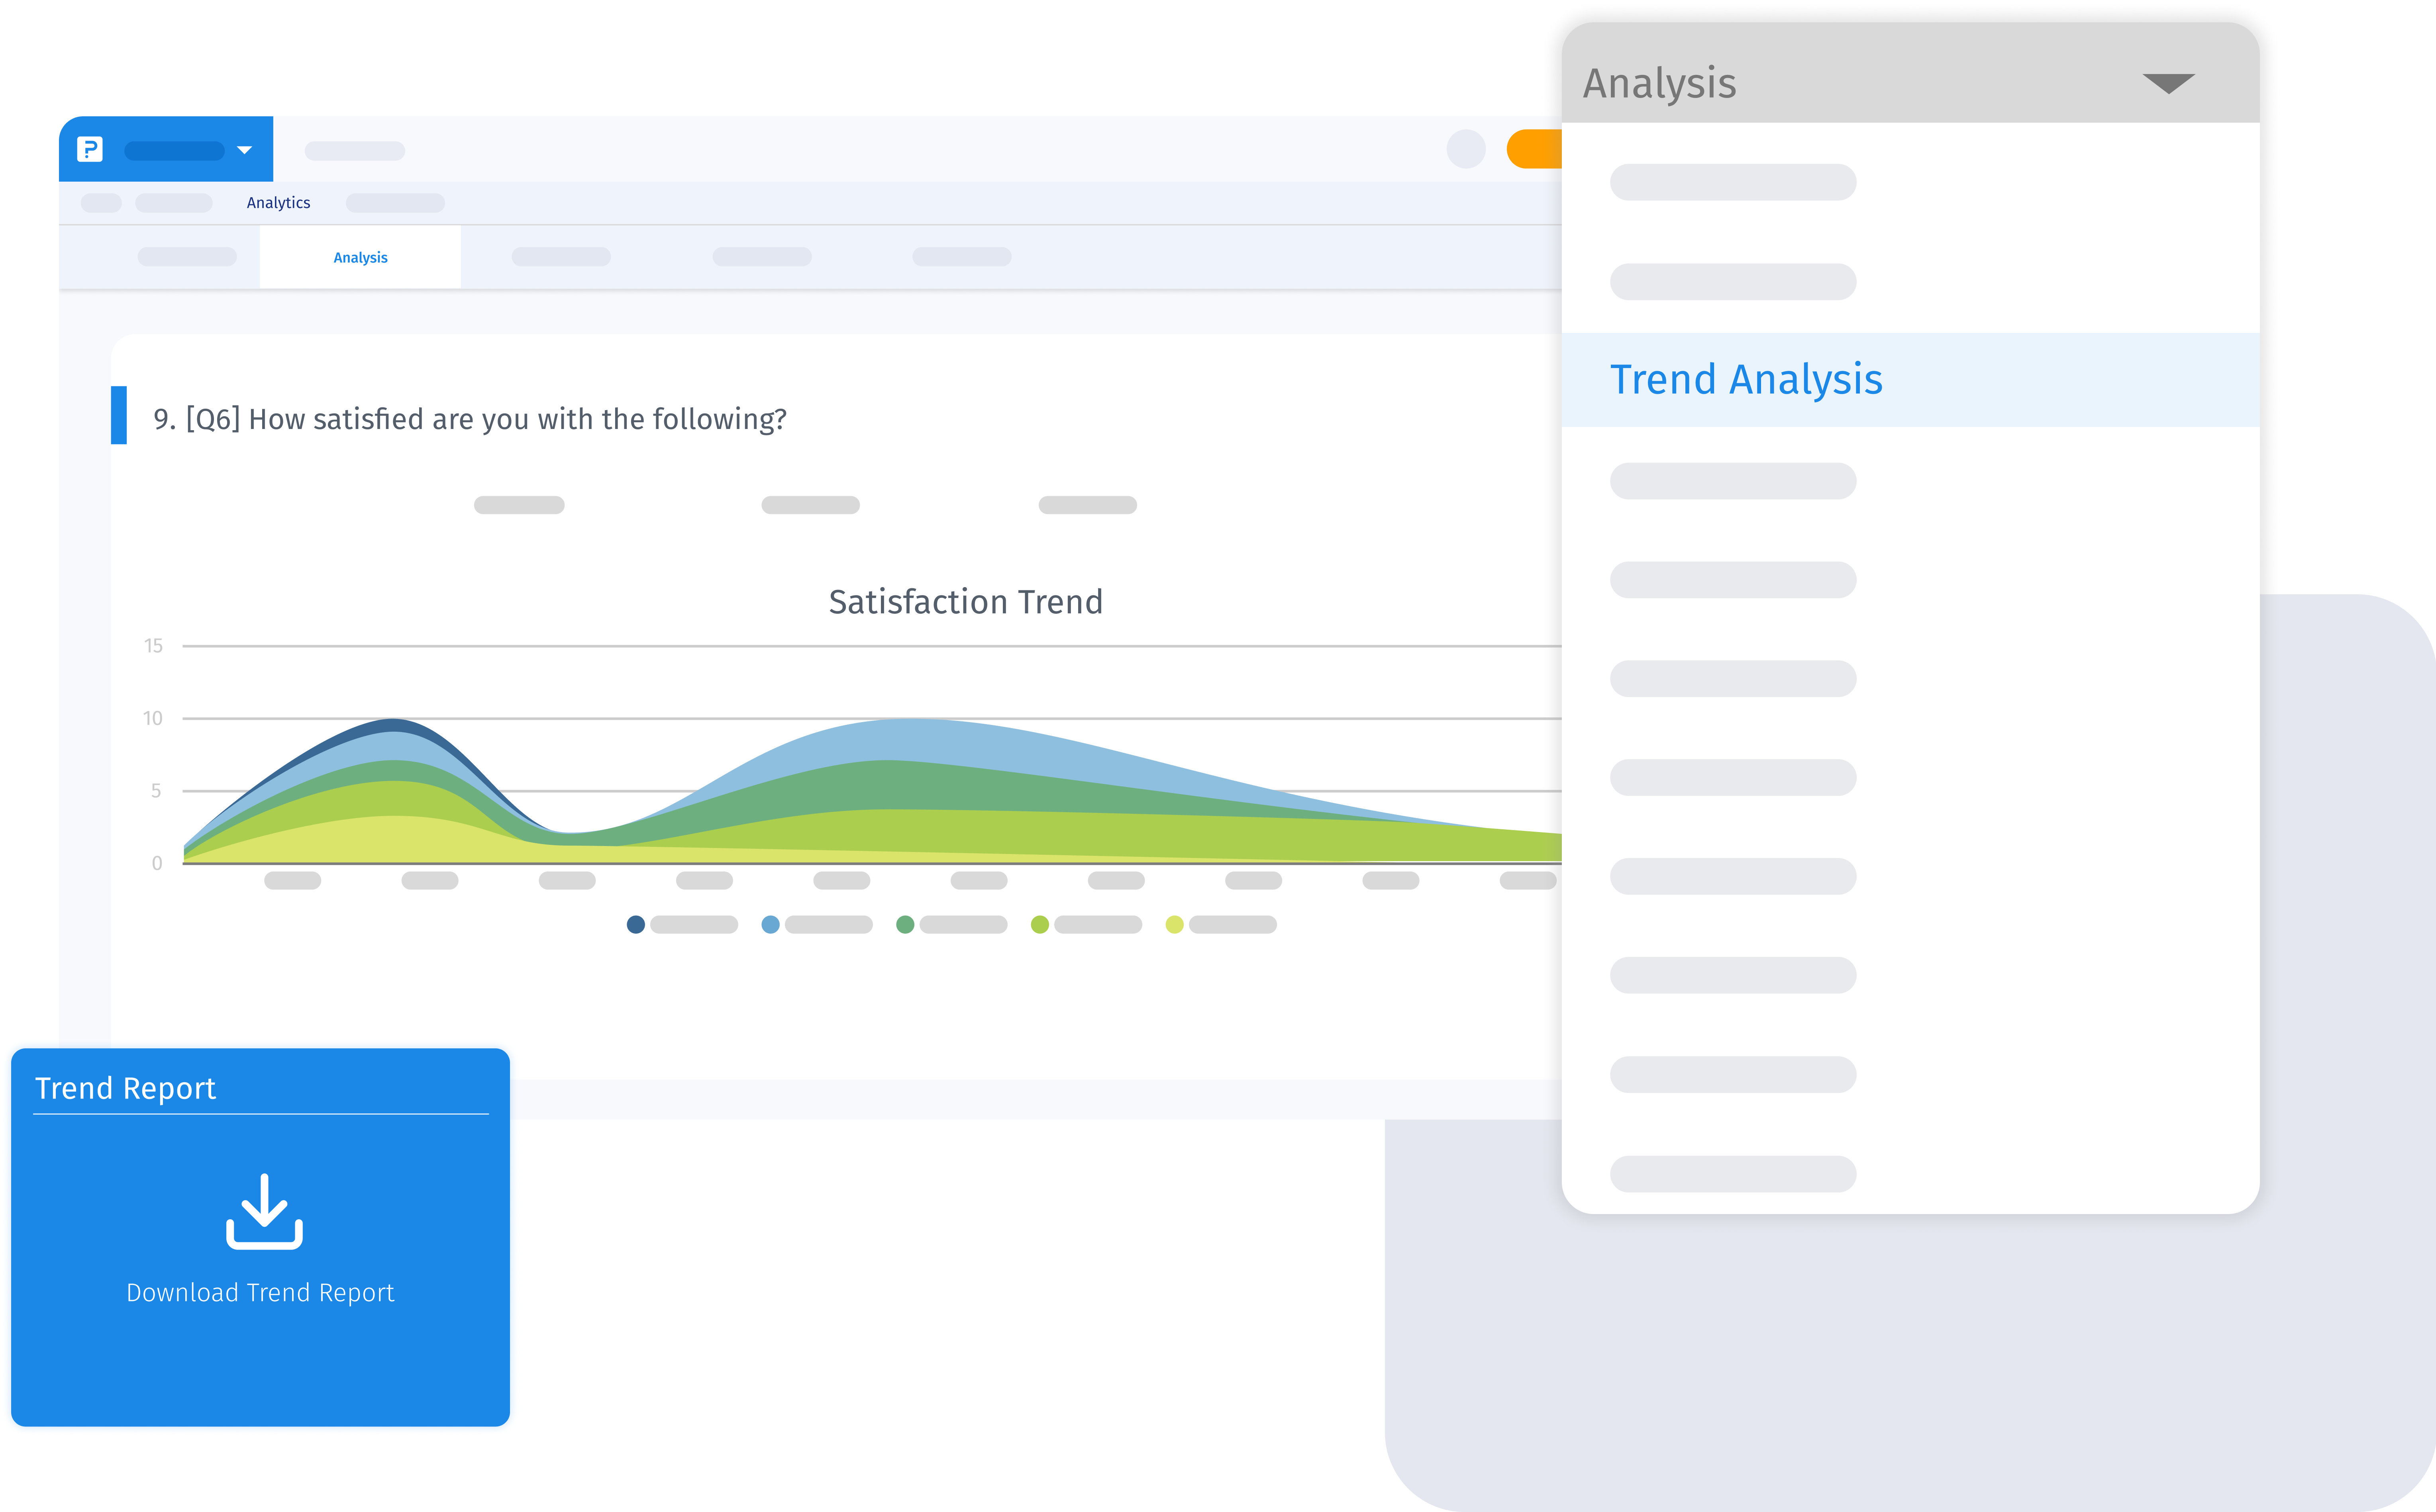
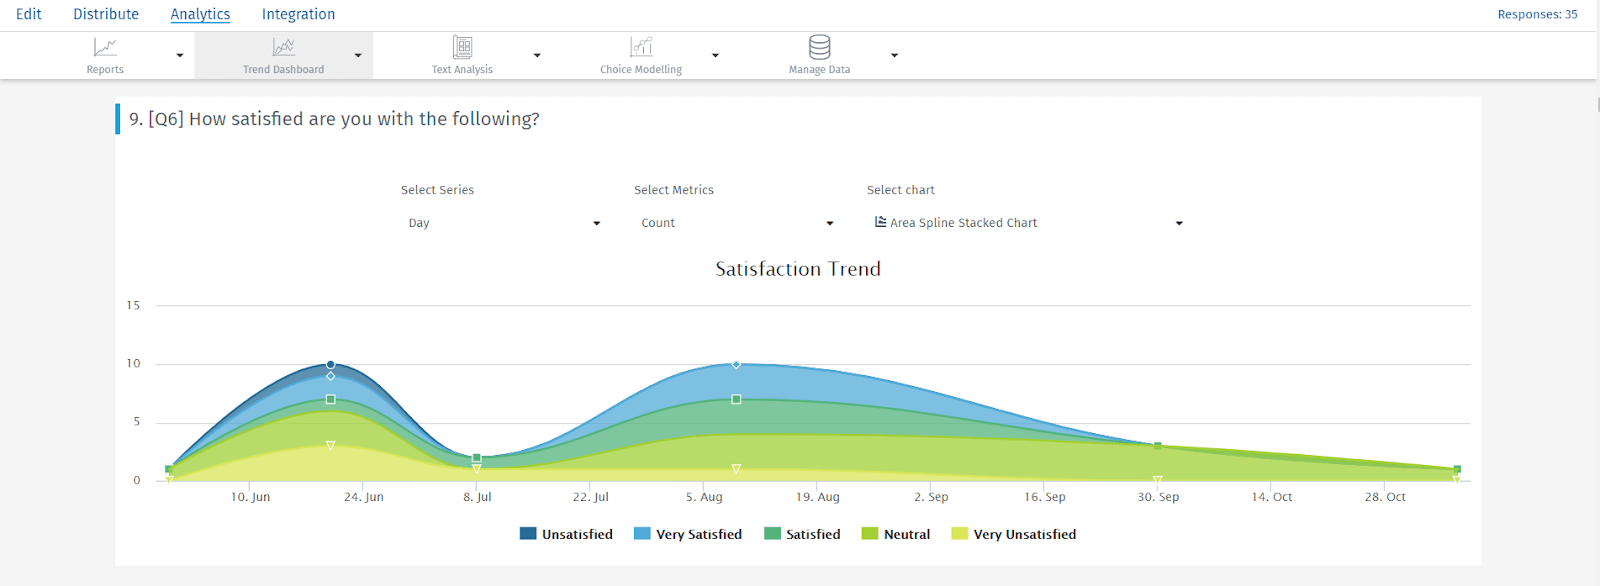
How to Use Trend Analysis in QuestionPro?
This module allows you to plot aggregated response data over time. It is especially valuable if you are conducting a long-running survey and would like to measure differences in perception and responses over time or prepare for trend reversal in the market trends.
Such analysis can be precious as an early warning indicator of potential problems and issues with product line and service level changes that impact customers.
If you want to know more about this feature, start a 10-day free trial (no credit card required), schedule a free demo, and find out everything you can achieve using the best tool to create online surveys.
Get started today!
Are you interested in using this feature? With QuestionPro, you can gain access to this and many more. Do your data collection and research more efficiently than ever!
 Survey Software
Easy to use and accessible for everyone. Design, send and analyze online surveys.
Survey Software
Easy to use and accessible for everyone. Design, send and analyze online surveys.
 Research Suite
A suite of enterprise-grade research tools for market research professionals.
Research Suite
A suite of enterprise-grade research tools for market research professionals.
 Customer Experience
Experiences change the world. Deliver the best with our CX management software.
Customer Experience
Experiences change the world. Deliver the best with our CX management software.
 Employee Experience
Create the best employee experience and act on real-time data from end to end.
Employee Experience
Create the best employee experience and act on real-time data from end to end.