Have you ever bought a house? As one of the most complex purchase decisions you can make, you must consider many preferences. Everything from the location and price to interest rate and quality of local schools can play a factor in your home-buying decision. You can use conjoint analysis to make data-driven decisions that will help you meet customer needs and develop your organization.
Less complicated purchases feature a similar process of choosing a good or service that meets your needs. You just may not be aware you’re making those decisions.
Subconsciously, one person might be more price-sensitive while another is more feature-focused. Understanding which elements consumers consider essential and trivial is the core purpose of conjoint analysis.
What is conjoint analysis?
Conjoint analysis is defined as a survey-based advanced market research analysis method that attempts to understand how people make complex choices. We make choices that require trade-offs every day — so often that we may not even realize it. Even simple decisions like choosing a laundry detergent or deciding to book a flight are mental conjoint studies that contain multiple elements that lead us to our choice.
Conjoint analysis is one of the most effective models for extracting consumer preferences during the purchasing process. This data is then turned into a quantitative measurement using statistical analysis. It evaluates products or services in a way no other method can.
LEARN ABOUT: Data Analytics Projects
Why is it important for researchers?
Researchers consider conjoint analysis as the best survey method for determining customer values. It consists of creating, distributing, and analyzing surveys among customers to model their purchasing decisions based on response analysis.
QuestionPro can automatically compute and analyze numerical values to explain consumer behavior. Our software analyzes responses to see how much value is placed on price, features, geographic location, and other factors. The software then correlates this data to consumer profiles. A software-driven regression analysis of data obtained from real customers makes an accurate report instead of a hypothesis. Practical business intelligence relies on the synergy between analytics and reporting, where analytics uncovers valuable insights, and reporting communicates these findings to stakeholders.
LEARN ABOUT: Consumer Surveys
Reliable, accurate data gives your business the best chance to produce a product or service that meets all your customer’s needs and wants.


Currently, choice-based conjoint analysis is the most popular form of conjoint. Participants are shown a series of options and asked to select the one they would most likely buy. Other types of conjoint include asking participants to rate or rank products. Choosing a product to buy usually yields more accurate results than ranking systems.
We recommend you take a look at this free resource: Conjoint analysis survey template
The survey question shows each participant several choices of products or features. The answers they give allow our software to work out the underlying values. For example, the program can work out its preferred size and how much it would pay for its favorite brand. Once we have the choice data, there is a range of analytic options. The critical tools for analysis include What-if modeling, forecasting, segmentation, and applying cost-benefit analysis.
LEARN ABOUT: Statistical Analysis Methods
Why use conjoint analysis in surveys?
Traditional rating surveys can’t place a value on the different attributes that make up a product. On the other hand, conjoint analysis can sift through respondents’ choices to determine the reasoning for those choices. Analyzing the data gives you the ability to peek into your target audience’s minds and see what they value most in goods or services and acts as a market simulator.
Many businesses shy away from the conjoint analysis because of its seemingly sophisticated design and methodology. But the truth is, you can use this method efficiently, thanks to user-friendly survey software like QuestionPro. Here is a breakdown of conjoint in simple terms, along with a conjoint analysis marketing example.
When to use it?
Over the past 50 years, Conjoint analysis has evolved into a method that market researchers and statisticians implement to predict the kinds of decisions consumers will make about products by using questions in a survey.
The central idea is that consumers evaluate different characteristics of a product and decide which are more relevant to them for any purchase decision. An online conjoint survey’s primary aim is to set distinct values to the alternatives that the buyers may consider when making a purchase decision. Equipped with this knowledge, marketers can target the features of products or services that are highly important and design messages more likely to strike a chord with target buyers.
You can also find best alternatives of Conjoint.ly for your business.
The discrete choice conjoint analysis presents a set of possible decisions to consumers via a survey and asks them to decide which one they would pick. Each concept is composed of a set of attributes (e.g., color, size, price) detailed by a set of levels.
How to use conjoint analysis?
Conjoint models predict respondent preference. For instance, we could have a conjoint study on laptops. The laptop can come in three colors (white, silver, and gold), three screen sizes (11”, 13”, and 15”), and three prices ($200, $400, and $600). This would give 3 x 3 x 3 possible product combinations. In this example, there are three attributes (color, size, and price) with three levels per attribute.
A set of concepts or tasks, based on the defined attributes, are presented to respondents. Respondents make choices as to which product they would purchase in real life. It is important to note that there are a lot of variations of conjoint techniques. QuestionPro’s conjoint analysis software uses choice-based analysis, which most accurately simulates the purchase process of consumers.
LEARN ABOUT: Marketing Insight
Types of conjoint analysis
There are two main types of conjoint analysis: Choice-based Conjoint (CBC) Analysis and Adaptive Conjoint Analysis (ACA).
Discrete choice-based conjoint (CBC) analysis:
This type of conjoint study is the most popular because it asks consumers to imitate the real market’s purchasing behavior: which products they would choose, given specific criteria on price and features.
For example, each product or service has a specific set of fictional characters. Some of these characters might be similar to each other or will differ. For instance, you can present your respondents with the following choice:
| Device 1
| Device 2
|
The devices are almost identical, but device 2 has triple cameras with better configuration, and Device 1 has a higher battery power than Device 2. You would know how vital the trade-off between the number of cameras and battery capacity is by analyzing the responses.
Using the discrete choice model, QuestionPro offers three design types to conduct conjoint analysis:
- Random: This design displays random samples of the possible attributes. For each respondent, the survey software uniquely combines the characteristics. You can run a conjoint concept simulator to know what the choices that the tool will present when you deploy your survey.
- D-Optimal: A flawlessly designed experiment helps researchers estimate parameters without minimum variance and bias. A D-optimal design runs a few tests to investigate or optimize the subject under study. The algorithm helps to create a design that is optimal for the sample size and tasks per respondent.
- Import design: You can also import designs in SPSS format. For example, QuestionPro lets you import fractional factorial orthogonal designs to make use of in surveys.
Adaptive conjoint analysis (ACA):
Researchers use this type of conjoint analysis often in scenarios where the number of attributes/features exceeds what can be done in a choice-based scenario. ACA is great for product design and product segmentation research but not for determining the ideal price.
For example, the adaptive conjoint analysis is a graded-pair comparison task wherein the survey respondents are asked to assess their relative preferences between a set of attributes, and each pair is then evaluated on a predefined point scale.
QuestionPro uses CBC, or Discrete Choice Conjoint Analysis, a great option if the price is one of the most critical factors for you or your customers. The method’s key benefit is that it provides a picture of the market’s willingness to make tradeoffs between various features. The result is an answer to what constitutes an “ideal” product or service.
Conjoint analysis: Key terms
It is a statistical analysis plan used in market research to gain a better understanding of how people make complex decisions. The following are some key terms of it:
- Attributes (Features): The product features are evaluated by the analysis. Examples of characteristics of Laptops: Brand, Size, Color, and Battery Life.
- Levels: The specifications of each attribute. Examples of standards for Laptops include Brands: Samsung, Dell, Apple, and Asus.
- Task: The number of times the respondent must make a choice. The example shows the first of the five functions as indicated by “Step 1 of 5.” 5.”
- Concept or Profile: The hypothetical product or offering. This is a set of attributes with different levels that are displayed at each task count. There are usually at least two to choose from.
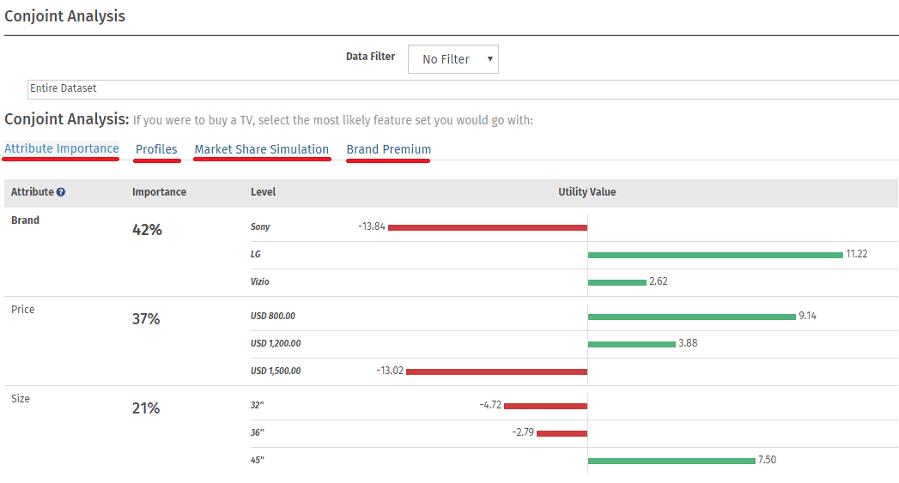
- Relative importance: “attribute importance,” which depicts which of the various attributes of a product/service is more or less important when making a purchasing decision. Example of Laptop Relative Importance: Brand 35%, Price 30%, Size 15%, Battery Life 15%, and Color 5%.
- Part-Worths/Utility values: Part-Worths, or utility values, is how much weight an attribute level carries with a respondent. The individual factors that lead to a product’s overall value to consumers are part-worths. Example part-worths for Laptops Brands: Samsung – 0.11, Dell 0.10, Apple 0.17, and Asus -0.16.
- Profiles: Discover the ultimate product with the highest utility value. At a glance, QuestionPro lets you compare all the possible combinations of product profiles ranked by utility value to build the product or service that the market wants.
- Market share simulation: One of the most unique and fascinating aspects of conjoint analysis is the conjoint simulator. This gives you the ability to “predict” the consumer’s choice for new products and concepts that may not exist. Measure the gain or loss in market share based on changes to existing products in the given market.
- Brand Premium: How much more will help a customer pay for a Samsung versus an LG television? Assigning price as an attribute and tying that to a brand attribute returns a model for a $ per utility distribution. This is leveraged to compute the actual dollar amount relative to any characteristic. When the analysis is done relative to the brand, so you get to put a price on your brand.
- Price elasticity and demand curve: Price elasticity relates to the aggregate demand for a product and the demand curve’s shape. We calculate it by plotting the demand (frequency count/total response) at different price levels.
LEARN ABOUT: Test Market Demand
When is a good time to run a discrete choice-based conjoint study?
We’re asked this question a lot. So much so that we’ve coined the term Conjoint O’ Clock. If you find yourself needing to get into your customers’ minds to understand why they buy, ask yourself what you hope to get from your insights. It’s time for Conjoint O’Clock if you are trying to:
- Launch a new product or service in the market.
- Repackage existing products or services to the market.
- Understand your customers and what they value in your products.
- Gain actionable insight to increase your brand’s competitive edge.
- Place a price on your brand versus competing brands.
- Revamp your pricing structure.
LEARN ABOUT: Pricing Research
Advantages of conjoint analysis
There are multiple advantages to using conjoint analysis in your surveys:
- It helps researchers estimate the tradeoffs that consumers make on a psychological level when they evaluate numerous attributes simultaneously.
- Researchers can measure consumer preferences at an individual level.
- It gives researchers insights into real or hidden drivers that may not be too apparent.
- Conjoint analysis can study the consumers and attributes deeper and create a needs-based segmentation.
Conjoint analysis example
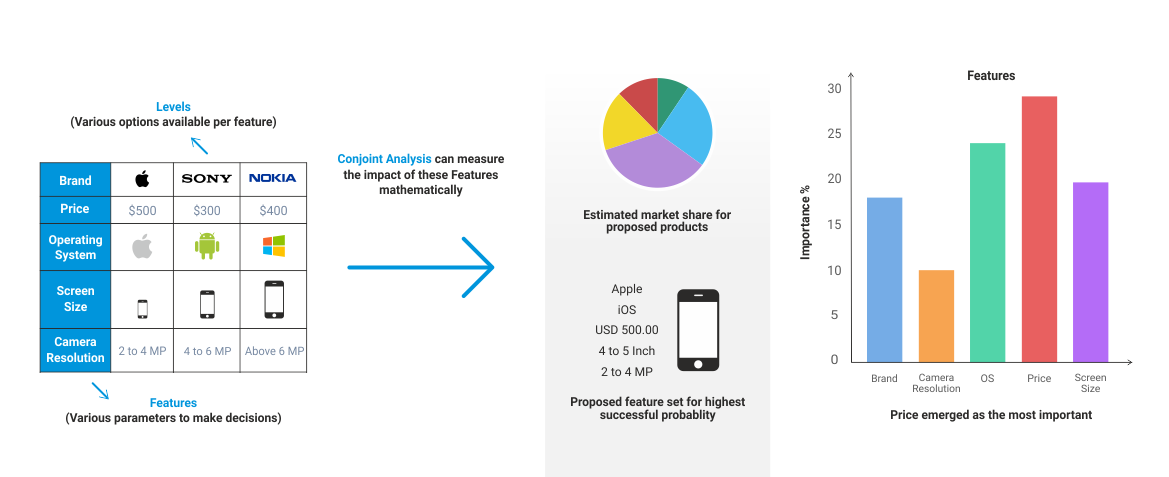
For example, assume a scenario where a product marketer needs to measure individual product features’ impact on the estimated market share or sales revenue.
In this conjoint study example, we’ll assume the product is a mobile phone. The competitors are Apple, Samsung, and Google. The organization needs to understand how different customers value attributes, such as brand, price, screen size, and screen resolution. Armed with this information, they can create their product range to match consumer preferences.
Conjoint analysis assigns values to these product attributes and levels by creating realistic choices and asking people to evaluate them.
LEARN ABOUT: Average Order Value
It enables businesses to mathematically analyze consumer or client behavior and make decisions based on real insights from customer data. This allows them to develop better business strategies that provide a competitive edge. To fulfill customer wishes profitably requires companies to fully understand which aspects of their product and service are most valued.
Conjoint algorithm: How it is works
We use a logic model coupled with a Nelder-Mead Simplex algorithm. It helps to calculate the utility values or part-worths. This algorithm’s benefit allows QuestionPro to offer a cohesive and comprehensive survey experience all within one platform.
We understand that most businesses don’t need the intricate details of our mathematical analysis. However, we want to provide you with the transparency you need to use conjoint survey results. Have confidence in your results by reviewing the algorithm below.
Notation:
- Let there be R respondents, with individuals r = 1 … R
- Let each respondent see T tasks, with t = 1 … T
- Let each task t have C concepts, with c = 1 … C
- If we have A attributes, a = 1 to A, with each attribute having La levels, l = 1 to La, then the part-worth for a particular attribute/level is w’(a,l). In this exercise, we will be solving this (jagged array) of part worths.
- We can simplify this to a one-dimensional array w(s), where the elements are {w′(1, 1), w′(1, 2)…w′(1, L1), w′(2, 1)…w′(A, LA)} with w having S elements.
- A specific concept x can be shown as a one-dimensional array x(s), where x(s)=1 if the specific attribute is available, and 0 otherwise.
- Let Xrtc represent the specific concept of the cth concept in the tth task for the r th respondent. Thus, the experiment design is represented by the four-dimensional matrix X with size RxTxCxS.
- If respondent r chooses concept c in task t then let Yrtc=1; otherwise 0.
- The value Ux of a definite idea is the total of the part-worths for those elements available in the conception, i.e. the scalar product of x and w.
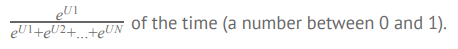
Multinomial logit model
For a simple choice between two concepts, with utilities U1 and U2, the multinomial logit (MNL) model predicts that concept 1 will be chosen.
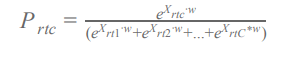
Modeled Choice Probability
Let the choice probability (using MNL model) of choosing the cth concept in the tth task for the r th respondent be:
Log-Likelihood Measure
The Log-Likelihood (LL) measure is calculated as 
Solving for Part-Worths using Maximum Likelihood
We solve for the part-worth vector by finding the vector w that gives the maximum value for LL. Note that we are solving for S variables.
- This is a multi-dimensional, nonlinear continuous maximization research problem, and it is essential to have a standard solver library. We use the Nelder-Mead Simplex Algorithm.
- The Log-Likelihood function should be implemented as a function LL(w, Y, X) and then optimized to find the vector w that gives us a maximum. The responses Y, and the design.
X is specified and constant for a specific development. The starting values for w can be set to the origin 0. The final part-worth values, w, are re-scaled so that the part-worths for any attribute have a mean of zero. This is done by subtracting the mean of the part-worths for all levels of each quality.
Level-up conjoint analysis insights
Although conjoint analysis requires more involvement in survey design and analysis, the additional planning effort is often worth it. With a few extra steps, you get an authentic look into your most significant customer preferences when choosing a product.
Price, for example, is vital to most folks shopping for a laptop. But how much more is the majority willing to pay for longer battery life for their laptop if it means a heavier and bulkier design? How much less in value is a smaller screen size compared to a slightly larger one? Using conjoint surveys, you’ll discover these details before making a considerable investment in product development.
Conjoint is just a piece of the insights pie. Capture the full story with a cohesive pricing, consumer preference, branding, or go-to-market strategy using other question types and delivery methodologies to stretch the project to its full potential. With QuestionPro, you can build and deliver comprehensive surveys that combine conjoint analysis results with insights from additional questions or custom profiling information included in the survey.
Conjoint analysis marketing example
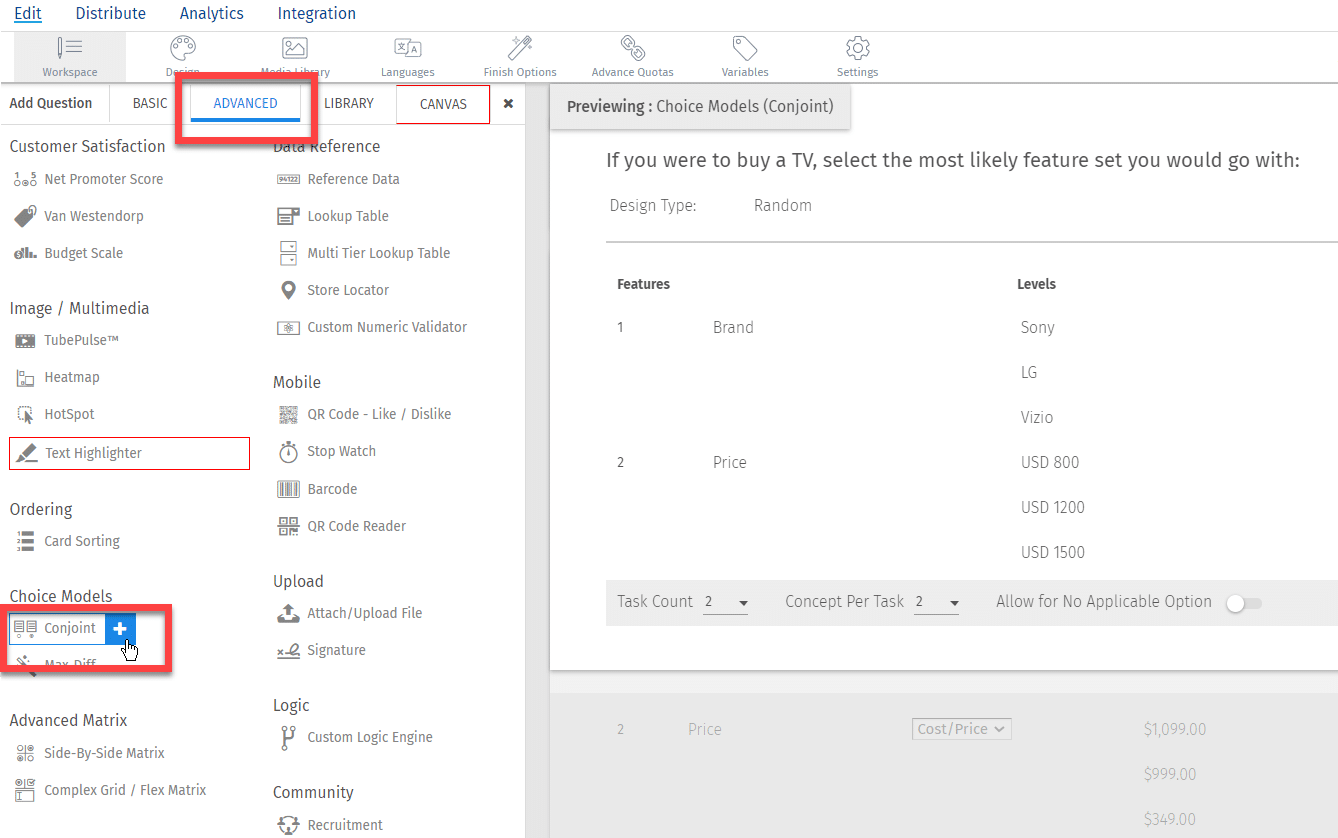
Click on the Add New Question link and select the Conjoint (Discrete Choice) Option from under Advanced Question Types. This will open the wizard-based conjoint question template to create tasks by entering attributes (features) and levels for each of the features.
For example, an organization produces televisions and they are a competitor of Samsung, LG, or Vizio. The organization needs to understand how different customers value specific attributes such as the size, brand, and price of a television. Armed with this information, they can create their very own product range and offering that meets a market need and generates revenue.
Step 2: Enter the features and levels.
Enter the features and levels. Set up the task counts and concepts per task and assign feature types: Price, Brand, or Other. Using television brands as an example, consider the following:
- Features for televisions: Price, Size, Brand.
- Price:$800, $1,200, $1,500
- Size: 36”, 45”, 52”
- Brand: Sony, LG, Vizio
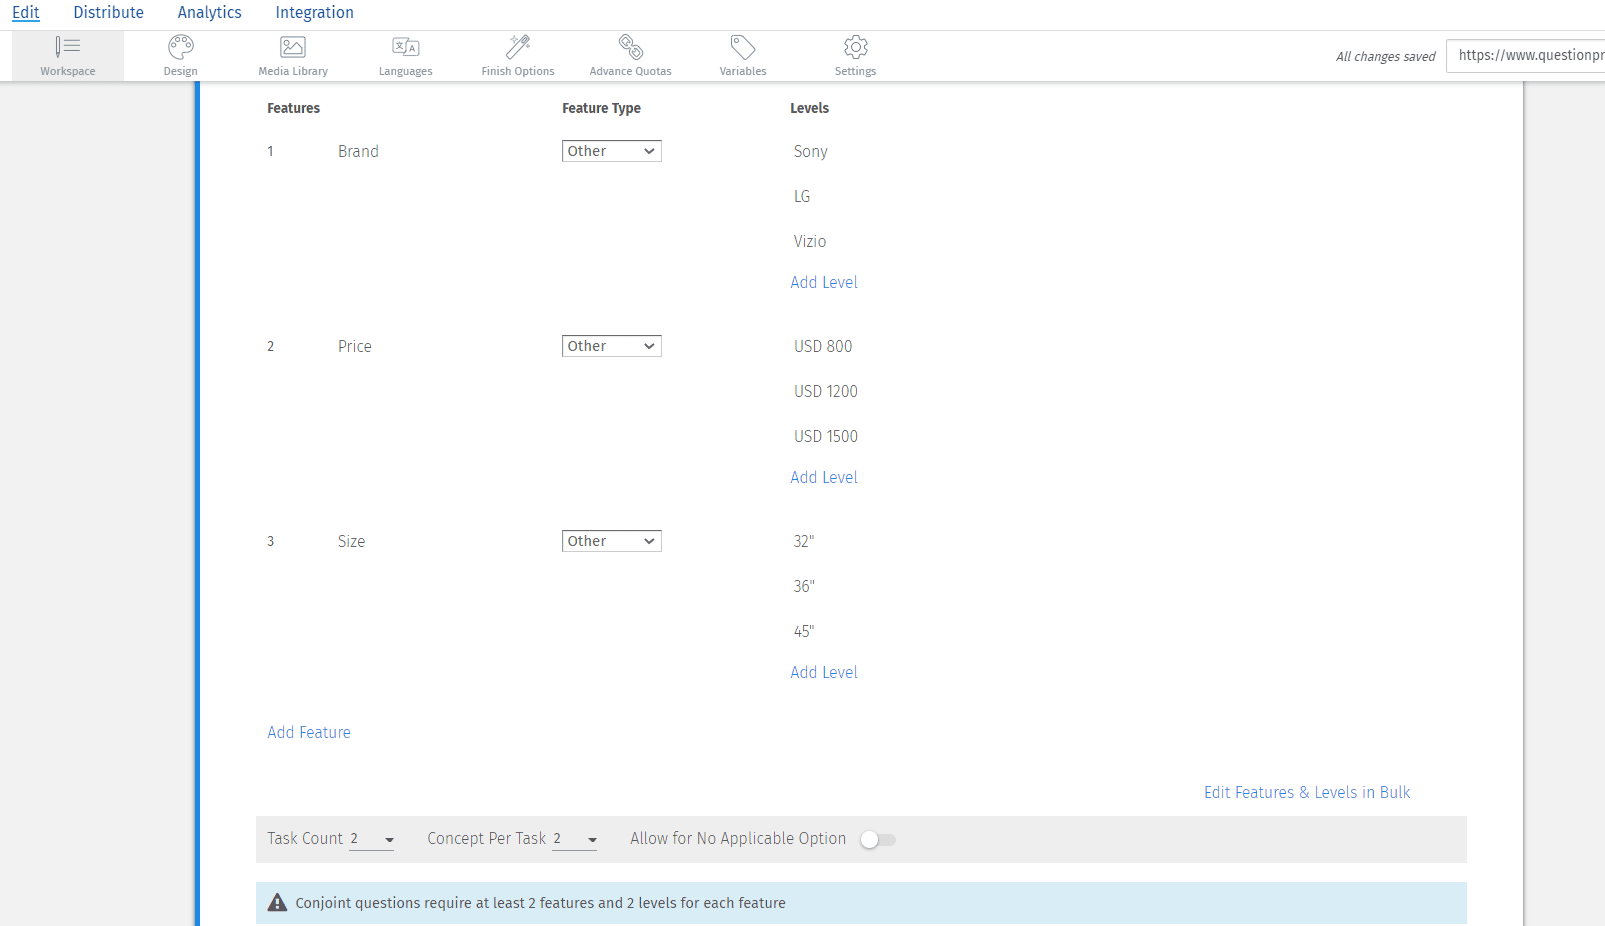
Step 3: Select Design Type to either of the three design types: Random, D-Optimal, and Import.
Step 4: Add additional setting options, including fixed tasks and prohibited concepts.
Step 5: Preview, review text data, and distribute the survey.
In this example, the survey would look like this:

Where can I view Reports for the conjoint questions?
Step 1: Go To Login » Surveys » Analytics » Choice Modelling » Conjoint Analysis
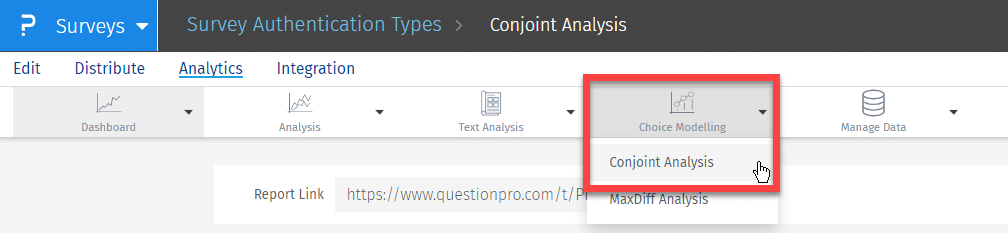
Step 2: Here, you can view the online reports.
Step 3: You can download the data in Excel/CSV or HTML format.
How to conduct conjoint analysis using QuestionPro?
The QuestionPro conjoint analysis offering includes the following tools:
- Conjoint Task Creation Wizard: Wizard-based interface to create Conjoint Tasks based on merely entering features(attributes), like price and levels, like $100 or $200, for each feature.
- Conjoint Design Parameters: Tweak your design by choosing the number of tasks, the number of profiles per task, and the “Not-Applicable” option.
- Utility Calculation: Automatically calculates utilities.
- Relative Importance: Automatically calculates the relative importance of attributes (based on utilities).
- Cross/Segmentation and Filtering: Filter the data based on criteria and then run Relative Importance calculations.
LEARN ABOUT: 12 Best Tools for Researchers
Conclusion
Conjoint analysis is an effective market research technique that helps businesses better understand their customer’s preferences and make educated decisions about product creation, pricing, and marketing strategies.
LEARN ABOUT: Market research vs marketing research
The conjoint analysis provides significant insights into how customers assess different aspects when making purchase decisions by breaking down complex purchasing decisions into smaller components and examining them systematically.
There are several types of conjoint analysis models accessible, each with its own set of advantages and disadvantages. Choosing the best model is determined by the study objectives and the specific characteristics of the market under consideration.
Conjoint analysis is a valuable tool for any company wanting to obtain a better knowledge of its customers and keep ahead of the competition in today’s ever-changing market. If you are thinking about conducting conjoint analysis, QuestionPro is there for you.
QuestionPro provides a comprehensive set of features and tools to assist businesses in conducting conjoint analysis efficiently and effectively, making it a valuable tool for market research professionals. Contact QuestionPro right away!