Quantitative research involves analyzing and gathering numerical data to uncover trends, calculate averages, evaluate relationships, and derive overarching insights. It’s used in various fields, including the natural and social sciences. Quantitative data analysis employs statistical techniques for processing and interpreting numeric data.
Research designs in the quantitative realm outline how data will be collected and analyzed with methods like experiments and surveys. Qualitative methods complement quantitative research by focusing on non-numerical data, adding depth to understanding. Data collection methods can be qualitative or quantitative, depending on research goals. Researchers often use a combination of both approaches to gain a comprehensive understanding of phenomena.
What is Quantitative Research?
Quantitative research is a systematic investigation of phenomena by gathering quantifiable data and performing statistical, mathematical, or computational techniques.
Quantitative research collects statistically significant information from existing and potential customers. It uses sampling methods and sending out online surveys, online polls, and questionnaires, for example.
One of the main characteristics of this type of research is that the results can be depicted in numerical form. After carefully collecting structured observations and understanding these numbers, it’s possible to predict the future of a product or service, establish causal relationships or Causal Research, and make changes accordingly.
Quantitative research primarily centers on the analysis of numerical data and utilizes inferential statistics to derive conclusions that can be extrapolated to the broader population.
An example of a quantitative research study is the survey conducted to understand how long a doctor takes to tend to a patient when the patient walks into the hospital. A patient satisfaction survey can be administered to ask questions like how long a doctor takes to see a patient, how often a patient walks into a hospital, and other such questions, which are dependent variables in the research. This kind of research method is often employed in the social sciences, and it involves using mathematical frameworks and theories to effectively present data, ensuring that the results are logical, statistically sound, and unbiased.
Data collection in quantitative research uses a structured method and is typically conducted on larger samples representing the entire population. Researchers use quantitative methods to collect numerical data, which is then subjected to statistical analysis to determine statistically significant findings. This approach is valuable in both experimental research and social research. It helps in making informed decisions and drawing reliable conclusions based on quantitative data.
Quantitative Research Characteristics
Quantitative research has several unique characteristics that make it well-suited for specific projects. Let’s explore the most crucial of these characteristics so that you can consider them when planning your next research project:
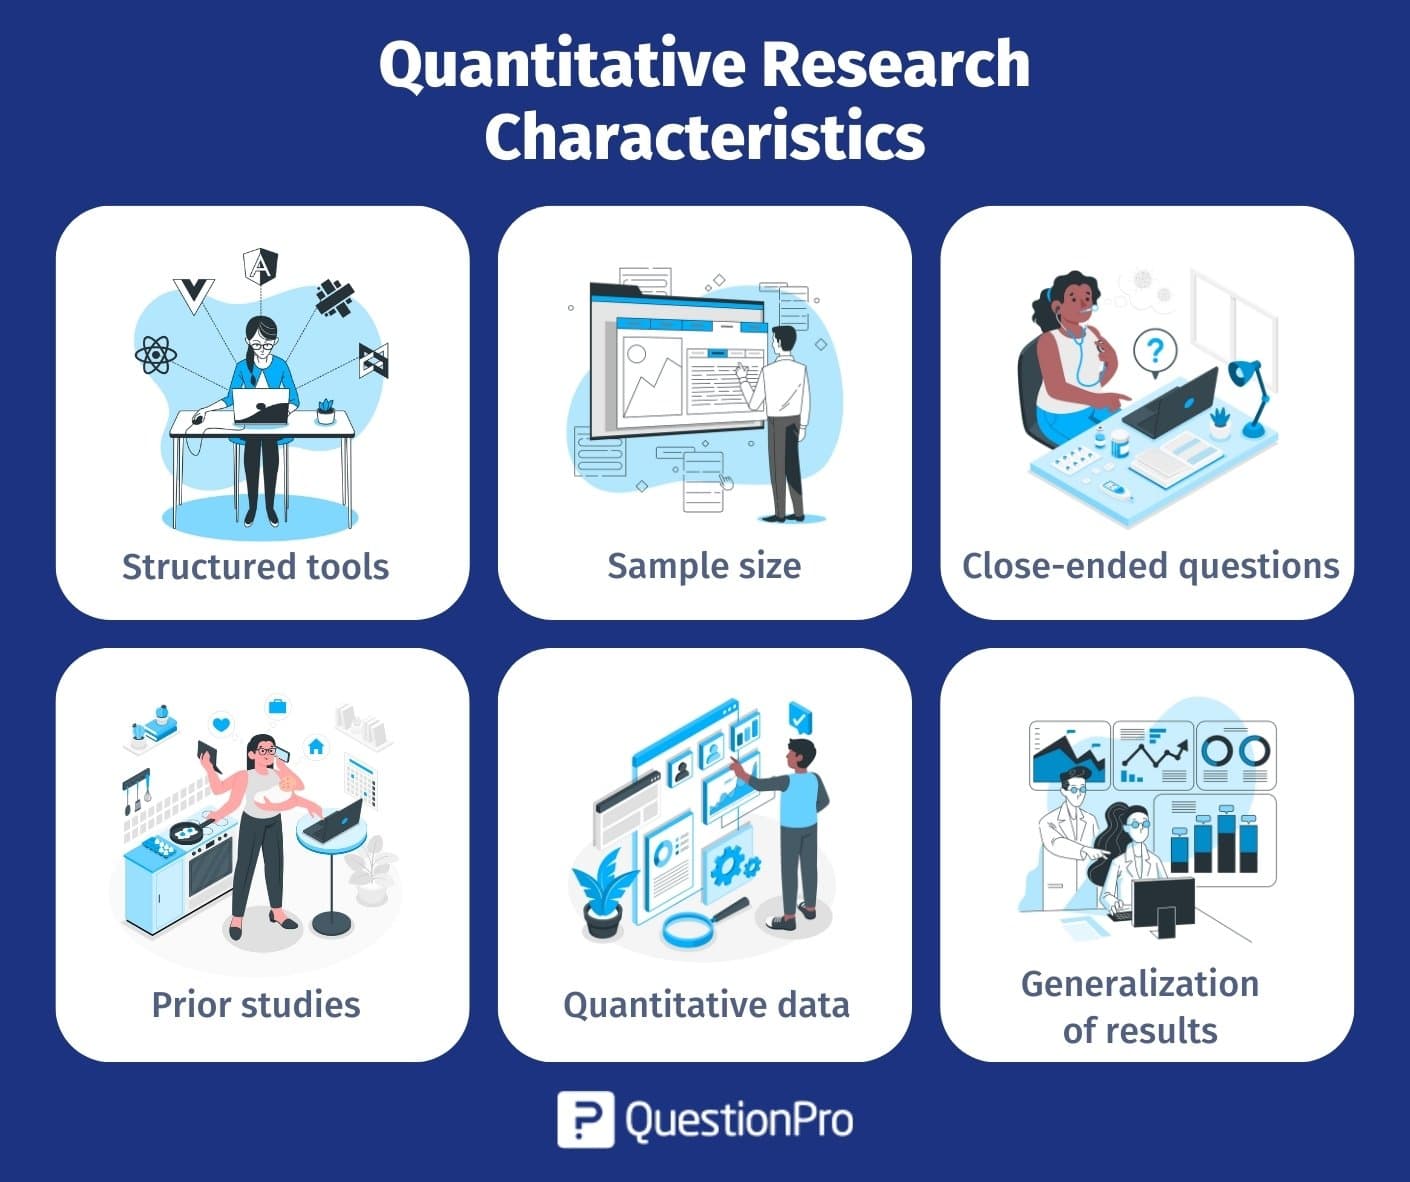
- Structured tools: Quantitative research relies on structured tools such as surveys, polls, or questionnaires to gather quantitative data. Using such structured methods helps collect in-depth and actionable numerical data from the survey respondents, making it easier to perform data analysis.
- Sample size: Quantitative research is conducted on a significant sample size representing the target market. Appropriate Survey Sampling methods, a fundamental aspect of quantitative research methods, must be employed when deriving the sample to fortify the research objective and ensure the reliability of the results.
- Close-ended questions: Closed-ended questions, specifically designed to align with the research objectives, are a cornerstone of quantitative research. These questions facilitate the collection of quantitative data and are extensively used in data collection processes.
- Prior studies: Before collecting feedback from respondents, researchers often delve into previous studies related to the research topic. This preliminary research helps frame the study effectively and ensures the data collection process is well-informed.
- Quantitative data: Typically, quantitative data is represented using tables, charts, graphs, or other numerical forms. This visual representation aids in understanding the collected data and is essential for rigorous data analysis, a key component of quantitative research methods.
- Generalization of results: One of the strengths of quantitative research is its ability to generalize results to the entire population. It means that the findings derived from a sample can be extrapolated to make informed decisions and take appropriate actions for improvement based on numerical data analysis.
Quantitative Research Methods
Quantitative research methods are systematic approaches used to gather and analyze numerical data to understand and draw conclusions about a phenomenon or population. They are usually divided into two large groups to understand and organize them easily.:
- Primary quantitative research methods
- Secondary quantitative research methods
Primary Quantitative Research Methods
Primary quantitative research is the most widely used method of conducting market research. The distinct feature of primary research is that the researcher focuses on collecting data directly rather than depending on data collected from previously done research. Primary quantitative research design can be broken down into three further distinctive tracks and the process flow. They are:
A. Techniques and Types of Primary Studies
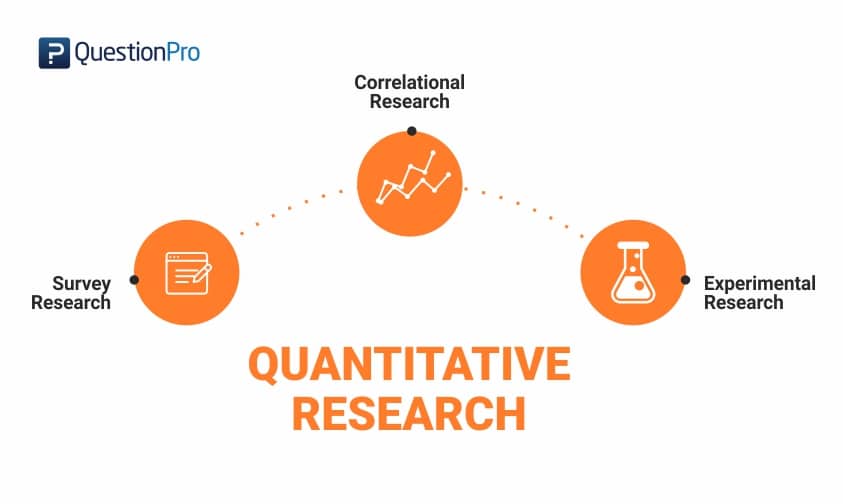
There are multiple types of primary quantitative research. They can be distinguished into the four following distinctive methods, which are:
01. Survey Research
Survey Research is fundamental for all quantitative outcome research methodologies and studies. Surveys are used to ask questions to a sample of respondents, using various types such as online polls, online surveys, paper questionnaires, web-intercept surveys, etc. Every small and big organization intends to understand what their customers think about their products and services, how well new features are faring in the market, and other such details.
By conducting survey research, an organization can ask multiple survey questions, collect data from a pool of customers, and analyze this collected data to produce numerical results. It is the first step towards collecting data for any research. You can use single ease questions. A single-ease question is a straightforward query that elicits a concise and uncomplicated response.
This type of research can be conducted with a specific target audience group and also can be conducted across multiple groups along with comparative analysis. A prerequisite for this type of research is that the sample of respondents must have randomly selected members. This way, a researcher can easily maintain the accuracy of the obtained results as a huge variety of respondents will be addressed using random selection.
Traditionally, survey research was conducted face-to-face or via phone calls. Still, with the progress made by online mediums such as email or social media, survey research has also spread to online mediums.There are two types of surveys, either of which can be chosen based on the time in hand and the kind of data required:
Cross-sectional surveys
Cross-sectional surveys are observational surveys conducted in situations where the researcher intends to collect data from a sample of the target population at a given point in time. Researchers can evaluate various variables at a particular time. Data gathered using this type of survey is from people who depict similarity in all variables except the variables which are considered for research. Throughout the survey, this one variable will stay constant.
- Cross-sectional surveys are popular with retail, SMEs, and healthcare industries. Information is garnered without modifying any parameters in the variable ecosystem.
- Multiple samples can be analyzed and compared using a cross-sectional survey research method.
- Multiple variables can be evaluated using this type of survey research.
- The only disadvantage of cross-sectional surveys is that the cause-effect relationship of variables cannot be established as it usually evaluates variables at a particular time and not across a continuous time frame.
Longitudinal surveys
Longitudinal surveys are also observational surveys, but unlike cross-sectional surveys, longitudinal surveys are conducted across various time durations to observe a change in respondent behavior and thought processes. This time can be days, months, years, or even decades. For instance, a researcher planning to analyze the change in buying habits of teenagers over 5 years will conduct longitudinal surveys.
- In cross-sectional surveys, the same variables were evaluated at a given time, and in longitudinal surveys, different variables can be analyzed at different intervals.
- Longitudinal surveys are extensively used in the field of medicine and applied sciences. Apart from these two fields, they are also used to observe a change in the market trend analysis, analyze customer satisfaction, or gain feedback on products/services.
- In situations where the sequence of events is highly essential, longitudinal surveys are used.
- Researchers say that when research subjects need to be thoroughly inspected before concluding, they rely on longitudinal surveys.
02. Correlational Research
A comparison between two entities is invariable. Correlation research is conducted to establish a relationship between two closely-knit entities and how one impacts the other, and what changes are eventually observed. This research method is carried out to give value to naturally occurring relationships, and a minimum of two different groups are required to conduct this quantitative research method successfully. Without assuming various aspects, a relationship between two groups or entities must be established.
Researchers use this quantitative research design to correlate two or more variables using mathematical analysis methods. Patterns, relationships, and trends between variables are concluded as they exist in their original setup. The impact of one of these variables on the other is observed, along with how it changes the relationship between the two variables. Researchers tend to manipulate one of the variables to attain the desired results.
Ideally, it is advised not to make conclusions merely based on correlational research. This is because it is not mandatory that if two variables are in sync that they are interrelated.
Example of Correlational Research Questions:
- The relationship between stress and depression:
Is there a significant correlation between levels of stress and symptoms of depression among adults? - The equation between fame and money:
What is the relationship between an individual’s level of fame and their financial earnings? - The relation between activities in a third-grade class and its students:
How do classroom activities influence the academic performance and social development of third-grade students?
03. Causal-comparative Research
This research method mainly depends on the factor of comparison. Also called quasi-experimental research, this quantitative research method is used by researchers to conclude the cause-effect equation between two or more variables, where one variable is dependent on the other independent variable. The independent variable is established but not manipulated, and its impact on the dependent variable is observed. These variables or groups must be formed as they exist in the natural setup. As the dependent and independent variables will always exist in a group, it is advised that the conclusions are carefully established by keeping all the factors in mind.
Causal-comparative research is not restricted to the statistical analysis of two variables but extends to analyzing how various variables or groups change under the influence of the same changes. This research is conducted irrespective of the type of relationship that exists between two or more variables. Statistical analysis plan is used to present the outcome using this quantitative research method.
Example of Causal-Comparative Research Questions:
- The impact of drugs on a teenager:
How do different types of drug use affect the academic performance and social behavior of teenagers? - The effect of good education on a freshman:
What is the effect of receiving a quality education in high school on the academic success of college freshmen? - The effect of substantial food provision in the villages of Africa:
How does substantial food provision impact the health and economic productivity of villagers in rural African communities?
04. Experimental Research
Also known as true experimentation, this research method relies on a theory. As the name suggests, experimental research is usually based on one or more theories. This theory has yet to be proven before and is merely a supposition. In experimental research, an analysis is done around proving or disproving the statement. This research method is used in natural sciences. Traditional research methods are more effective than modern techniques.
There can be multiple theories in experimental research. A theory is a statement that can be verified or refuted.
After establishing the statement, efforts are made to understand whether it is valid or invalid. This quantitative research method is mainly used in natural or social sciences as various statements must be proved right or wrong.
- Traditional research methods are more effective than modern techniques.
- Systematic teaching schedules help children who struggle to cope with the course.
- It is a boon to have responsible nursing staff for ailing parents.
B. Data Collection Methodologies
The second major step in primary quantitative research is data collection. Data collection can be divided into sampling methods and data collection using surveys and polls.
01. Data Collection Methodologies: Sampling Methods
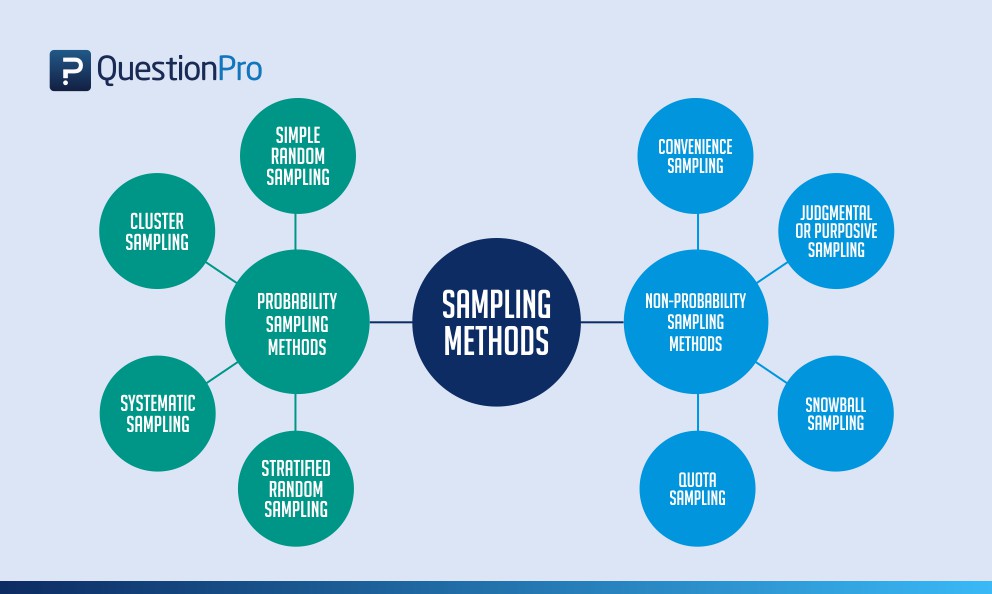
There are two main sampling methods for quantitative research: Probability and Non-probability sampling.
Probability sampling
A theory of probability is used to filter individuals from a population and create samples in probability sampling. Participants of a sample are chosen by random selection processes. Each target audience member has an equal opportunity to be selected in the sample.
There are four main types of probability sampling:
- Simple random sampling: As the name indicates, simple random sampling is nothing but a random selection of elements for a sample. This sampling technique is implemented where the target population is considerably large.
- Stratified random sampling: In the stratified random sampling method, a large population is divided into groups (strata), and members of a sample are chosen randomly from these strata. The various segregated strata should ideally not overlap one another.
- Cluster sampling: Cluster sampling is a probability sampling method using which the main segment is divided into clusters, usually using geographic segmentation and demographic segmentation parameters.
- Systematic sampling: Systematic sampling is a technique where the starting point of the sample is chosen randomly, and all the other elements are chosen using a fixed interval. This interval is calculated by dividing the population size by the target sample size.
Non-probability sampling
Non-probability sampling is where the researcher’s knowledge and experience are used to create samples. Because of the researcher’s involvement, not all the target population members have an equal probability of being selected to be a part of a sample.
There are five non-probability sampling models:
- Convenience sampling: In convenience sampling, elements of a sample are chosen only due to one prime reason: their proximity to the researcher. These samples are quick and easy to implement as there is no other parameter of selection involved.
- Consecutive sampling: Consecutive sampling is quite similar to convenience sampling, except for the fact that researchers can choose a single element or a group of samples and conduct research consecutively over a significant period and then perform the same process with other samples.
- Quota sampling: Using quota sampling, researchers can select elements using their knowledge of target traits and personalities to form strata. Members of various strata can then be chosen to be a part of the sample as per the researcher’s understanding.
- Snowball sampling: Snowball sampling is conducted with target audiences who are difficult to contact and get information. It is popular in cases where the target audience for analysis research is rare to put together.
- Judgmental sampling: Judgmental sampling is a non-probability sampling method where samples are created only based on the researcher’s experience and research skill.
02. Data collection methodologies: Using surveys & polls

Once the sample is determined, then either surveys or polls can be distributed to collect the data for quantitative research.
Using surveys for primary quantitative research
A survey is defined as a research method used for collecting data from a pre-defined group of respondents to gain information and insights on various topics of interest. The ease of survey distribution and the wide number of people it can reach depending on the research time and objective makes it one of the most important aspects of conducting quantitative research.
Fundamental levels of measurement – nominal, ordinal, interval, and ratio scales
Four measurement scales are fundamental to creating a multiple-choice question in a survey. They are nominal, ordinal, interval, and ratio measurement scales without the fundamentals of which no multiple-choice questions can be created. Hence, it is crucial to understand these measurement levels to develop a robust survey.
Use of different question types
To conduct quantitative research, close-ended questions must be used in a survey. They can be a mix of multiple question types, including multiple-choice questions like semantic differential scale questions, rating scale questions, etc.
Survey Distribution and Survey Data Collection
In the above, we have seen the process of building a survey along with the research design to conduct primary quantitative research. Survey distribution to collect data is the other important aspect of the survey process. There are different ways of survey distribution. Some of the most commonly used methods are:
- Email: Sending a survey via email is the most widely used and effective survey distribution method. This method’s response rate is high because the respondents know your brand. You can use the QuestionPro email management feature to send out and collect survey responses.
- Buy respondents: Another effective way to distribute a survey and conduct primary quantitative research is to use a sample. Since the respondents are knowledgeable and are on the panel by their own will, responses are much higher.
- Embed survey on a website: Embedding a survey on a website increases a high number of responses as the respondent is already in close proximity to the brand when the survey pops up.
- Social distribution: Using social media to distribute the survey aids in collecting a higher number of responses from the people that are aware of the brand.
- QR code: QuestionPro QR codes store the URL for the survey. You can print/publish this code in magazines, signs, business cards, or on just about any object/medium.
- SMS survey: The SMS survey is a quick and time-effective way to collect a high number of responses.
- Offline Survey App: The QuestionPro App allows users to circulate surveys quickly, and the responses can be collected both online and offline.
Survey example
An example of a survey is a short customer satisfaction (CSAT) survey that can quickly be built and deployed to collect feedback about what the customer thinks about a brand and how satisfied and referenceable the brand is.
Using polls for primary quantitative research
Polls are a method to collect feedback using close-ended questions from a sample. The most commonly used types of polls are election polls and exit polls. Both of these are used to collect data from a large sample size but using basic question types like multiple-choice questions.
C. Data Analysis Techniques
The third aspect of primary quantitative research design is data analysis. After collecting raw data, there must be an analysis of this data to derive statistical inferences from this research. It is important to relate the results to the research objective and establish the statistical relevance of the results.
Remember to consider aspects of research that were not considered for the data collection process and report the difference between what was planned vs. what was actually executed.
It is then required to select precise Statistical Analysis Methods, such as SWOT, Conjoint, Cross-tabulation, etc., to analyze the quantitative data.
- SWOT analysis: SWOT Analysis stands for the acronym of Strengths, Weaknesses, Opportunities, and Threat analysis. Organizations use this statistical analysis technique to evaluate their performance internally and externally to develop effective strategies for improvement.
- Conjoint Analysis: Conjoint Analysis is a market analysis method to learn how individuals make complicated purchasing decisions. Trade-offs are involved in an individual’s daily activities, and these reflect their ability to decide from a complex list of product/service options.
- Cross-tabulation: Cross-tabulation is one of the preliminary statistical market analysis methods which establishes relationships, patterns, and trends within the various parameters of the research study.
- TURF Analysis:TURF Analysis, an acronym for Totally Unduplicated Reach and Frequency Analysis, is executed in situations where the reach of a favorable communication source is to be analyzed along with the frequency of this communication. It is used for understanding the potential of a target market.
Inferential statistics methods such as confidence interval, the margin of error, etc., can then be used to provide results.
Secondary Quantitative Research Methods
Secondary quantitative research or desk research is a research method that involves using already existing data or secondary data. Existing data is summarized and collated to increase the overall effectiveness of the research.
This research method involves collecting quantitative data from existing data sources like the internet, government resources, libraries, research reports, etc. Secondary quantitative research helps to validate the data collected from primary quantitative research and aid in strengthening or proving, or disproving previously collected data.
The following are five popularly used secondary quantitative research methods:
- Data available on the internet: With the high penetration of the internet and mobile devices, it has become increasingly easy to conduct quantitative research using the internet. Information about most research topics is available online, and this aids in boosting the validity of primary quantitative data.
- Government and non-government sources: Secondary quantitative research can also be conducted with the help of government and non-government sources that deal with market research reports. This data is highly reliable and in-depth and hence, can be used to increase the validity of quantitative research design.
- Public libraries: Now a sparingly used method of conducting quantitative research, it is still a reliable source of information, though. Public libraries have copies of important research that was conducted earlier. They are a storehouse of valuable information and documents from which information can be extracted.
- Educational institutions: Educational institutions conduct in-depth research on multiple topics. And hence, the reports that they publish are an important source of validation in quantitative research.
- Commercial information sources: Local newspapers, journals, magazines, radio, and TV stations are great sources to obtain data for secondary quantitative research. These commercial information sources have in-depth, first-hand information on market research, demographic segmentation, and similar subjects.
Quantitative Research Examples
Some examples of quantitative research are:
- A customer satisfaction template can be used if any organization would like to conduct a customer satisfaction (CSAT) survey. Through this kind of survey, an organization can collect quantitative data and metrics on the goodwill of the brand or organization in the customer’s mind based on multiple parameters such as product quality, pricing, customer experience, etc. This data can be collected by asking a net promoter score (NPS) question, matrix table questions, etc. that provide data in the form of numbers that can be analyzed and worked upon.
- Another example of quantitative research is an organization that conducts an event, collecting feedback from attendees about the value they see from the event. By using an event survey, the organization can collect actionable feedback about the satisfaction levels of customers during various phases of the event such as the sales, pre and post-event, the likelihood of recommending the organization to their friends and colleagues, hotel preferences for the future events and other such questions.
Quantitative Research vs Qualitative Research
Quantitative research and qualitative research are two distinct approaches to conducting research, each with its own set of methods and objectives. Here’s a comparison of the two:
Quantitative Research
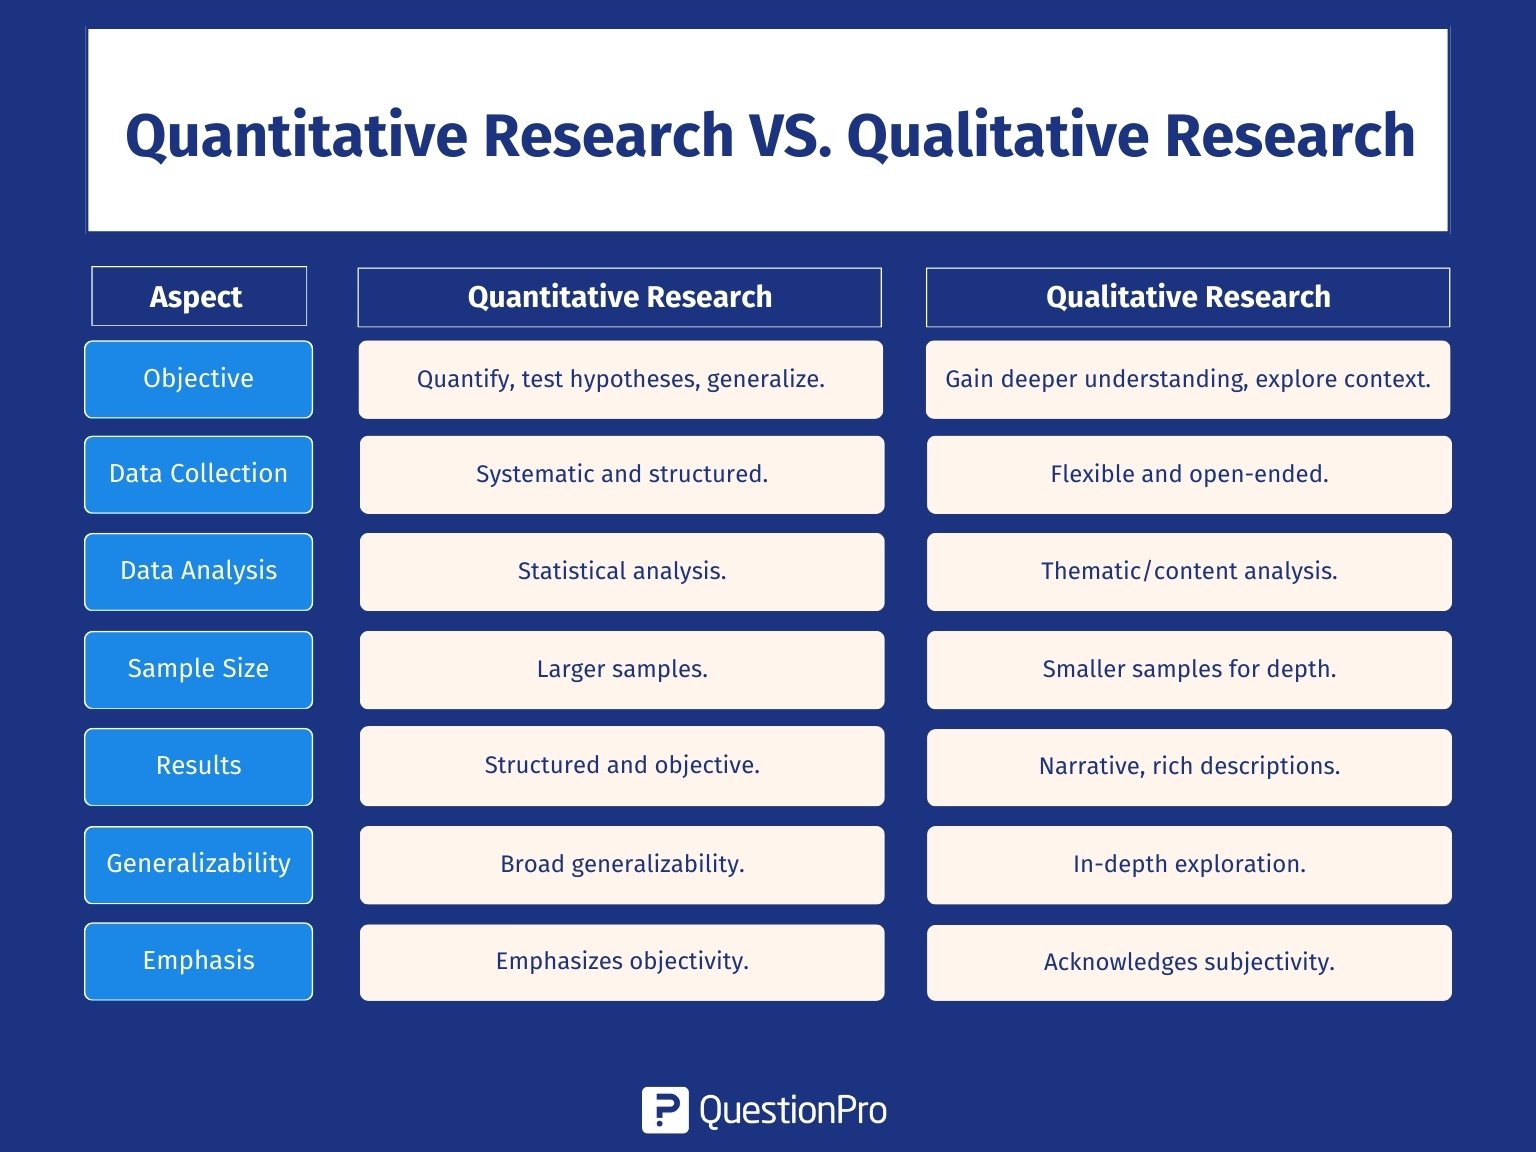
- Objective: The primary goal of quantitative research is to quantify and measure phenomena by collecting numerical data. It aims to test hypotheses, establish patterns, and generalize findings to a larger population.
- Data Collection: Quantitative research employs systematic and standardized approaches for data collection, including techniques like surveys, experiments, and observations that involve predefined variables. It is often collected from a large and representative sample.
- Data Analysis: Data is analyzed using statistical techniques, such as descriptive statistics, inferential statistics, and mathematical modeling. Researchers use statistical tests to draw conclusions and make generalizations based on numerical data.
- Sample Size: Quantitative research often involves larger sample sizes to ensure statistical significance and generalizability.
- Results: The results are typically presented in tables, charts, and statistical summaries, making them highly structured and objective.
- Generalizability: Researchers intentionally structure quantitative research to generate outcomes that can be helpful to a larger population, and they frequently seek to establish causative connections.
- Emphasis on Objectivity: Researchers aim to minimize bias and subjectivity, focusing on replicable and objective findings.
Qualitative Research
- Objective: Qualitative research seeks to gain a deeper understanding of the underlying motivations, behaviors, and experiences of individuals or groups. It explores the context and meaning of phenomena.
- Data Collection: Qualitative research employs adaptable and open-ended techniques for data collection, including methods like interviews, focus groups, observations, and content analysis. It allows participants to express their perspectives in their own words.
- Data Analysis: Data is analyzed through thematic analysis, content analysis, or grounded theory. Researchers focus on identifying patterns, themes, and insights in the data.
- Sample Size: Qualitative research typically involves smaller sample sizes due to the in-depth nature of data collection and analysis.
- Results: Findings are presented in narrative form, often in the participants’ own words. Results are subjective, context-dependent, and provide rich, detailed descriptions.
- Generalizability: Qualitative research does not aim for broad generalizability but focuses on in-depth exploration within a specific context. It provides a detailed understanding of a particular group or situation.
- Emphasis on Subjectivity: Researchers acknowledge the role of subjectivity and the researcher’s influence on the Research Process. Participant perspectives and experiences are central to the findings.
Researchers choose between quantitative and qualitative research methods based on their research objectives and the nature of the research question. Each approach has its advantages and drawbacks, and the decision between them hinges on the particular research objectives and the data needed to address research inquiries effectively.
What are the Advantages of Quantitative Research?
There are many advantages to quantitative research. Some of the major advantages of why researchers use this method in market research are:

Collect Reliable and Accurate Data:
Quantitative research is a powerful method for collecting reliable and accurate quantitative data. Since data is collected, analyzed, and presented in numbers, the results obtained are incredibly reliable and objective. Numbers do not lie and offer an honest and precise picture of the conducted research without discrepancies. In situations where a researcher aims to eliminate bias and predict potential conflicts, quantitative research is the method of choice.
Quick Data Collection:
Quantitative research involves studying a group of people representing a larger population. Researchers use a survey or another quantitative research method to efficiently gather information from these participants. It makes the process of analyzing the data and identifying patterns faster and more manageable through the use of statistical analysis. This advantage makes quantitative research an attractive option for projects with time constraints.
Wider Scope of Data Analysis:
Quantitative research, thanks to its utilization of statistical methods, offers an extensive range of data collection and analysis. Researchers can explore a broader spectrum of variables and relationships within the data. It can enable a more thorough comprehension of the subject under investigation. This expanded scope is precious when dealing with complex research questions that require in-depth numerical analysis.
Eliminate Bias:
One of the significant advantages of quantitative research is its ability to eliminate bias. This research method leaves no room for personal comments or the biasing of results, as the findings are presented in numerical form. This objectivity makes the results fair and reliable in most cases, reducing the potential for researcher bias or subjectivity.
In summary, quantitative research involves collecting, analyzing, and presenting quantitative data using statistical analysis. It offers numerous advantages, including:
- The collection of reliable and accurate data
- Quick data collection
- A broader scope of data analysis
- The elimination of bias
These advantages makes it a valuable approach in the field of research. When considering the benefits of quantitative research, it’s essential to recognize its strengths in contrast to qualitative methods and its role in collecting and analyzing numerical data for a more comprehensive understanding of research topics.
Best Practices to Conduct Quantitative Research
Here are some best practices for conducting quantitative research:

- Differentiate between quantitative and qualitative: Understand the difference between the two methodologies and apply the one that suits your needs best.
- Choose a suitable sample size: Ensure that you have a sample representative of your population and large enough to be statistically weighty.
- Keep your research goals clear and concise: Know your research goals before you begin data collection to ensure you collect the right amount and the right quantity of data.
- Keep the questions simple: Remember that you will be reaching out to a demographically wide audience. Pose simple questions for your respondents to understand easily.
Conclusion
Quantitative research is a structured way of collecting and analyzing data from various sources. Its purpose is to quantify the problem and understand its extent, seeking results that someone can project to a larger population.
Companies that use quantitative rather than qualitative research typically aim to measure magnitudes and seek objectively interpreted statistical results. So if you want to obtain quantitative data that helps you define the structured cause-and-effect relationship between the research problem and the factors, you should opt for this type of research.
At QuestionPro, we have various Best Data Collection Tools and features to conduct investigations of this type. You can create questionnaires and distribute them through our various methods. We also have sample services or various questions to guarantee the success of your study and the quality of the collected data.
Frequently Asked Questions (FAQs)
Quantitative research is a systematic and structured approach to studying phenomena that involves the collection of measurable data and the application of statistical, mathematical, or computational techniques for analysis.
Quantitative research is characterized by structured tools like surveys, substantial sample sizes, closed-ended questions, reliance on prior studies, data presented numerically, and the ability to generalize findings to the broader population.
The two main methods of quantitative research are Primary quantitative research methods, involving data collection directly from sources, and Secondary quantitative research methods, which utilize existing data for analysis.
1.Surveying to measure employee engagement with numerical rating scales.
2.Analyzing sales data to identify trends in product demand and market share.
4.Examining test scores to assess the impact of a new teaching method on student performance.
4.Using website analytics to track user behavior and conversion rates for an online store.
1.Differentiate between quantitative and qualitative approaches.
2.Choose a representative sample size.
3.Define clear research goals before data collection.
4.Use simple and easily understandable survey questions.