
Understanding community engagement has never been about simply tracking activity. Most teams lookat familiar metrics such as total points, average points per member, or top contributors. While these indicators can suggest a community is active, they rarely show how engagement is actually distributed across members.
In reality, engagement is uneven. A small group ofparticipants often drives a significant portion of activity, while a larger segment remains only lightly engaged. When averages or totals are used as the primary lens, this imbalance is hidden, making it difficult to determine whether engagement is sustainable or concentrated in just a few individuals. Without this visibility, you are making decisions on incomplete data.This lack of visibility limits the ability to improve participation with confidence.
This is the gap that Point Distribution is designed to address.
Why engagement distribution matters
For organizations running insight communities, the goal is not just activity, but participation that is broad, consistent, and representative. When engagement is concentrated in a small group, the quality of insights can become biased and the long-term health of the community is at risk. When participation is more evenly distributed, insights become more reliable and the community becomes more resilient over time.
Without a clear understanding of how engagement is distributed, teams end up reacting to surface-level signals instead of managing the underlying structure of participation. This makes it harder to identify gaps, optimize activities, or confidently explain engagement patterns to stakeholders.
Introducing the Point Distribution dashboard
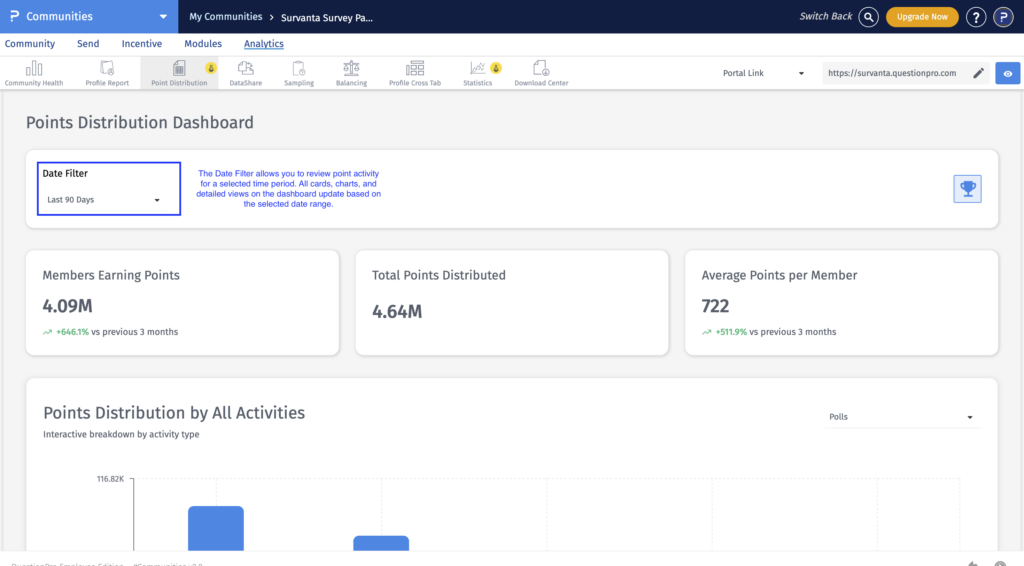
The Point Distribution Dashboard in QuestionPro Communities provides a clear, visual view of participation across members, activities, and time.
Instead of focusing only on how many points have been awarded, the dashboard reveals how those points are distributed and what that distribution actually means. It provides an immediate snapshot of participation, highlighting how many members are actively earning points, how engagement is spread across the community, and how activity evolves over time.
This shift changes the role of reporting. Rather than summarizing what happened, it becomes a way to interpret behavior and identify patterns that were previously hidden behind averages.
See what is driving engagement
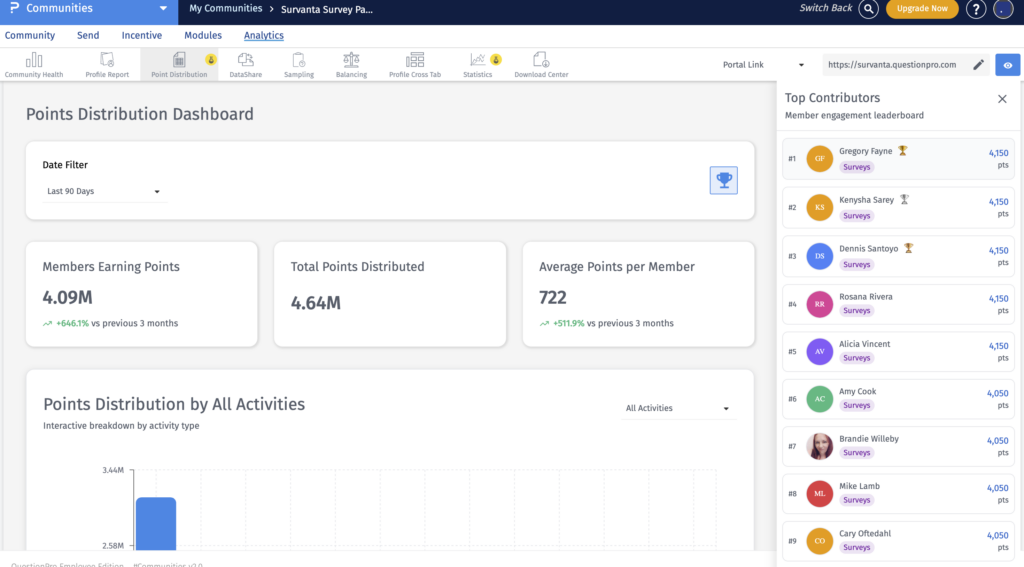
One of the most valuable capabilities within Point Distribution is the ability to analyze engagement by activity. The Points Distribution by Activity view shows how points are earned across surveys, discussions, idea boards, referrals, and other initiatives.
This level of visibility makes it possible to move beyond assumptions and identify what is actually driving participation within the community.
With this view, organizations can:
- Identify which activities consistently generate the highest engagement
- Detect formats that are underperforming and require adjustment
- Prioritize initiatives that contribute both participation and insight quality
- Align future research activities with proven engagement drivers
Instead of relying on intuition, decisions can now be grounded in real participation patterns.
Understand member participation at a deeper level
Point Distribution also introduces a more granular view of how engagement is spread across members. By analyzing member distribution by points, it becomes possible to clearly see how participation is segmented across different levels of activity.
This helps answer critical questions,, such as whether engagement is driven by a small group of highly active contributors or more evenly distributed across the community.
This level of visibility supports a more strategic approach to community management. Highly engaged members can be recognized and leveraged for deeper insight, while under-engaged segments can be targeted with more relevant activities and engagement strategies. Instead of treating the community as a single group, it can be managed as a dynamic ecosystem with distinct participation profiles.
Track engagement trends over time
Engagement is not static, and understanding how it changes is essential to maintaining a healthy and scalable community. The Points Trend Over Time view makes it possible to observe how participation evolves across different timeframes and activities, providing a clear view of momentum within the community.
Patterns such as spikes in activity, gradual declines, or consistent growth become easier to identify over time. This context helps teams connect engagement trends to specific initiatives, campaigns, or changes in strategy, and recognizes early signals of decline =before they impact the overall health of the community.
Rather than relying on isolated snapshots, this view introduces a continuous understanding of engagement dynamics.
From insight to action
The real value of Point Distribution is not just visibility, but the ability to act on what it reveals. Once engagement is understood at a structural level, it can be actively shaped and improved.
With these insights, organizations can:
- Activate under-engaged members through more targeted outreach and tailored activities
- Reinforce high-performing formats that consistently drive participation
- Design incentive strategies that encourage broader and more balanced engagement
- Reduce dependence on a small group of contributors
- Improve the overall quality and representativeness of insights
This is where communities move beyond being a feedback channel and become a system that can be actively managed and optimized.
A stronger foundation for community-driven research
In insight communities, engagement quality directly impacts the quality of insights. When participation is broad and well-distributed, the data collected is more representative and more reliable. When engagement is concentrated, the risk of bias increases and the value of insights decreases.
Point Distribution provides the foundation for managing this balance effectively by giving organizations a clear understanding of how engagement behaves across their community.
This enables a transition from surface-level reporting to a more structured and scalable approach to research. Organizations with continuous access to their audience can validate decisions faster, reduce risk, and improve outcomes across product, marketing, and customer experience initiatives.
See Point Distribution in action
Point Distribution helps teams move beyond static metrics and better understand how their communities actually function..
To see how Point Distribution works within QuestionPro Communities and how it can support your research programs, request a demo and explore how leading organizations are using communities to better understand participation, optimize engagement, and make faster, more confident decisions.