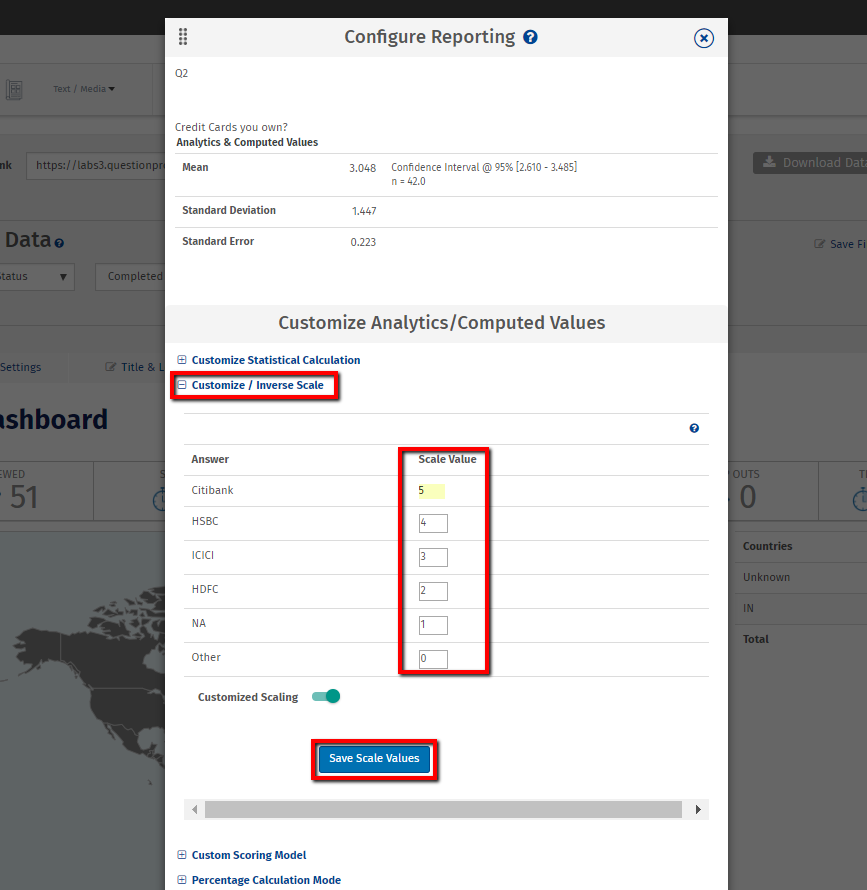
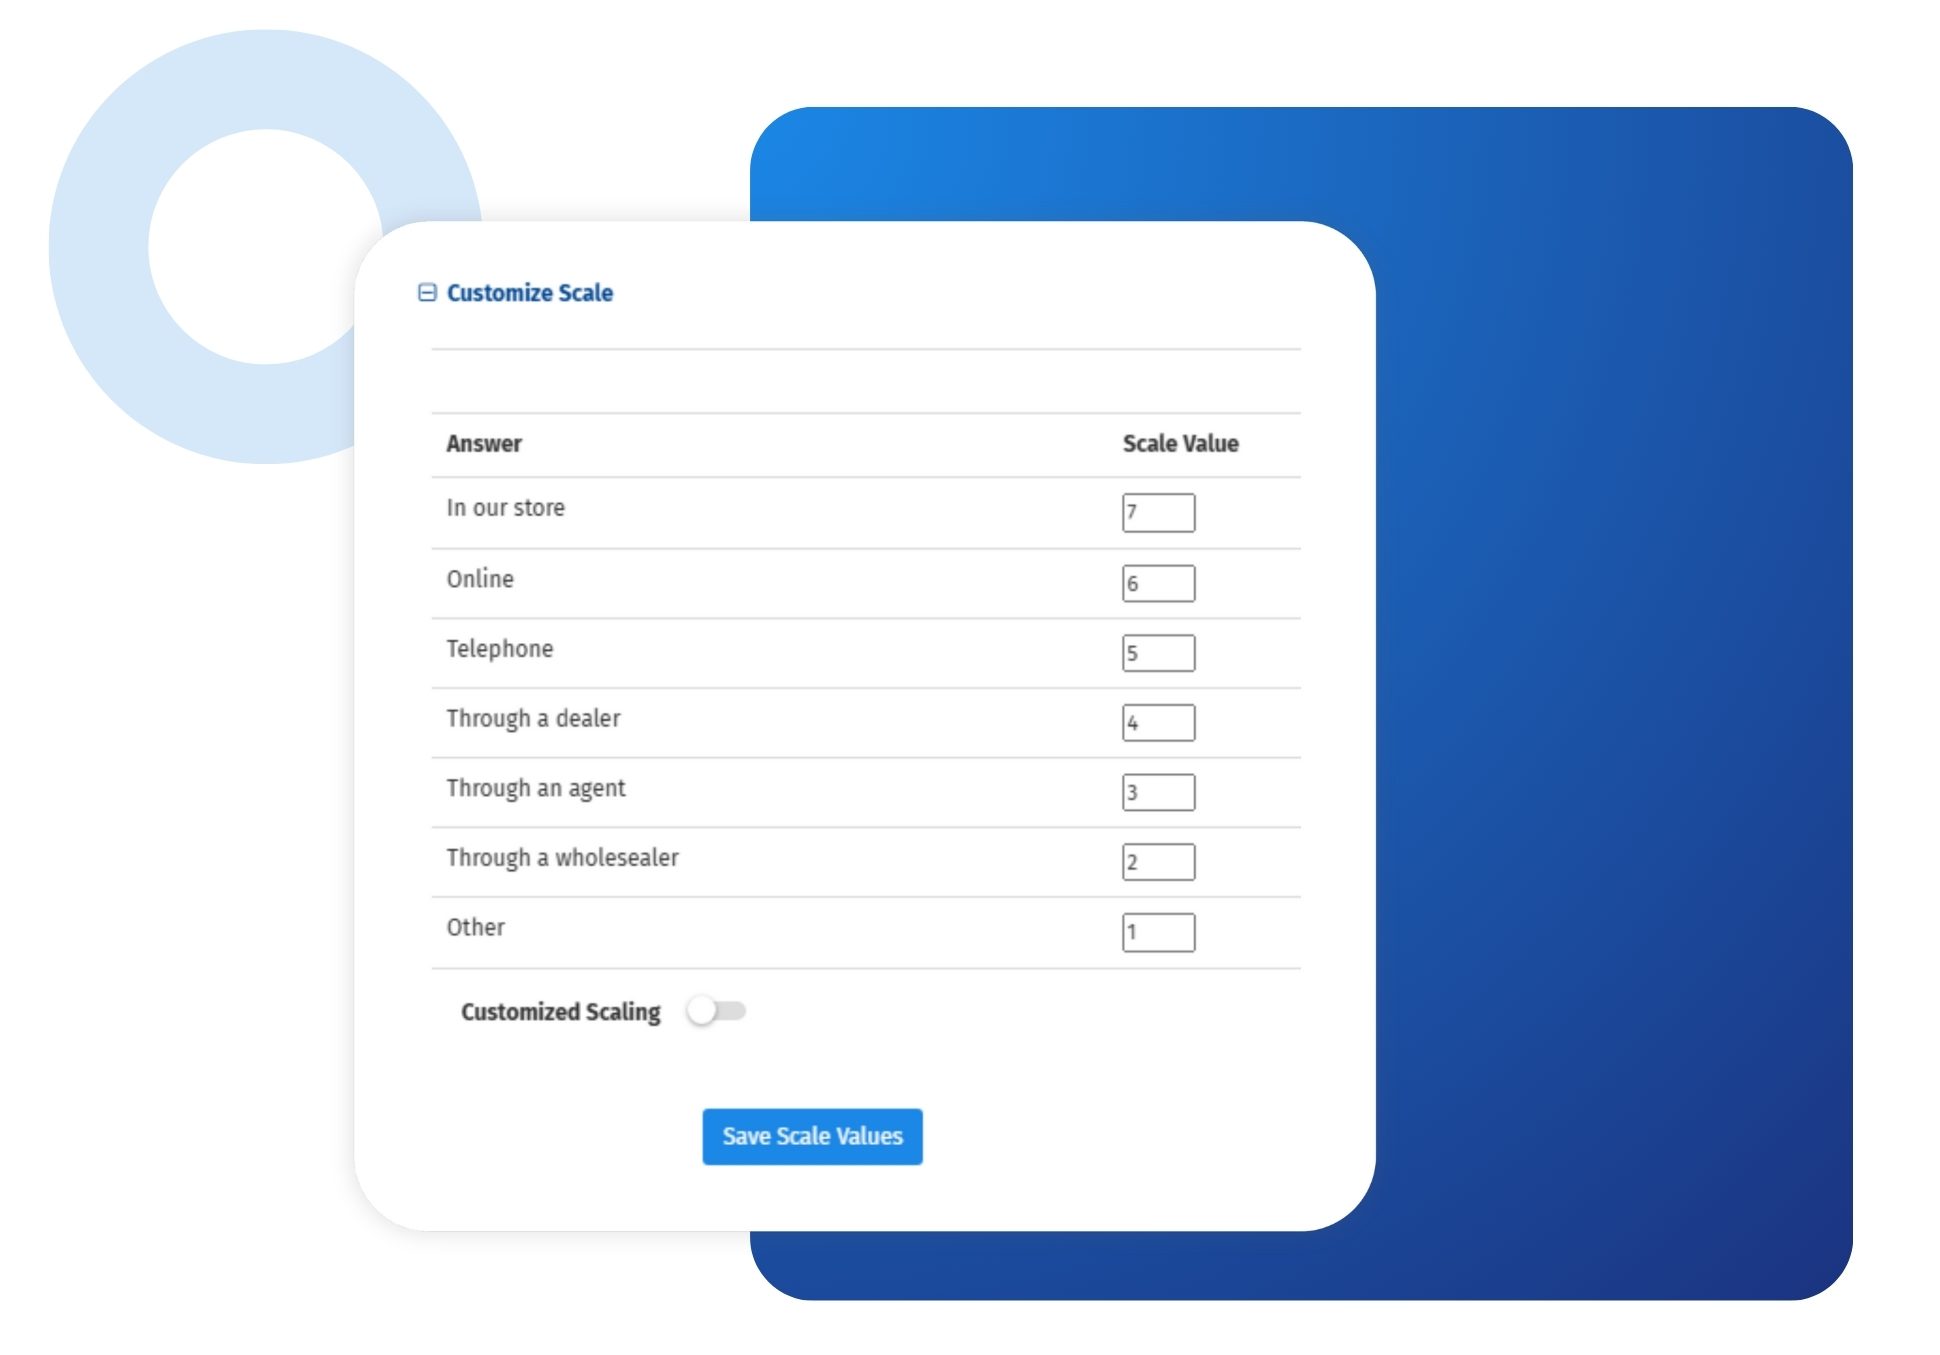
The custom scale library lets you assign numerical values to scale-based responses across multiple surveys quickly and easily. Whether you're working with a unique Likert scale, semantic differential, or other custom scoring model, this feature helps you define the logic behind the labels—so your data stays consistent, accurate, and export-ready.
Researchers and data analysts can standardize response values, enable customized mean calculations, and streamline workflows in tools like Excel, SPSS, or QuestionPro’s built-in analytics dashboard.
Example of using custom scale libraries in your survey
Let’s say your team is running an annual customer satisfaction survey across multiple regions. You’re using a standard 7-point Likert scale, where:
But there’s a catch—your internal reporting framework scores satisfaction on a 0 to 100 scale instead of 1 to 7. That means your team has to convert each response manually, which slows down analysis and increases the risk of inconsistency.
With QuestionPro’s custom scale library, you can automate this process from the start.
Here’s how it works:
You create a custom scale called “Satisfaction Conversion.”
Assign values like:
1 = 0
2 = 16.67
3 = 33.33
4 = 50
5 = 66.67
6 = 83.33
7 = 100
Apply this scale to every satisfaction-related question in your survey
Enable custom scale-based mean calculations for accurate scoring
Export the data with those values already mapped—no spreadsheets, no post-survey cleanup
Now, when your survey results start coming in, the satisfaction scores are instantly aligned with your internal KPIs, ready for dashboard reporting or import into SPSS.
Instead of retrofitting the data after the fact, your surveys are built to output exactly what your team needs—saving hours of manual work and ensuring consistency across teams and studies.
This is a simple but powerful way to make your surveys smarter, faster, and more compatible with your real-world reporting needs.

Use cases for the custom scale library in market research
Some common use cases for the store locator question in market research are as follows:
Custom dashboards and automated reporting: For organizations that use external data dashboards or BI tools, standardized value mapping enables better alignment with third-party systems like Power BI, Tableau, or custom APIs.
Academic research: Universities and research institutions often work with validated scales (e.g., 0–6, 1–7, or even -3 to +3). With the custom scale library, you can replicate published models exactly—ensuring peer-reviewed accuracy in your reporting and statistical methods.
Customer satisfaction scoring: Map qualitative options (e.g., "Very Dissatisfied" to "Very Satisfied") to a 0–10 or 1–5 scale that aligns with your internal CX benchmarks or NPS calibration methods.
Health and psychological assessments: Clinical surveys often use reverse-coded or non-standard scales. With custom scale logic, researchers can align output for compatibility with established diagnostic tools and scoring systems.
Employee engagement scoring: HR teams using frameworks like Gallup Q12 or internal engagement indices can map responses to specific weighted values that feed into custom dashboards or retention models.
Advantages of using a custom scale library in surveys
Some prominent advantages of using custom scale libraries in surveys are as follows:
Define your own scoring system: Assign custom numeric values to answer choices—such as 0 to “Strongly Disagree” and 100 to “Strongly Agree”—to fit your preferred scale, scoring model, or reporting method.
Ensure consistency across teams and surveys: Once created, custom scales can be reused across multiple surveys, helping distributed teams maintain consistency in data collection and analysis.
Simplify data exports and SPSS workflows: Custom scales are reflected in data exports, making it easier to run statistical tests or upload directly to SPSS, R, or Python environments with no extra coding.
Enable accurate mean calculations: QuestionPro utilizes your custom scale definitions to calculate precise averages in real-time—ideal for dashboards and automated reports.
Centralized control at the admin level: Scale libraries can be managed centrally by platform admins, ensuring governance and preventing inconsistent logic across research projects.
How to use the custom scale library in surveys and research?
To use the custom scale library in your research studies, read our help file on how to set up custom scale libraries in QuestionPro.
Survey Software Easy to use and accessible for everyone. Design, send and analyze online surveys.
Research Suite A suite of enterprise-grade research tools for market research professionals.
Customer Experience Experiences change the world. Deliver the best with our CX management software.
Employee Experience Create the best employee experience and act on real-time data from end to end.


