With our margin of error calculator, you’ll know the size of the margin of error needed for your research project, learn how to calculate it, and more.
Most surveys are run for research purposes based on the compiled information for a study sample, not the total population. Because of this, the margin of error is an item to consider when running the sampling. The margin of error calculator measures the maximum amount by which the outcome of our sample might differ from the total population.
Given that most responses from a survey can be presented in terms of percentages, the result of the calculation is too shown as a percentage.
Our margin of error calculator has the objective of showing the researcher how much they can trust in the outcome that was obtained during the survey application phase of their research project.
If you want to know more about sampling, we recommend you visit our article: Types of sampling.
What is the margin of error?
The margin of error is the considered amount of error that might be in a random sampling process for any research project, especially when running questionnaires or surveys.
It's important to be aware of this during any research project since it determines the desired confidence level regarding the outcome of the entire research.
The narrower the margin of error, the broader the degree of certainty on the research outcomes.
What is a confidence interval?
A confidence interval is a range that helps us estimate the true value of something like an average or a percentage that might be based on the data gathered.
For example, with a 95% confidence level, you’re indicating that you are quite certain the true value lies within that range. It serves as a tool to assess the precision of your estimate!
How does this margin of error calculator work?
Two pieces of information are needed to calculate the margin of error for a sample. The margin of error is calculated from:
The sample size (number of individual respondents).
The level of confidence for the outcome (generally established at 95% in the research industry).
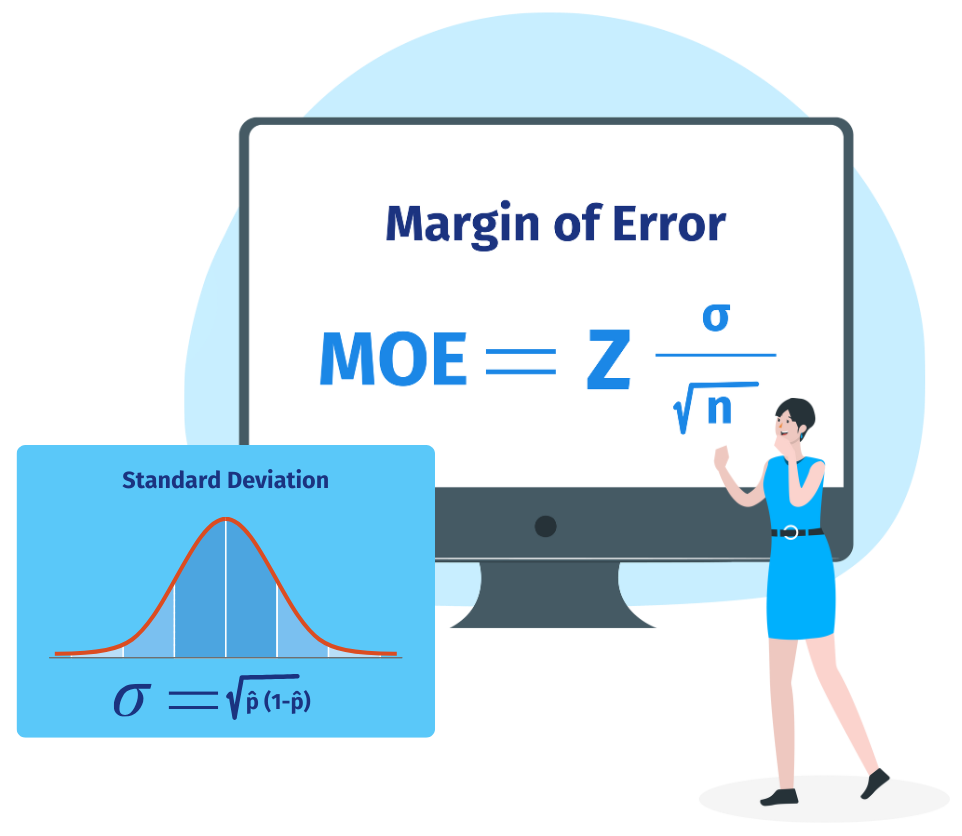
To calculate the margin of error, you need to follow the following margin of error formula:
Where σ (the population standard deviation) is divided by the square root of the n (sample size), and the result is multiplied times z (tabulation based on the determined confidence level value) in the above-mentioned margin of error formula.
Z value
Confidence Level (in percentage)
1.28
80%
1.44
85%
1.65
90%
1.96
95%
2.58
99%
How to use our margin of error calculator?
Get an accurate margin of error for your research project in minutes. Follow these simple steps:
Enter your total population:Enter the total number of people in your target audience into the calculator. This will ensure the calculation is for your research scope.
Choose your confidence level:Select the level of confidence you need for your results. 95% is the most common confidence level used by researchers. Higher confidence levels (e.g., 99%) will increase the margin of error.margin of error.
Enter your sample size:Enter the number of people in your survey sample. If you’re not sure what this number should be, our Sample Size Calculator can help you determine the right sample size for your population.
Enter and get your margin of error:Once all fields are filled in, the calculator will give you your margin of error instantly.
Margin of Error Calculator
Total Population
Confidence Level
Sample Size:
Margin of error:
Applications of the margin of error calculator
For example, say you have a new milkshake business, and you're training new employees to fill the cups with the right amount of ice cream, 10oz each.
Therefore, you want to calculate the average weight of the cones produced during a workday, including the margin error. Instead of weighing each cup, you ask every employee to weigh and register a sample of the served cups randomly and take notes.
For 50 sampled cups, you found an average of 10.3oz. Say the standard deviation for that population is 0.6oz. So, how would you calculate the margin of error with a confidence level of 95%?
Based on the 50-cup sample, the average weight is 10.3oz with a margin error of approximately 0.17oz. In other words, the possible interval for the average weight of all the big seized cones produced for a workday is estimated (with a confidence level of 95%) between 10.30 - 0.17 = 10.13oz and 10.3 + 0.17 = 10.47oz.
Other Applications for Your Margin of Error
Beyond quality control or simple math, the margin of error is a powerful tool across many fields. It gives you accuracy and reliability in data interpretation so you can make informed decisions in market research, academic studies, and business strategies. Here’s how it applies:
Market Research: Measure customer feedback with precision
In market research, the margin of error helps you know how accurately the survey results represent your target audience.
For example, if a survey says 65% of customers like a new product, the margin of error will tell you how close that is to the actual percentage. Data is used to make decisions like product launches or marketing strategies.
Academic Research: get cccurate sampling for research papers
In academic research, the margin of error is key to validating the results. Whether studying human behavior or testing scientific theories, researchers use the margin of error to express confidence in the data.
For example, in a study on student performance, the margin of error will tell you how close the sample results are to the overall population, making the conclusions more believable.
Business Decisions: Validate before you act
Businesses use survey data or analytics to inform big decisions like entering new markets or changing pricing strategies. The margin of error helps you know how representative is the data of the larger market or customer base.
For example, if the survey results say 75% customer satisfaction with a ±3% margin of error, you can confidently plan the improvements knowing the true satisfaction rate is within a certain range.
Each of these scenarios shows how understanding and calculating the margin of error leads to better data-driven decisions across industries.
How to choose the right sample size?
It is essential to select an adequate survey sample size to get credible results from a survey and use them to inform critical business decisions. You will not get reliable results if you choose a sample that is too small. The margin of error is reduced as the sample size increases.
Here are some essential factors to consider when determining sample size:
1. Define the population
The first step in determining sample size is estimating the population being researched. Here, the population is the entire or the larger group you want to research, and the sample size is the number of people you need to question to achieve a representative sample.
2. Calculate the margin of error
There is no way to be 100 percent accurate with surveys. The margin for error is also referred to as the confidence interval. The confidence interval tells you how far your survey data can be from what the population means. A margin of error tells you how close to the actual population value you can expect a survey result to be.
3. Determine the confidence level
The confidence level indicates how well the sample accurately reflects its entirety. The greater the size of the sample, the greater the confidence in the results. The smaller your sample size, the less confident you can be in your results.
4. Population standard deviation
Standard deviation measures the amount of variation among individual data points in a population. It measures how much a normal distribution can vary from one point to another.
A low population standard deviation suggests the values are grouped around the mean number. In contrast, a high population standard deviation means they are scattered across a range with some tiny and big outliers.
Suggestions to ensure more confidence in the collected data of your survey
If you are about to run a research project and you want to collect the appropriate number of samples, we have a few suggestions for you:
Identify the sample for your total population. Only in this way will you be able to know whether your margin of error is the right one.
Only in this way will you be able to know whether your margin of error is the right one. To do so, you need to measure both the margin of error and the confidence level of your sample, and it depends on how much your outcomes will differ from your responses
Establish the sample size. How many people would you need to survey for your research project? Remember to consider only the survey respondents who completed the survey as part of your sample.
Define the response rate. This regards the result obtained by dividing the percentage of participants who responded to the survey by the people who received it.
Now that you’ve followed these steps, you know exactly how many people should receive your survey, which will help you obtain the desired outcome.
Benefits of Calculate the margin of error
Calculating the margin of error will help you determine the possibility that the survey result will be close to the result if the entire population is surveyed. As a result, its worth influences how accurate your survey is. The following are some of the benefits of using a Margin of Error Calculator:
Accurate estimates: The margin of Error Calculator accurately estimates sample size for a specified margin of error. This ensures a sufficient sample size and accurate survey results.
Confidence level: It lets you choose a confidence level and calculates the margin. This clarifies survey confusion.
Quick calculations: It reduces time-consuming and error-prone manual calculations. The calculator instantly calculates difficult calculations.
Decision-making: It is useful for making decisions such as determining the feasibility of conducting a survey or assessing the reliability of survey results.
Final Words
The margin of error calculator is a way of measuring how effective your survey is. The narrower the margin of error, the more confidence you can have in the results; the broader the margin of error, the further the opinions from the total population.
We hope this tool will be quite useful for your research (or other projects). Remember that with QuestionPro, you'll be able to use these values to obtain real value thanks to our Survey Software.
You can start right now by using QuestionPro for free or connect with one of our executives to clear any doubts you may have about our platform.
You know the number of surveys you must run for your study to have a valid range. Do you need an automatic tool to collect and analyze data? In QuestionPro, we can help you. What are you waiting for?
 Survey Software
Easy to use and accessible for everyone. Design, send and analyze online surveys.
Survey Software
Easy to use and accessible for everyone. Design, send and analyze online surveys.
 Research Suite
A suite of enterprise-grade research tools for market research professionals.
Research Suite
A suite of enterprise-grade research tools for market research professionals.
 Customer Experience
Experiences change the world. Deliver the best with our CX management software.
Customer Experience
Experiences change the world. Deliver the best with our CX management software.
 Employee Experience
Create the best employee experience and act on real-time data from end to end.
Employee Experience
Create the best employee experience and act on real-time data from end to end.