
The Likert Scale is a widely used survey tool designed to measure attitudes, opinions, and perceptions by gauging the extent of agreement or disagreement with a particular statement.
An essential aspect of market research for researchers is the ability to gauge the respondents’ opinion towards a brand, feature, product, service, and more. Measuring opinions helps to measure the level of changes required.
Using a quantitative analysis data collection tool in the research process, like a Likert Scale, allows research teams to understand respondent sentiments. Quantifying a like or dislike aids in making timely changes and supplies a critical tool in the insights collection and management process of brand and research teams.
What is a Likert Scale?
A Likert Scale is a unidimensional scale that researchers use to collect respondents’ attitudes and opinions. Researchers often use this psychometric scale to understand the views and perspectives towards a brand, product, or target market.
There are different variations, and each one are focused directly on measuring people’s opinions, such as the Guttman scale, Bogardus scale, and Thurstone scale.
Psychologist Rensis Likert established a distinction between a scale that materializes from a collection of responses to a group of items (maybe 8 or more). Responses are measured in a range of values.
Given its importance for budding research professionals, we have created a guide to help you understand the critical aspects of this tool and best practices for mastering it to conduct better research. We hope you find it helpful!
Types of Likert Scales
The Likert Scale has become a favorite among researchers to collect opinions about customer satisfaction or employee experience. You can divide this scale primarily into two major types:
- Even Likert Scale
- Odd Likert Scale
1. Even Likert Scale
Researchers use even Likert Scale to collect extreme feedback without providing a neutral option.
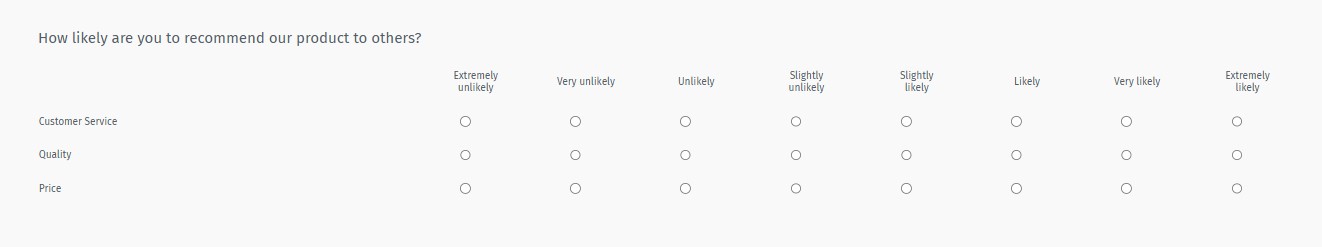
- 4-Point Likert Scale for importance: This type of Likert Scale allows researchers to include four extreme options without a neutral choice. Here the various degrees of importance are represented in a 4-Point Likert Scale.
- 8-Point Likelihood of recommendation: This is a variation of the previously explained 4-point Likert Scale, the only difference being, this scale has eight options to collect feedback about the likelihood of a recommendation.
2. Odd Likert Scale
Researchers use the odd Likert Scale to give the respondents the choice of responding neutrally.
- 5-point Likert Scale: With five answer options, researchers use this odd Likert Scale question to gather information about a topic by including a neutral answer option for respondents to select if they don’t wish to answer from the extreme choices in their research design.

- 7-point Likert Scale: The 7-point Likert Scale adds two more answer options at extreme ends of a 5-point Likert Scale question.
- 9-point Likert Scale: A 9-point Likert Scale is quite uncommon, but you can use it by adding two more answer options to the 7-point Likert Scale question.
Likert scale questions
Likert Scale questions are fundamental for surveys and research, allowing respondents to express their attitudes, opinions, or behaviors across various options. Here’s how each type of Likert Scale question works, along with practical examples:
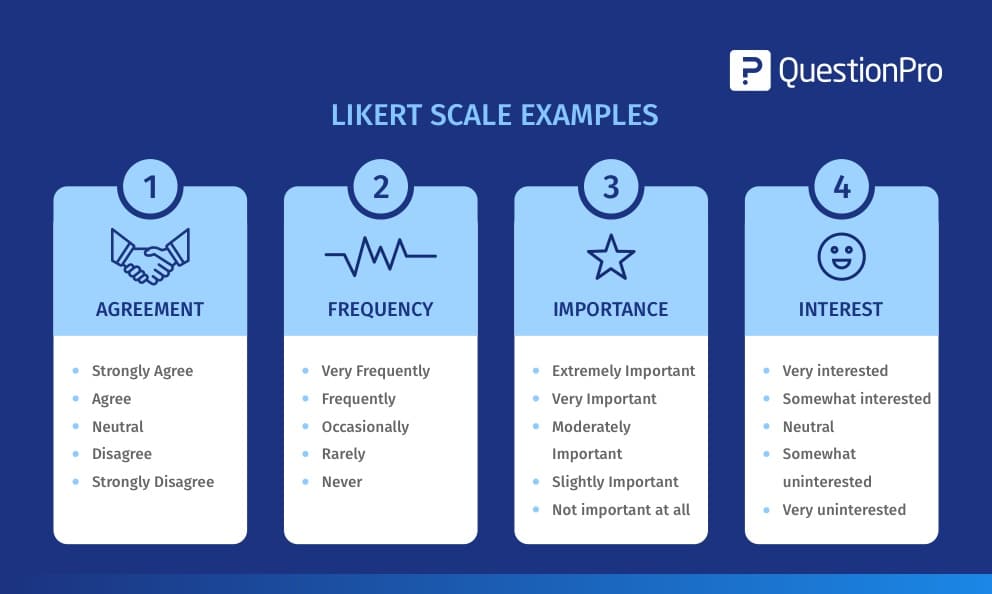
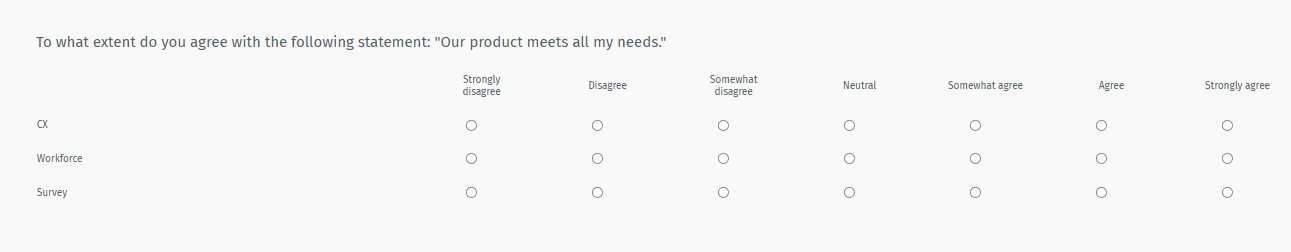
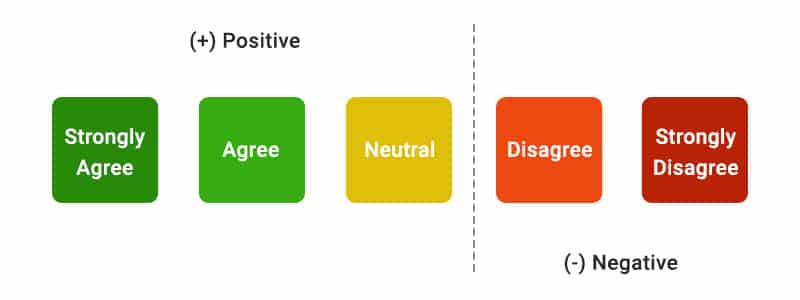
1. Agreement
Agreement-based Likert Scale questions assess the capacity to which respondents agree or disagree with a statement, permitting researchers to capture their attitudes and opinions on particular topics.
Example Question:
“The training program met my expectations.”
Response Scale:
- Strongly Agree
- Agree
- Neutral
- Disagree
- Strongly Disagree
This type of question is ideal for gauging satisfaction, perception, or approval of services, policies, or experiences.
2. Frequency
Frequency-based questions assess how often a respondent performs or experiences a particular action or behavior. This type of question helps identify patterns in usage or behavior over time.
Example Question:
“How often do you use our mobile app?”
Response Scale:
- Very Frequency
- Frequency
- Occasionally
- Rarely
- Never
Use this question type to monitor frequency patterns and habits among respondents, especially for product or service usage.
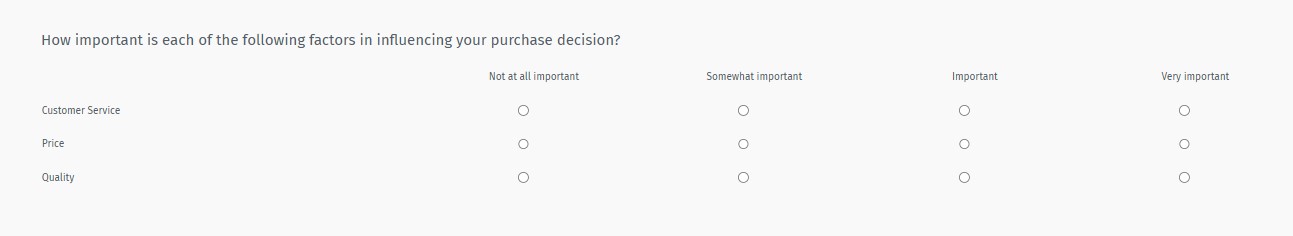
3. Importance
Importance-based Likert questions evaluate the significance or priority respondents place on certain elements, features, or aspects. They help researchers understand what matters most to their audience.
Example Question:
“How important is access to 24/7 customer support?”
Response Scale:
- Extremely Important
- Very Important
- Moderately Important
- Slightly Important
- Not Important at all
Such questions are essential for prioritizing features, services, or policies according to user needs and preferences.
4. Interest
Interest-based questions measure respondents’ enthusiasm or engagement toward a topic or activity. They’re useful for identifying preferences and gauging how likely respondents are to pursue or engage in future offerings.
Example Question:
“How interested are you in attending future workshops?”
Response Scale:
- Very Interested
- Somewhat Interested
- Neutral
- Somewhat Uninterested
- Very Uninterested
This type of question is valuable for gauging potential interest in new programs, events, or products.
By crafting questions that suit each purpose, researchers can gain insightful, actionable data on attitudes, behaviors, and priorities, guiding better decision-making and improved experiences.
Characteristics of Likert Scale
The Likert Scale came into existence in 1932 in the form of the 5-point scale, which is used extensively. These scales range from a group of general topics to the most specific ones that ask respondents to indicate their level of agreement, approval or, belief. Some significant characteristics of the Likert Scale, are:
01. Related answers
Items should be easily related to the sentence’s answers, regardless of whether the relationship between item and sentence is evident.
02. Scale type
The items must always have two extreme positions and an intermediate answer option that serves as graduation between the extremes.
03. Number of answer options
It is essential to mention that although the most common Likert Scale is that of 5 items, the use of more items helps to generate greater precision in the results.
04. Increasing reliability of the scale
Researchers often increase the ends of the scale to create a seven-point scale by adding “very” to the top and bottom of the five-point scales. The seven-point scale reaches the upper limits of the reliability of the scale.
05. Using wide scales
As a general rule, Likert and others recommend that it be better to use a scale as wide as possible. One can always collapse the answers into concise groups, if appropriate, for analysis.
06. Lack of a neutral option
By considering these details, scales are sometimes curtailed to an even number of categories (usually four) to eliminate the “neutral” possibility on a “forced choice” survey scale.
07. Intrinsic variable
The primary Likert record clearly states that there could be an inherent variable whose value marks the feedback or attitudes of the respondents, and this underlying variable is the interval level, at best.
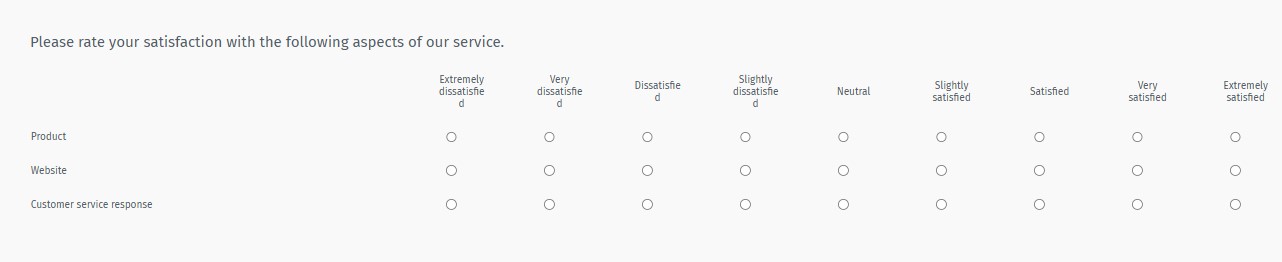
Example of a Likert Scale
To better understand this concept, we have created this example where we suppose that a researcher uses a Likert Scale question as a dichotomous option question to collect product feedback. He/ she frames the question as “The product was a good purchase,” with the options listed as agree or disagree. The other way to frame this Likert Scale questionnaire is, “Please state your satisfaction level with the products,” and the options range from very dissatisfied to very satisfied.
When responding to an item on the likert Scale, the user responds based explicitly on their agreement or disagreement level. These scales allow for determining the level of agreement or disagreement of the respondents.
The Likert Scale assumes that the strength and intensity of the experience are linear. Therefore it goes from a complete agreement to a complete disagreement, assuming that attitudes can be measured.
Do you need more examples? Check out these Likert Scale examples.
Likert Scale Data and Analysis
Researchers use surveys regularly to measure and analyze the quality of products or services. The Likert Scale is a standard classification format for studies. The respondents provide their opinion (data) about the quality of a product/service from high to low or better to worse using two, four, five, or seven levels.
Researchers and auditors generally group collected data into a hierarchy of four fundamental measurement levels – nominal, ordinal, interval, and ratio measurement levels for further analysis:
- Nominal data: Data in which the answers classified into variables need not necessarily have quantitative data or order is called nominal data.
- Ordinal data: Data in which it is possible to sort or classify the answers, but it is impossible to measure the distance is called ordinal data.
- Interval data: Aggregate data in which measurements of orders and distances can be made is called interval data.
- Ratio data: Ratio data is similar to interval data. The only difference is an equal and definitive ratio between each analyzing data and absolute “zero” being treated as a point of origin.
Data analysis using nominal, interval, and ratio data are generally transparent and straightforward. Ordinal data analyzes data, particularly in regards to Likert or other scales in the surveys. This is not a new research problem. The effectiveness of handling ordinal data as interval data continues to be debatable in survey analysis of various applied fields. Some of the significant scale points to keep in mind are:
1. Statistical tests
Researchers sometimes treat ordinal data as interval data because they claim that parametric statistical tests are more powerful than nonparametric alternatives. Moreover, inferences from parametric tests are easy to interpret and provide more information than non-parametric options.
2. Concentration on Likert Scales
However, the treatment of ordinal data as interval data without examining the values of the data set and the analysis’s objectives can mislead and misrepresent the results of a survey. To analyze scalar data more appropriately, researchers prefer to consider ordinal data as interval data and concentrate on Likert Scales.
3. Median or range for inspecting data
A universal guideline suggests that the mean and the standard deviation are baseless parameters for detailed statistics when the data are on ordinal scales, just like any parametric analysis based on normal distribution. The non-parametric test is done based on the appropriate median or range for inspecting data.
Best Practices for Analyzing the Results
Because the Likert element data is discrete, ordinal, and limited in scope, there has been a long dispute over the most logical way to analyze Likert data. The first option is between parametric and non-parametric tests. The advantages and disadvantages of each type of analysis are generally described as the following:
- Parametric tests assume a regular and uninterrupted division.
- Non-parametric tests do not assume a regular or uninterrupted division. However, there are concerns about a lesser ability to detect a difference when one exists.
Which is the best option? When deciding to analyze information received from a survey that uses Likert Scale questions, a researcher has to make a real decision.
- Over the years, a series of studies that have tried to answer this Likert Scale questionnaire. However, they have been inclined to look at a limited number of potential distributions for Likert data, which causes the generalization of the results to suffer. Thanks to increases in computing power, simulation studies can now thoroughly evaluate a wide range of distributions.
- The researchers identified a diverse set of 14 distributions that are representative of the actual Likert data. The computer program extracted self-sufficient pairs of samples to test all possible combinations of the 14 distributions.
- In total, 10,000 random samples were generated for each of the 98 distribution combinations. The samples pairs are analyzed using both the two-sample t-test and the Mann-Whitney test to compare the efficacy of each test. The study also evaluated different sample sizes.
- The results show that the Type I error rates (false positive) for all pairs of distributions are very close to the target quantities. If an organization uses any of the analysis and results are statistically significant, it does not need to be too worried about a false positive.
- The results also show that for most pairs of distributions, the difference between the power of the two tests is trivial. If there is a difference at the population level, any of the analysis is equally likely to detect it.
- There are some pairs of specific distributions where there is a power difference between the two tests.If an organization runs both tests on the same data and gets different results, one test shows significance while the other does not. This difference in power usually happens in only a small number of cases.
- In general, the choice between the two analyzes is a loop. If an organization needs to compare two groups of five-point Likert data, the analysis method usually does not matter.
- Both parametric and non-parametric tests equally guard against false negatives and false positives. These patterns are valid for sample sizes of 10, 30, and 200 per group.
Advantages of Likert scale
There are many advantages of using this rating Scale in a survey for market research. They are:
- Ease of implementation: This universally accepted scale can be easily understood and applied to various customer satisfaction or employee satisfaction surveys.
- Quantifiable answer options: Quantify Likert items with no apparent relation to the expression and conduct statistical analysis on the received results.
- Analyze the rank of opinions: There may be a sample with varied views about a particular topic. The Likert Scale offers a ranking of the views of these people surveyed.
- Simple to respond: Respondents can understand the intent of this scale and quickly answer the question.
Disadvantages of Likert Scale
The Likert Scale is typically used to measure attitudes and opinions, but they have several disadvantages:
- Limited Depth: Due to the fixed nature of the options, responses may only capture part of the complexity of attitudes or feelings.
- Central Tendency Bias: Respondents might choose neutral or middle options to avoid extreme opinions.
- Subjectivity in Interpretation: Individuals may interpret the scale points (e.g., “Agree” vs. “Strongly Agree”) differently.
- Lack of Precision: The interval between scale points is only sometimes equal, making statistical analysis less reliable.
Want to Use the Likert Scale in a Survey? Do it with QuestionPro!

The Likert-scale survey is a comprehensive technique for gauging feedback and information, making it significantly easy to understand and respond. This is a critical question to measure the opinion or attitude towards a specific topic. So that it will be of great help in the next step of an investigation.
With QuestionPro, an organization can conduct an online survey using the Likert Scales. Start by creating a free account and start testing this type of question.
For more information or questions, please consult our online chat and tell us about your project. We’ll recommend the best research tool to suit your needs.
Conclusion
The Likert Scale helps measure attitudes, opinions, and perceptions in many areas, from research to business. Its simple design makes it a popular choice for collecting data, while its structure allows for precise and accurate analysis.
When used well, the Likert Scale improves data collection and helps make decisions by understanding group opinions better. When used effectively, the Likert Scale enhances data collection and facilitates informed decision-making based on a better understanding of collective sentiment.