• Skip to main content
  • Skip to primary sidebar
  • Skip to footer
QuestionPro

QuestionPro

questionpro logo
  • Products
    survey software iconSurvey softwareOur flagship survey solution. Sophisticated tools to get the answers you need.research edition iconResearch SuiteTuned for researchers. Get more insights. Response based pricing.CX iconCXExperiences change the world. Deliver the best with our CX management software.WF iconWorkforceEmpower your work leaders, make informed decisions and drive employee engagement.
  • Solutions
    IndustriesGamingAutomotiveSports and eventsEducationGovernment
    Travel & HospitalityFinancial ServicesHealthcareCannabisTechnology
    Use CaseNPS+CommunitiesAudienceContactless surveysMobile
    LivePollsMember ExperienceGDPRPositive People Science360 Feedback Surveys
  • Resources
    BlogeBooksSurvey TemplatesCase StudiesTrainingHelp center
  • Features
  • Pricing
Language
  • English
  • Español (Spanish)
  • Português (Portuguese (Brazil))
  • Nederlands (Dutch)
  • العربية (Arabic)
  • Français (French)
  • Italiano (Italian)
  • 日本語 (Japanese)
  • Türkçe (Turkish)
  • Svenska (Swedish)
Call Us
+1 800 531 0228 +1 (647) 956-1242 +52 999 402 4079 +49 301 663 5782 +44 20 3650 3166 +81-3-6869-1954 +61 2 8074 5080 +971 529 852 540
Log In Log In
SIGN UP FREE

Home

Thurstone Scale: Definition, Survey Questions with Examples

Thurstone Scale

Thurstone Scale

Thurstone Scale: Definition

Thurstone scale is defined as a unidimensional scale that is used to track respondent’s behavior, attitude or feeling towards a subject. This scale consists of statements about a particular issue or topic where each statement has a numerical value that indicates the respondents attitude towards the topic as favorable or unfavorable. Respondents indicate the statements that they agree with, and an average is computed. A mean score of the agreements or disagreements is calculated as the attitude of the respondent towards the topic.

This scale was developed by Robert Thurstone to approximate measurement in equal-appearing interval levels. The Thurstone scale is built upon the fundamentals of the Likert scale, but this method of constructing an attitude scale not only takes value of each item of into consideration while evaluating the final attitude score but also caters to neutral items. The Guttman scale and the Bogardus social distance scale are also variations of unidimensional scales where elements can be ordered in a hierarchical manner.

There are three scales while talking about the Thurstone scale question but the most commonly used method is the equal appearing intervals and hence the scale is also called the equal-appearing interval scale. The two other are slightly more complex to develop but still result in the same agree/disagree quiz question type; they are the method of successive intervals and the method of paired comparisons.

How to conduct a Thurstone Scale Survey with an Example

An example of a Thurstone scale survey is to understand the attitude of employees in an organization towards diversity hiring in that organization. There are 2 distinct milestones in the Thurstone scale question; to derive the final questions and administer the Thurstone scale question and conduct its analysis.

Derive the Final Question

There are 5 distinctive steps to derive the final question. They are:

  1. Step 1 – Develop statements: Develop a large number of agree/disagree statements on a certain topic. For example, if you wanted to find out people’s attitudes towards the policy of diversity hiring in an organization, your statements may include:
    • Policy on diversity hiring is wrong.
    • Diversity hiring takes away jobs from deserving candidates.
    • Diversity hiring brings different viewpoints to the team.
    • Diversity hiring brings out the best in the local community.
    • Diversity hiring aids in increasing the reputation of a brand.
  2. Step 2 – Rank each statement with a panel of judges: The next step would be to have a panel of judges rate each item on a scale of 1 to 11 where 1 is the least favorable attitude towards the common vector – diversity hiring and 11 is an extremely favorable attitude. It is important to note that the judges are required to rate each option and not agree or disagree with them.
  3. Step 3 – Calculate median and/or mean and Interquartile range (IQR): The data collected from all judges is to then be analyzed to draw up a table with the mean or median values in the ascending order. Using median or mean is a personal choice and the options throw up accurate results in the use of either. If you have 50 statements, you need to have 50 means/medians and 50 IQR’s.
  4. Step 4 – Sorting the table: The data has to be sorted on the basis of smallest to largest median/mean and the IQR’s for each median/mean have to be in a descending order. This can be represented as:
    Statement Median or Mean IQR
    43 1 1.25
    21 1 1
    16 1.5 1
    3 3 2
    6 5 2
    28 6 1
    37 7 3
    9 7.5 1.5
    18 9 2
    26 11 2
  5. Step 5 – Selecting final variables or options: Select options on the basis of the above table. For example, you could select one item from each mean/median value. You want the statements with the most agreement between judges. For each median value, this is the item with the lowest interquartile range. This is a “Rule of Thumb”: you don’t have to choose this item. If you decide it’s poorly worded or ambiguous, choose the item above it (with the next lowest IQR).

Administering and Analysis of the Thurstone Scale Question

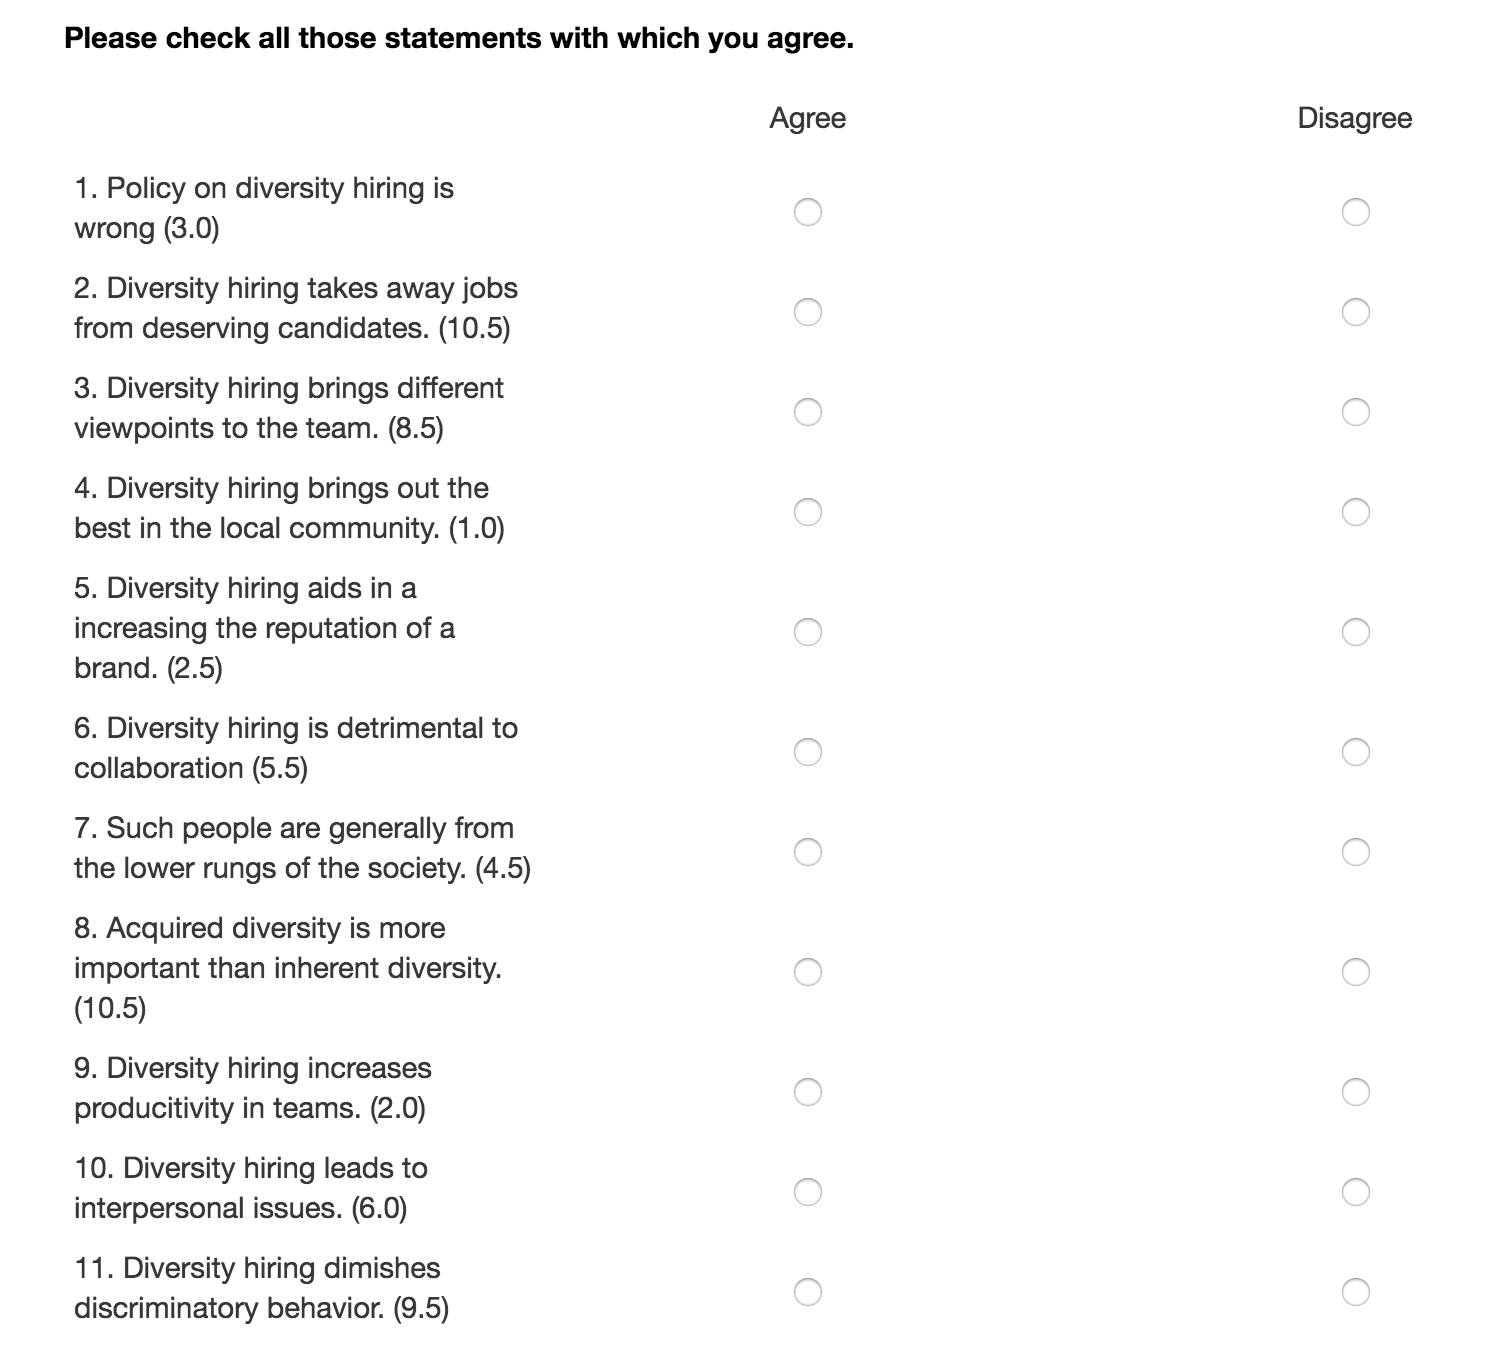
Once the final questions have been decided upon, they are shared with the respondents to select from agreement or disagreement. The ratings are shown in parenthesis but the rating is not shared with the actual respondents.

  • Administering and analysis by median or mean: The question and the subsequent options can be administered to the respondents by using either the mean or the median score in the below format. The weights of the statements are summed and divided by the number of statements checked. If a respondent were to agree with statements 2, 5, 7 and 10; the attitude score is 10.5 + 2.5 + 4.5 + 6.0 = 23.5/4 = 5.8. Dividing the number of statements puts this score at a little above the midway point of the 1-11 scale. This score indicates that the attitude is slightly favorable to diversity hiring in the organization.

Thurstone Scale Question

  • Administering and analysis by simple count or percentage: In the same example above, if the question is administered without the mean or median score, the calculation can be depicted by a simple count of agreement on the 1-11 scale or a percentage. If the respondent were to agree with statements 1, 4, 5, 6, 8, 9 and 11; the agreement count is 7 out of 11 which puts the percentage at 63.63% which means that the attitude is favorable towards diversity hiring.

Characteristics of a Thurstone Scale Question

Some distinct characteristics of a Thurstone scale question are:

  • They are two stepped: A Thurstone scale question is never administered at the first iteration stage without the rating by judges. This is an important characteristic of this question as the options that a respondent sees are weighted and there is consensus of them being in the survey.
  • Mean or median is always calculated: Since each option is weighted, the mean or median is calculated for each option. This also forms the basis of the selection method for use in the final survey.
  • Only agree or disagree options: The respondent makes a selection only on the basis of the agreement or disagreement with the statement.

Use of a Thurstone Scale Survey

The Thurstone scale survey is used to measure the respondents attitudes on a particular subject. The scale can be applied to a wide range of market research surveys, in market research including:

  • Surveys that measure opinions: The Thurstone scale question produces quantifiable data about the measures of strength of the respondents opinions.
  • Those that gauge attitudes or feelings: This scale is used effectively in customer satisfaction to predict future purchasing trends and in employee engagement to calculate turnover.
SHARE THIS ARTICLE:

About the author
Adi Bhat
View all posts by Adi Bhat

Primary Sidebar

Gain insights with 80+ features for free

Create, Send and Analyze Your Online Survey in under 5 mins!

Create a Free Account

RELATED ARTICLES

HubSpot - QuestionPro Integration

How to delete a Google review: Tips & Examples

Mar 29,2022

HubSpot - QuestionPro Integration

Top 12 Formstack Alternatives & Competitors in 2023

Jan 31,2023

HubSpot - QuestionPro Integration

Release Notes September 2022

Sep 30,2022

BROWSE BY CATEGORY

  • Academic
  • Academic Research
  • Academic Research
  • Artificial Intelligence
  • Assessments
  • Audience
  • Brand Awareness
  • Brand Awareness
  • Branding
  • Business
  • Business
  • Case Studies
  • Communities
  • Consumer Insights
  • Consumer Insights
  • Customer effort score
  • Customer Engagement
  • Customer Experience
  • Customer Experience IN
  • Customer Loyalty
  • Customer Loyalty
  • Customer Research
  • Customer Satisfaction
  • Customer Satisfaction
  • CX
  • Decision Making
  • Employee Benefits
  • Employee Engagement
  • Employee Engagement
  • Employee Engagement
  • Employee Retention
  • Employee Retention
  • Employee Retention
  • Employee Retention
  • Enterprise
  • Events
  • Forms
  • Friday Five
  • General Data Protection Regulation
  • Guest Post
  • Insights Hub
  • Intercept
  • klantervaring
  • [email protected]
  • LivePolls
  • Market Research
  • Market Research
  • Marketing
  • Marketing
  • Marktonderzoek
  • medewerkersonderzoek
  • Mercadotecnia
  • Mobile
  • Mobile
  • Mobile App
  • Mobile diaries
  • Mobile Surveys
  • New Features
  • non-profit
  • NPS
  • Online Communities
  • Polls
  • Question Types
  • Questionnaire
  • QuestionPro
  • QuestionPro Products
  • QuestionPro Products
  • Release Notes
  • Research
  • Research Tools and Apps
  • Revenue at Risk
  • Startups
  • Survey Templates
  • Surveys
  • Surveys
  • Tech News
  • Tech News
  • Tips
  • Training
  • Training Tips
  • Trending
  • Uncategorized
  • Video Learning Series
  • VOC
  • Webinar
  • Webinars
  • What’s Coming Up
  • Workforce
  • Workforce
  • Workforce
  • Workforce Intelligence
  • Workforce Intelligence
  • Workforce Intelligence

Footer

MORE LIKE THIS

Audience engagement tools can be utilized in meetings, conferences, events, training sessions, and educational settings. Learn more.

Audience Engagement Tools: What it is, why to use + Top 5 tools

Feb 4, 2023

Organizational assessment examines procedures, environment, and structure. It helps businesses identify areas of opportunity. Learn more.

Organizational Assessment: What It Is, Benefits + How to Conduct

Feb 3, 2023

Text mining is essential for analyzing + processing unstructured data. It allows to track how and when its products and brand are mentioned.

Text Mining: What is It, Methods + How is It Used in Business

Feb 2, 2023

Bullying: Types, Example Survey Questions and More

Feb 1, 2023

Other categories

  • Academic
  • Academic Research
  • Academic Research
  • Artificial Intelligence
  • Assessments
  • Audience
  • Brand Awareness
  • Brand Awareness
  • Branding
  • Business
  • Business
  • Case Studies
  • Communities
  • Consumer Insights
  • Consumer Insights
  • Customer effort score
  • Customer Engagement
  • Customer Experience
  • Customer Experience IN
  • Customer Loyalty
  • Customer Loyalty
  • Customer Research
  • Customer Satisfaction
  • Customer Satisfaction
  • CX
  • Decision Making
  • Employee Benefits
  • Employee Engagement
  • Employee Engagement
  • Employee Engagement
  • Employee Retention
  • Employee Retention
  • Employee Retention
  • Employee Retention
  • Enterprise
  • Events
  • Forms
  • Friday Five
  • General Data Protection Regulation
  • Guest Post
  • Insights Hub
  • Intercept
  • klantervaring
  • [email protected]
  • LivePolls
  • Market Research
  • Market Research
  • Marketing
  • Marketing
  • Marktonderzoek
  • medewerkersonderzoek
  • Mercadotecnia
  • Mobile
  • Mobile
  • Mobile App
  • Mobile diaries
  • Mobile Surveys
  • New Features
  • non-profit
  • NPS
  • Online Communities
  • Polls
  • Question Types
  • Questionnaire
  • QuestionPro
  • QuestionPro Products
  • QuestionPro Products
  • Release Notes
  • Research
  • Research Tools and Apps
  • Revenue at Risk
  • Startups
  • Survey Templates
  • Surveys
  • Surveys
  • Tech News
  • Tech News
  • Tips
  • Training
  • Training Tips
  • Trending
  • Uncategorized
  • Video Learning Series
  • VOC
  • Webinar
  • Webinars
  • What’s Coming Up
  • Workforce
  • Workforce
  • Workforce
  • Workforce Intelligence
  • Workforce Intelligence
  • Workforce Intelligence

Copyright © 2023 · Magazine Pro on Genesis Framework · WordPress · Log in

questionpro-logo-nw
Help center Live Chat SIGN UP FREE
  • Sample questions
  • Sample reports
  • Survey logic
  • Branding
  • Integrations
  • Professional services
  • Security
  • Survey Software
  • Customer Experience
  • Workforce
  • Communities
  • Audience
  • Polls Explore the QuestionPro Poll Software - The World's leading Online Poll Maker & Creator. Create online polls, distribute them using email and multiple other options and start analyzing poll results.
  • Research Edition
  • LivePolls
  • InsightsHub
  • Blog
  • Articles
  • eBooks
  • Survey Templates
  • Case Studies
  • Training
  • Webinars
  • Coronavirus Resources
  • All Plans
  • Nonprofit
  • Academic
  • Qualtrics Alternative Explore the list of features that QuestionPro has compared to Qualtrics and learn how you can get more, for less.
  • SurveyMonkey Alternative
  • VisionCritical Alternative
  • Medallia Alternative
  • Likert Scale Complete Likert Scale Questions, Examples and Surveys for 5, 7 and 9 point scales. Learn everything about Likert Scale with corresponding example for each question and survey demonstrations.
  • Conjoint Analysis
  • Net Promoter Score (NPS) Learn everything about Net Promoter Score (NPS) and the Net Promoter Question. Get a clear view on the universal Net Promoter Score Formula, how to undertake Net Promoter Score Calculation followed by a simple Net Promoter Score Example.
  • Offline Surveys
  • Customer Satisfaction Surveys
  • Employee Survey Software Employee survey software & tool to create, send and analyze employee surveys. Get real-time analysis for employee satisfaction, engagement, work culture and map your employee experience from onboarding to exit!
  • Market Research Survey Software Real-time, automated and advanced market research survey software & tool to create surveys, collect data and analyze results for actionable market insights.
  • GDPR & EU Compliance
  • Employee Experience
  • Customer Joruney
  • About us
  • Executive Team
  • In the news
  • Testimonials
  • Advisory Board
  • Careers
  • Brand
  • Media Kit
  • Contact Us

QuestionPro in your language

  • English
  • Español (Spanish)
  • Português (Portuguese (Brazil))
  • Nederlands (Dutch)
  • العربية (Arabic)
  • Français (French)
  • Italiano (Italian)
  • 日本語 (Japanese)
  • Türkçe (Turkish)
  • Svenska (Swedish)

Awards & certificates

  • survey-leader-asia-leader-2023
  • survey-leader-asiapacific-leader-2023
  • survey-leader-enterprise-leader-2023
  • survey-leader-europe-leader-2023
  • survey-leader-latinamerica-leader-2023
  • survey-leader-leader-2023
  • survey-leader-middleeast-leader-2023
  • survey-leader-mid-market-leader-2023
  • survey-leader-small-business-leader-2023
  • survey-leader-unitedkingdom-leader-2023
  • survey-momentumleader-leader-2023
  • bbb-acredited
The Experience Journal

Find innovative ideas about Experience Management from the experts

  • © 2022 QuestionPro Survey Software | +1 (800) 531 0228
  • Sitemap
  • Privacy Statement
  • Terms of Use