• Skip to main content
  • Skip to primary sidebar
  • Skip to footer
QuestionPro

QuestionPro

questionpro logo
  • Products
    survey software iconSurvey softwareOur flagship survey solution. Sophisticated tools to get the answers you need.research edition iconResearch SuiteTuned for researchers. Get more insights. Response based pricing.CX iconCXExperiences change the world. Deliver the best with our CX management software.WF iconWorkforceEmpower your work leaders, make informed decisions and drive employee engagement.
  • Solutions
    IndustriesGamingAutomotiveSports and eventsEducationGovernment
    Travel & HospitalityFinancial ServicesHealthcareCannabisTechnology
    Use CaseNPS+CommunitiesAudienceContactless surveysMobile
    LivePollsMember ExperienceGDPRPositive People Science360 Feedback Surveys
  • Resources
    BlogeBooksSurvey TemplatesCase StudiesTrainingHelp center
  • Features
  • Pricing
Language
  • English
  • Español (Spanish)
  • Português (Portuguese (Brazil))
  • Nederlands (Dutch)
  • العربية (Arabic)
  • Français (French)
  • Italiano (Italian)
  • 日本語 (Japanese)
  • Türkçe (Turkish)
  • Svenska (Swedish)
Call Us
+1 800 531 0228 +1 (647) 956-1242 +52 999 402 4079 +49 301 663 5782 +44 20 3650 3166 +81-3-6869-1954 +61 2 8074 5080 +971 529 852 540
Log In Log In
SIGN UP FREE

Home Market Research

Ordinal Scale: Definition, Level of Measurement and Examples

Ordinal Scale

Ordinal Scale Definition

Ordinal scale is the 2nd level of measurement that reports the ranking and ordering of the data without actually establishing the degree of variation between them. Ordinal level of measurement is the second of the four measurement scales.

“Ordinal” indicates “order”. Ordinal data is quantitative data which have naturally occurring orders and the difference between is unknown. It can be named, grouped and also ranked.

For example:

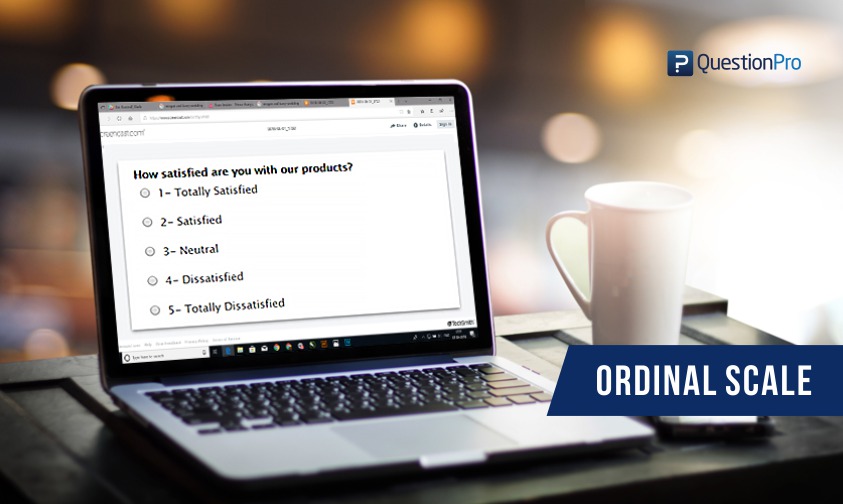
“How satisfied are you with our products?”

  • 1- Totally Satisfied
  • 2- Satisfied
  • 3- Neutral
  • 4- Dissatisfied
  • 5- Totally Dissatisfied
“How happy are you with the customer service?”

  • 1- Very Unhappy
  • 2- Unhappy
  • 3- Neutral
  • 4- Unhappy
  • 5- Very Unhappy

Survey respondents will choose between these options of satisfaction but the answer to “how much?” will remain unanswered. The understanding of various scales helps statisticians and researchers so that the use of data analysis techniques can be applied accordingly.

Thus, an ordinal scale is used as a comparison parameter to understand whether the variables are greater or lesser than one another using sorting. The central tendency of the ordinal scale is Median.

Likert Scale is an example of why the interval difference between ordinal variables cannot be concluded. In this scale the answer options usually polar such as, “Totally satisfied” to “Totally dissatisfied”.

The intensity of difference between these options can’t be related to specific values as the difference value between totally satisfied and totally dissatisfied will be much larger than the difference between satisfied and neutral. If someone loves Mercedes Benz cars and is asked “How likely are you to recommend Mercedes Benz to your friends and family?” will be troubled to choose between Extremely likely and Likely. Thus, an ordinal scale is used when the order of options is to be deduced and not when the interval difference is also to be established.

Ordinal Characteristics

  • Along with identifying and describing the magnitude, the ordinal scale shows the relative rank of variables.
  • The properties of the interval are not known.
  • Measurement of non-numeric attributes such as frequency, satisfaction, happiness etc.
  • In addition to the information provided by nominal scale, ordinal scale identifies the rank of variables.
  • Using this scale, survey makers can analyze the degree of agreement among respondents with respect to the identified order of the variables.

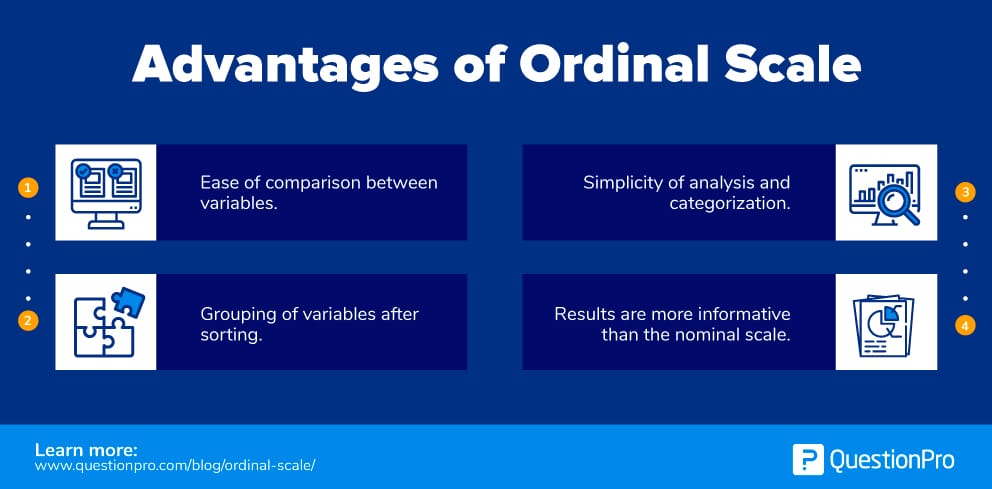
Advantages of Ordinal Scale

  • The primary advantage of using ordinal scale is the ease of comparison between variables.
  • Extremely convenient to group the variables after ordering them.
  • Effectively used in surveys, polls, and questionnaires due to the simplicity of analysis and categorization. Collected responses are easily compared to draw impactful conclusions about the target audience.
  • As the values are indicated in a relative manner using a linear rating scale, the results are more informative than the nominal scale.

Adventages of Ordinal Scale


Learn about: Interval Scale and Ratio Scale

Ordinal Examples

  • Ranking of high school students – 1st, 3rd, 4th, 10th… Nth. A student scoring 99/100 would be the 1st rank, another student scoring 92/100 would be 3rd and so on and so forth.
  • Rating surveys in restaurants –  When a waiter gets a paper or online survey with a question: “How satisfied are you with the dining experience?” having 0-10 option, 0 being extremely dissatisfied and 10 being extremely satisfied.
  • Likert Scale – The Likert scale is a variant of the ordinal scale that is used to calculate customer or employee satisfaction.

Liker Scale Example

  • Understanding the socio-economic background of the target audience – Rich, middle class, poor etc. fall under the ordinal data category.
  • The frequency of occurrence – Questions such as “How frequently do you have to get the phone repaired?”
    • Very often
    • Often
    • Not Often
    • Not at all
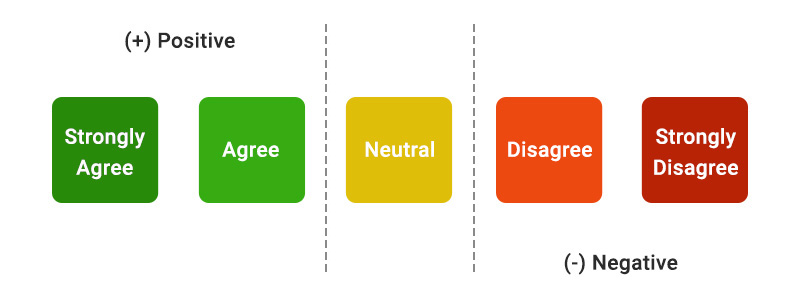
  • Evaluating the degree of agreement – State your level of agreement with the company policies:
    • Totally agree
    • Agree
    • Neutral
    • Disagree
    • Totally disagree
  • Understanding preferences: If a marketer conducts surveys to understand which laptop brand do their respondents do not prefer, they can use the ordinal scale. Out of the five mentioned laptop brand, rate the order of preference –
    •  HP
    • Apple
    • Lenovo
    • Dell
    • Acer
SHARE THIS ARTICLE:

About the author
Adi Bhat
View all posts by Adi Bhat

Primary Sidebar

Gain insights with 80+ features for free

Create, Send and Analyze Your Online Survey in under 5 mins!

Create a Free Account

RELATED ARTICLES

HubSpot - QuestionPro Integration

Are You Listening? Really Listening? — Tuesday CX Thoughts

Feb 28,2023

HubSpot - QuestionPro Integration

Agile Market Research: What is & how to start

Feb 23,2022

HubSpot - QuestionPro Integration

Shopping Journey: Definition, Elements + User Cases

Jan 14,2023

BROWSE BY CATEGORY

  • Academic
  • Academic Research
  • Academic Research
  • Artificial Intelligence
  • Assessments
  • Audience
  • Brand Awareness
  • Brand Awareness
  • Branding
  • Business
  • Business
  • Case Studies
  • Communities
  • Consumer Insights
  • Consumer Insights
  • Customer effort score
  • Customer Engagement
  • Customer Experience
  • Customer Experience IN
  • Customer Loyalty
  • Customer Loyalty
  • Customer Research
  • Customer Satisfaction
  • Customer Satisfaction
  • CX
  • Decision Making
  • Employee Benefits
  • Employee Engagement
  • Employee Engagement
  • Employee Engagement
  • Employee Retention
  • Employee Retention
  • Employee Retention
  • Employee Retention
  • Enterprise
  • Events
  • Forms
  • Friday Five
  • General Data Protection Regulation
  • Guest Post
  • Insights Hub
  • Intercept
  • klantervaring
  • Life@QuestionPro
  • LivePolls
  • Market Research
  • Market Research
  • Marketing
  • Marketing
  • Marktonderzoek
  • medewerkersonderzoek
  • Mercadotecnia
  • Mobile
  • Mobile
  • Mobile App
  • Mobile diaries
  • Mobile Surveys
  • New Features
  • non-profit
  • NPS
  • Online Communities
  • Polls
  • Question Types
  • Questionnaire
  • QuestionPro
  • QuestionPro Products
  • QuestionPro Products
  • Release Notes
  • Research
  • Research Tools and Apps
  • Revenue at Risk
  • Startups
  • Survey Templates
  • Surveys
  • Surveys
  • Tech News
  • Tech News
  • Tips
  • Training
  • Training Tips
  • Trending
  • Uncategorized
  • Video Learning Series
  • VOC
  • Webinar
  • Webinars
  • What’s Coming Up
  • Workforce
  • Workforce
  • Workforce
  • Workforce
  • Workforce Intelligence
  • Workforce Intelligence
  • Workforce Intelligence

Footer

MORE LIKE THIS

A positive work environment improves employee morale, retention, and productivity. It helps making a workplace better for everyone.

Work Environment: What it is, Types & Elements to Create it

Mar 23, 2023

People science is an approach to market research that goes beyond traditional methods to understand the people behind the data.

People Science: What it Means for the Workforce

Mar 22, 2023

Let's learn the importance of personalization in a successful customer experience program from my recent ski trip experience.

Ski Days and CX: Defining Fun For Everyone — Tuesday CX Thoughts

Mar 21, 2023

Adaptive conjoint analysis is a market research method that adapts to each person's answers to determine which product features are liked.

Adaptive Conjoint Analysis: What is it, Types & User Cases

Mar 19, 2023

Other categories

  • Academic
  • Academic Research
  • Academic Research
  • Artificial Intelligence
  • Assessments
  • Audience
  • Brand Awareness
  • Brand Awareness
  • Branding
  • Business
  • Business
  • Case Studies
  • Communities
  • Consumer Insights
  • Consumer Insights
  • Customer effort score
  • Customer Engagement
  • Customer Experience
  • Customer Experience IN
  • Customer Loyalty
  • Customer Loyalty
  • Customer Research
  • Customer Satisfaction
  • Customer Satisfaction
  • CX
  • Decision Making
  • Employee Benefits
  • Employee Engagement
  • Employee Engagement
  • Employee Engagement
  • Employee Retention
  • Employee Retention
  • Employee Retention
  • Employee Retention
  • Enterprise
  • Events
  • Forms
  • Friday Five
  • General Data Protection Regulation
  • Guest Post
  • Insights Hub
  • Intercept
  • klantervaring
  • Life@QuestionPro
  • LivePolls
  • Market Research
  • Market Research
  • Marketing
  • Marketing
  • Marktonderzoek
  • medewerkersonderzoek
  • Mercadotecnia
  • Mobile
  • Mobile
  • Mobile App
  • Mobile diaries
  • Mobile Surveys
  • New Features
  • non-profit
  • NPS
  • Online Communities
  • Polls
  • Question Types
  • Questionnaire
  • QuestionPro
  • QuestionPro Products
  • QuestionPro Products
  • Release Notes
  • Research
  • Research Tools and Apps
  • Revenue at Risk
  • Startups
  • Survey Templates
  • Surveys
  • Surveys
  • Tech News
  • Tech News
  • Tips
  • Training
  • Training Tips
  • Trending
  • Uncategorized
  • Video Learning Series
  • VOC
  • Webinar
  • Webinars
  • What’s Coming Up
  • Workforce
  • Workforce
  • Workforce
  • Workforce
  • Workforce Intelligence
  • Workforce Intelligence
  • Workforce Intelligence

questionpro-logo-nw
Help center Live Chat SIGN UP FREE
  • Sample questions
  • Sample reports
  • Survey logic
  • Branding
  • Integrations
  • Professional services
  • Security
  • Survey Software
  • Customer Experience
  • Workforce
  • Communities
  • Audience
  • Polls Explore the QuestionPro Poll Software - The World's leading Online Poll Maker & Creator. Create online polls, distribute them using email and multiple other options and start analyzing poll results.
  • Research Edition
  • LivePolls
  • InsightsHub
  • Blog
  • Articles
  • eBooks
  • Survey Templates
  • Case Studies
  • Training
  • Webinars
  • Coronavirus Resources
  • All Plans
  • Nonprofit
  • Academic
  • Qualtrics Alternative Explore the list of features that QuestionPro has compared to Qualtrics and learn how you can get more, for less.
  • SurveyMonkey Alternative
  • VisionCritical Alternative
  • Medallia Alternative
  • Likert Scale Complete Likert Scale Questions, Examples and Surveys for 5, 7 and 9 point scales. Learn everything about Likert Scale with corresponding example for each question and survey demonstrations.
  • Conjoint Analysis
  • Net Promoter Score (NPS) Learn everything about Net Promoter Score (NPS) and the Net Promoter Question. Get a clear view on the universal Net Promoter Score Formula, how to undertake Net Promoter Score Calculation followed by a simple Net Promoter Score Example.
  • Offline Surveys
  • Customer Satisfaction Surveys
  • Employee Survey Software Employee survey software & tool to create, send and analyze employee surveys. Get real-time analysis for employee satisfaction, engagement, work culture and map your employee experience from onboarding to exit!
  • Market Research Survey Software Real-time, automated and advanced market research survey software & tool to create surveys, collect data and analyze results for actionable market insights.
  • GDPR & EU Compliance
  • Employee Experience
  • Customer Journey
  • About us
  • Executive Team
  • In the news
  • Testimonials
  • Advisory Board
  • Careers
  • Brand
  • Media Kit
  • Contact Us

QuestionPro in your language

  • English
  • Español (Spanish)
  • Português (Portuguese (Brazil))
  • Nederlands (Dutch)
  • العربية (Arabic)
  • Français (French)
  • Italiano (Italian)
  • 日本語 (Japanese)
  • Türkçe (Turkish)
  • Svenska (Swedish)

Awards & certificates

  • survey-leader-asia-leader-2023
  • survey-leader-asiapacific-leader-2023
  • survey-leader-enterprise-leader-2023
  • survey-leader-europe-leader-2023
  • survey-leader-latinamerica-leader-2023
  • survey-leader-leader-2023
  • survey-leader-middleeast-leader-2023
  • survey-leader-mid-market-leader-2023
  • survey-leader-small-business-leader-2023
  • survey-leader-unitedkingdom-leader-2023
  • survey-momentumleader-leader-2023
  • bbb-acredited
The Experience Journal

Find innovative ideas about Experience Management from the experts

  • © 2022 QuestionPro Survey Software | +1 (800) 531 0228
  • Sitemap
  • Privacy Statement
  • Terms of Use