A KFC customer journey map traces everything a diner experiences with the brand. It starts the moment they see a chicken bucket ad. It ends, ideally, with a regular at the drive-thru. The map lines up touchpoints, pain points, and fixes side by side. That lets a team see the whole relationship, not just one order.
KFC runs more than 31,900 restaurants across 145 countries as of 2025. That scale makes consistency across every touchpoint a genuinely hard problem. What keeps customers coming back is not just the chicken. It’s a set of deliberate customer experience decisions, repeated at scale, order by order.
In this article, we’ll map out KFC’s five-stage customer journey. We’ll break down the initiatives behind it and cover how to build a similar map for your own restaurant or retail brand.
What is a customer journey map?
A customer journey map is a visual document. It lays out every stage, touchpoint, and emotion a customer moves through with a brand. It runs from first awareness to becoming a repeat customer or advocate. A good map turns scattered interactions into one shared reference a whole team can act on.
A useful map typically includes:
- Stages, the broad phases a customer moves through (awareness, consideration, decision, retention, advocacy)
- Touchpoints, the specific moments of contact, like a drive-thru window, an app screen, or a support call
- Customer actions, what the person is actually doing at each touchpoint
- Pain points, where friction, confusion, or delay shows up
- Fixes or opportunities, what the business does in response
The goal isn’t the map itself. It’s the decisions a team makes because the map made a hidden problem visible.
Customer journey map vs. Customer experience strategy vs. Buyer’s journey
These three terms get used interchangeably. But they describe different things, and mixing them up leads to the wrong deliverable at the wrong stage of planning.
| Term | What it covers | When it’s used |
|---|---|---|
| Customer journey map | A visual, stage-by-stage view of touchpoints, actions, and pain points for one specific journey (like ordering food or filing a complaint) | Diagnosing friction in a defined path a customer takes |
| Customer experience strategy | The broader plan for how a brand wants every interaction to feel, across all journeys and channels | Setting direction before individual journeys get mapped |
| Buyer’s journey | A narrower, three-stage model (awareness, consideration, decision) focused only on the path to a first purchase | Marketing and sales planning, before a customer relationship exists |
A journey map is a tool. A CX strategy is the plan the tool serves. The buyer’s journey is one slice of a much longer customer journey.
KFC’s customer experience strategy: A brief history
Colonel Harland Sanders started serving his fried chicken at a roadside restaurant in Corbin, Kentucky, in 1930. The first KFC franchise opened in Salt Lake City in 1952. The Colonel’s Original Recipe, a blend of 11 herbs and spices, has stayed one of the most closely guarded trade secrets in American business. It’s kept in a physical vault at company headquarters. That protectiveness over the product set the tone for how deliberately KFC has approached everything else customers touch.
KFC has layered several concrete initiatives on top of the product itself.
- Satisfaction guarantees.
KFC’s “Re-Colonelization” push introduced a taste guarantee. It promises to remake any meal a customer wasn’t happy with, backed by retraining staff on the brand’s original preparation process.
- Scoop to Order.
Rather than pre-packing sides hours in advance, KFC employees now scoop each side fresh per order. The chain’s own COO has compared it to an open assembly-line approach.
- Guest experience surveys.
KFC collects direct feedback after visits and ties incentives to participation. That closes the loop between what a customer experienced and what the operations team changes next. Getting this kind of survey right matters more than it looks. Even a well-intentioned feedback form can introduce bias that quietly skews the results.
- KFC Rewards.
KFC’s digital loyalty program lets members earn points on orders placed through the app or website. Points redeem for free items from a rotating rewards catalog. It replaces the older, less personalized promotions of past years.
KFC’s customer journey map example: Awareness to advocacy
Mapping these initiatives onto a standard five-stage model shows where each one actually does its work, and where gaps still show up.
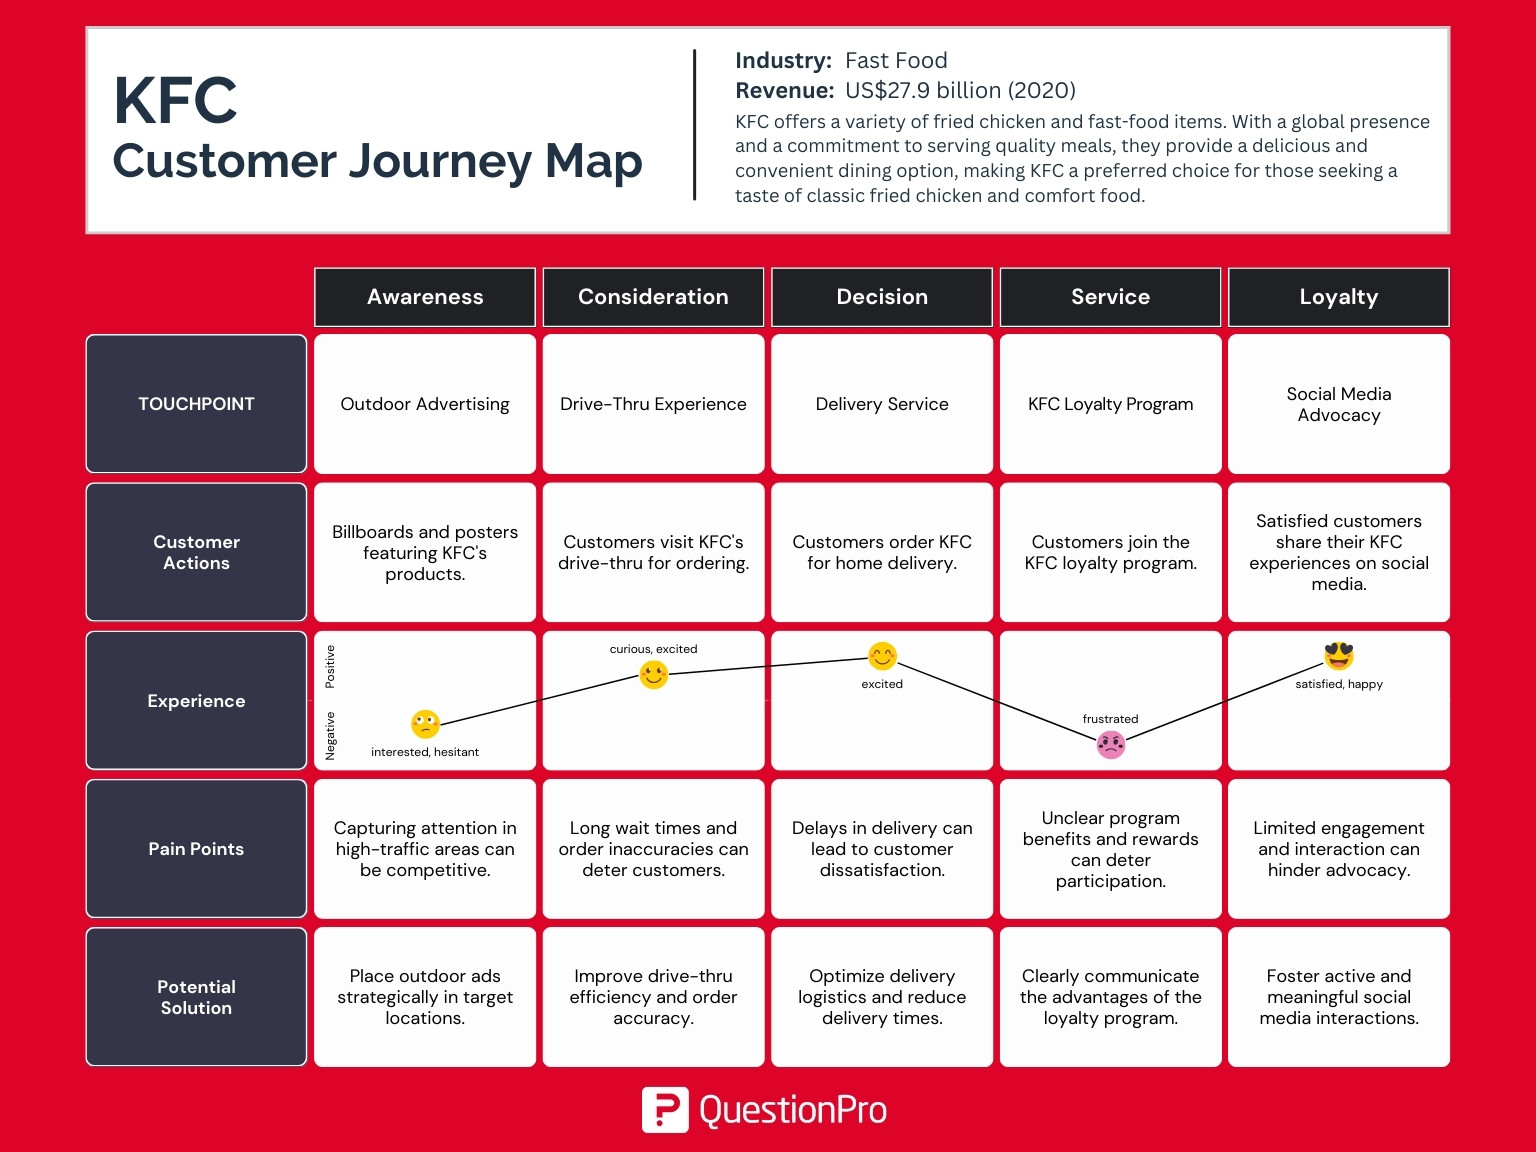
| Stage | Primary touchpoint | Common pain point | How KFC addresses it |
|---|---|---|---|
| Awareness | TV and social media ads | Getting noticed among dozens of competing fast-food messages | Consistent brand mascot (the Colonel) and high-frequency campaigns |
| Consideration | Website, app menu, online reviews | Menu overload and uncertainty from mixed reviews | Simplified digital menus and visible responses to public feedback |
| Decision | Drive-thru, kiosk, delivery app | Long wait times and order accuracy issues | Scoop to Order and kitchen technology aimed at speed and consistency |
| Retention | KFC Rewards, guest surveys | Unclear loyalty benefits or ignored feedback | Points-based rewards and closed-loop responses to survey input |
| Advocacy | Social media, referrals | Limited incentive to actively recommend the brand | User-generated content prompts and referral-style promotions |
What the pattern across all five stages reveals
- Speed and consistency matter at every stage, not just at the order counter.
- Feedback loops show up repeatedly. Surveys, reviews, and app data are how KFC catches problems before they scale to thousands of locations.
- The biggest visible gap is advocacy. KFC’s loyalty tools are stronger than its structured referral or review-generation efforts.
How to build your own customer journey map
You don’t need KFC’s scale to use the same method. Building a usable journey map comes down to a repeatable process.
- Pick one journey, not the whole business.
Map “first-time delivery order” or “in-store complaint resolution” separately. Don’t try to capture every possible interaction in one document.
- List the real touchpoints.
Walk the actual path a customer takes. Include channels your team doesn’t control directly, like third-party delivery apps or review sites.
- Collect direct customer input.
Pull from support tickets and feedback surveys rather than guessing at pain points from internal assumptions.
- Rank pain points by impact and frequency.
A rare but severe problem, like an order arriving wrong on a first visit, usually outranks a minor but common annoyance, like a slightly slow app screen. Fix the touchpoints that affect the most customers first.
- Assign an owner to each fix.
A pain point without an owner stays a pain point. Tie each fix to a team and a deadline, not just a note on the map.
- Revisit the map on a schedule.
Touchpoints shift when you change your menu, app, or ordering process. Treat the map as a living document, not a one-time workshop output. A dedicated journey mapping tool keeps these updates centralized instead of scattered across slide decks.
How to measure whether your customer journey map is working
A journey map is only useful if you can tell whether the fixes actually reduced friction. Three metrics do most of the work.
- Customer Satisfaction Score (CSAT) measures how a customer rated one specific interaction. It typically uses a 1-5 scale, collected right after the interaction happens. Track the percentage of customers who rate a touchpoint 4 or above. Watch that number stage by stage, not as one blended average.
- Net Promoter Score (NPS) asks how likely a customer is to recommend the brand, on a 0-10 scale. It sorts respondents into promoters, passives, and detractors. NPS fits the advocacy stage better than a single touchpoint, since it reflects the whole relationship.
- Customer Effort Score (CES) measures how much work a customer had to do to get something resolved, like fixing a wrong order or redeeming a reward. High effort predicts churn even when satisfaction scores look fine. That’s why it’s worth tracking on its own.
For any of these, pair the score with a short, direct follow-up like an AskWhy question. The number tells you something changed. The follow-up tells you what to fix next.
Common mistakes in customer journey mapping
- Mapping the ideal path instead of the real one.
Teams often draw the journey as it’s supposed to work, not as customers actually experience it. That skips the messy detours through third-party apps and social media complaints.
- Building the map once and never updating it.
A map from two years ago won’t reflect a new app, a new menu, or a new competitor’s entry into the market.
- Treating every pain point as equally urgent.
Without a ranking step, teams chase the loudest recent complaint instead of the highest-impact fix.
- Skipping the internal side.
A journey map shows the customer’s experience. Ignoring the staff workflow behind each touchpoint means fixes get proposed that operations can’t actually deliver.
- Collecting feedback without acting on it.
Guest surveys that never change anything train customers to stop responding.
How QuestionPro supports customer journey mapping
Collecting feedback at each stage is only half the problem. The harder part is connecting that feedback back to a specific touchpoint, so a team can see exactly where satisfaction drops. QuestionPro BI is built for that layer. It does two things a spreadsheet-based journey map usually can’t:
- Pulls CSAT, NPS, and open-ended responses into one dashboard, organized by journey stage instead of one blended score
- Flags a drop at a specific stage, like decision or retention, before it gets buried inside an overall satisfaction average
That’s a different problem than building the map itself. It’s the piece most manual journey mapping efforts never get to.
What KFC’s journey map means for other restaurant brands
KFC’s advantage was never just the fried chicken. Every customer-facing decision, from a kitchen process change to a loyalty app, gets built with a specific stage of the customer journey in mind. Each one gets checked against real feedback, not internal assumptions.
A single-location restaurant can’t match KFC’s advertising budget. But it can match this method. Map the real path a customer takes. Rank the friction that actually matters, and close the loop on what customers say. That approach scales down just as well as it scales up.
Frequently Asked Questions (FAQs)
A customer journey map is a visual outline of every step a customer takes with a brand, from first noticing it to buying and recommending it. It highlights touchpoints and friction points so a team can improve the experience end to end.
Most customer journey maps use five stages: awareness, consideration, decision, retention, and advocacy. Some teams use a shorter three-stage buyer’s journey model instead, covering only awareness, consideration, and decision, which fits shorter B2C purchase paths.
A customer journey map shows the customer’s side of an experience, including feelings and pain points. A service blueprint adds the internal view, mapping staff actions and systems behind each touchpoint, so the two work together rather than replacing each other.
A restaurant brand should revisit its journey map at least twice a year, or right after a major menu, app, or ordering change. Drive-thru and app updates shift touchpoints quickly, and an outdated map hides new friction points from the team.
Yes. A single-location restaurant can map the same five stages using a whiteboard, spreadsheet, or survey tool. The scale differs from KFC’s thousands of stores, but the method, tracking touchpoints, pain points, and fixes, works the same way for one location or a thousand.