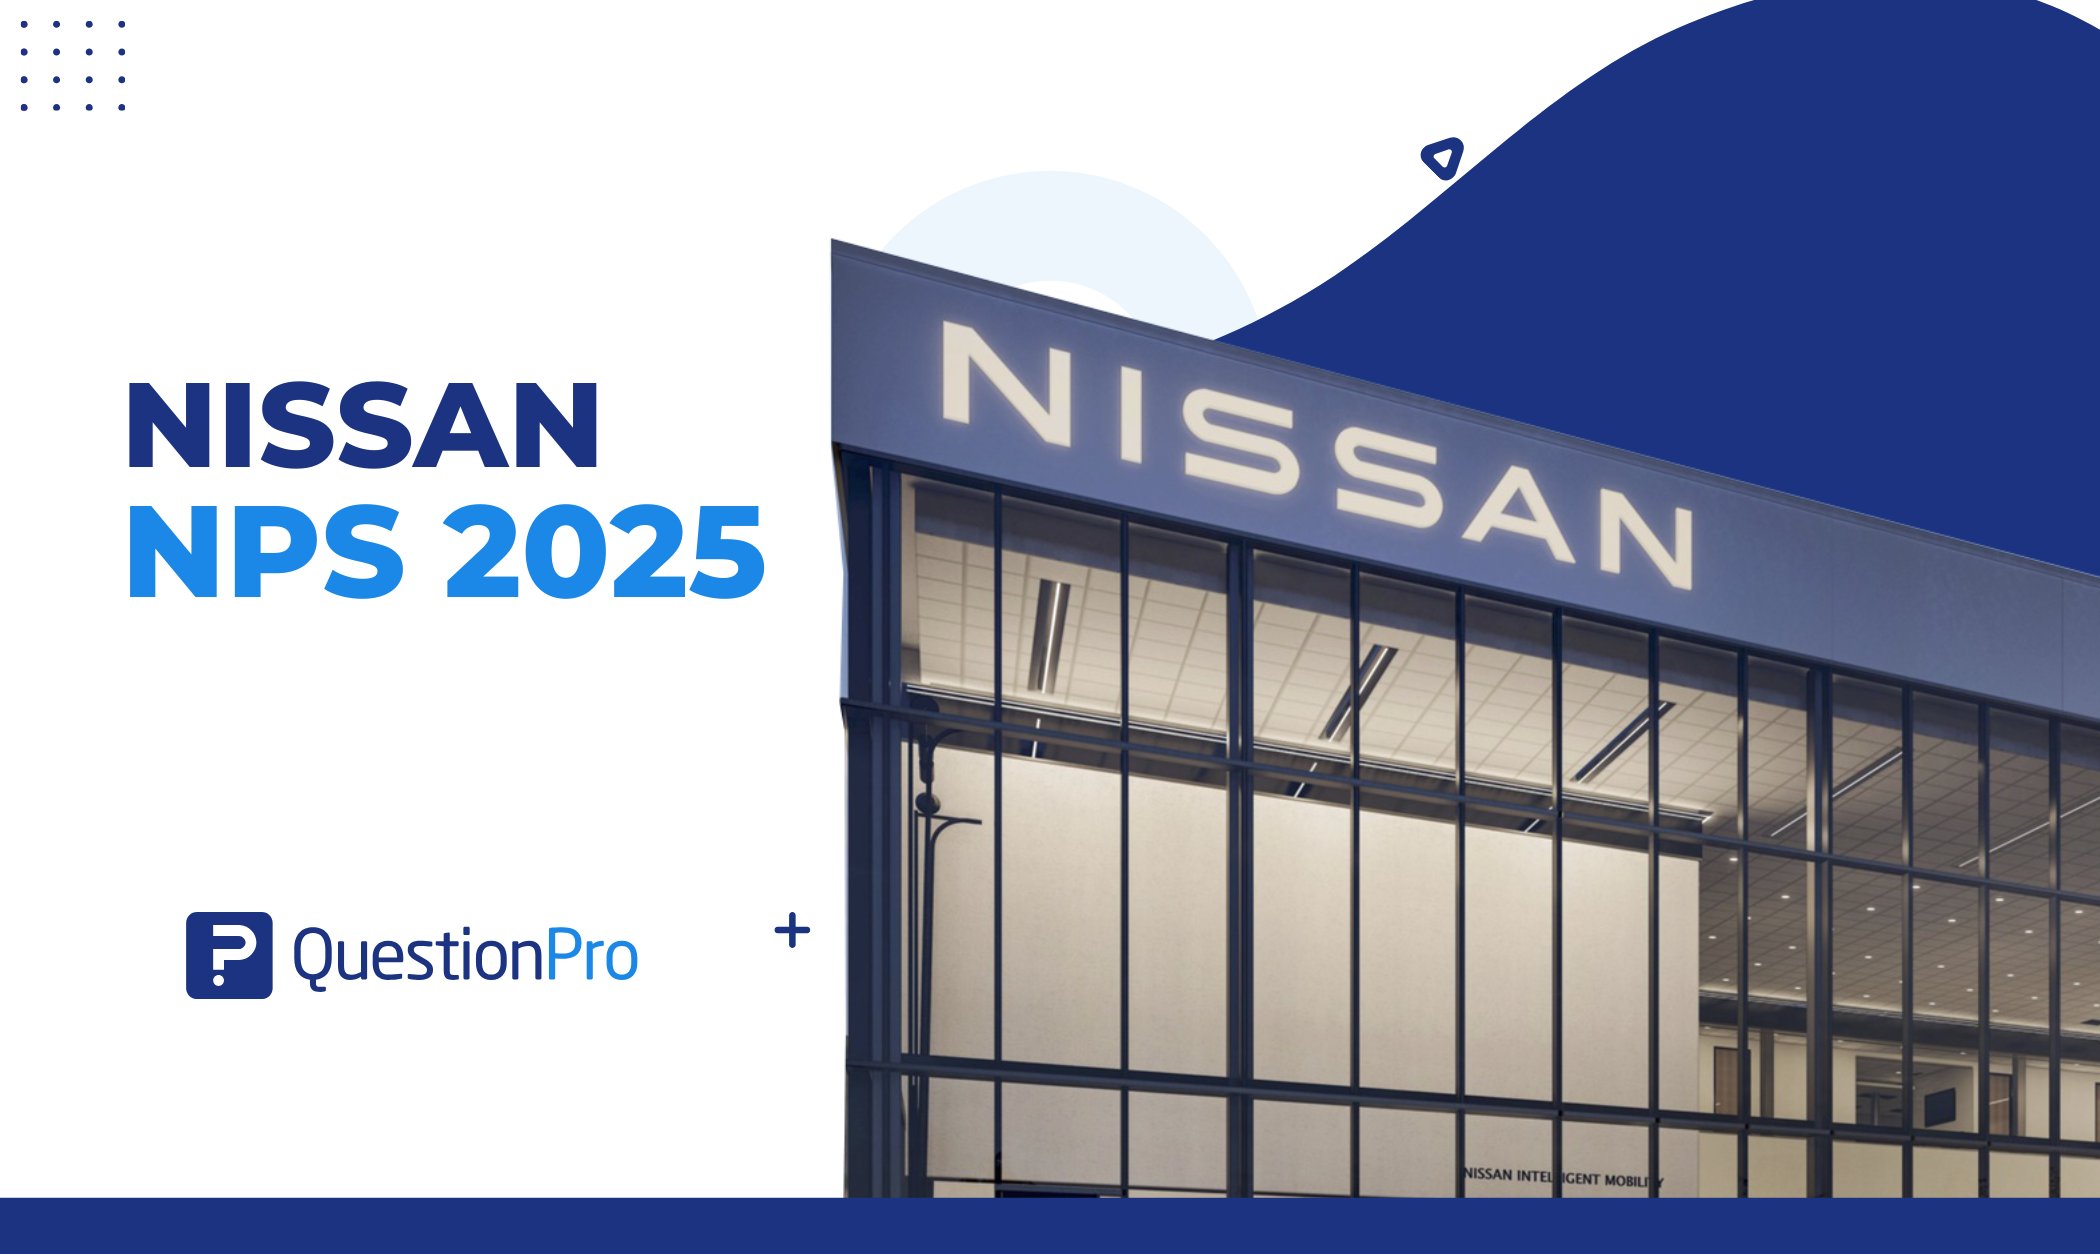
Nissan NPS 2025 data points to a brand with more satisfied drivers than vocal advocates. Net Promoter Score, or NPS, is a one-question metric that predicts customer loyalty and referral behavior with a single number.
Nissan’s current score sits well below the automotive industry average, and the reasons trace back to service quality, warranty handling, and how complaints get resolved. Other trackers publish different Nissan figures entirely, which makes the score easy to misread without context.
This breakdown covers Nissan’s 2025 NPS, explains why sources disagree, and walks through how automotive brands turn NPS data into real loyalty gains.
What is Nissan’s NPS score in 2025?
Nissan’s Net Promoter Score for 2025 is 19, well below the U.S. automotive industry average of 41, according to QuestionPro’s Q1 2025 NPS and CSAT Benchmark Report. The study surveyed 1,000 U.S. consumers involved in recent vehicle purchases and is refreshed every quarter.
The breakdown shows where Nissan holds support and where it loses it:
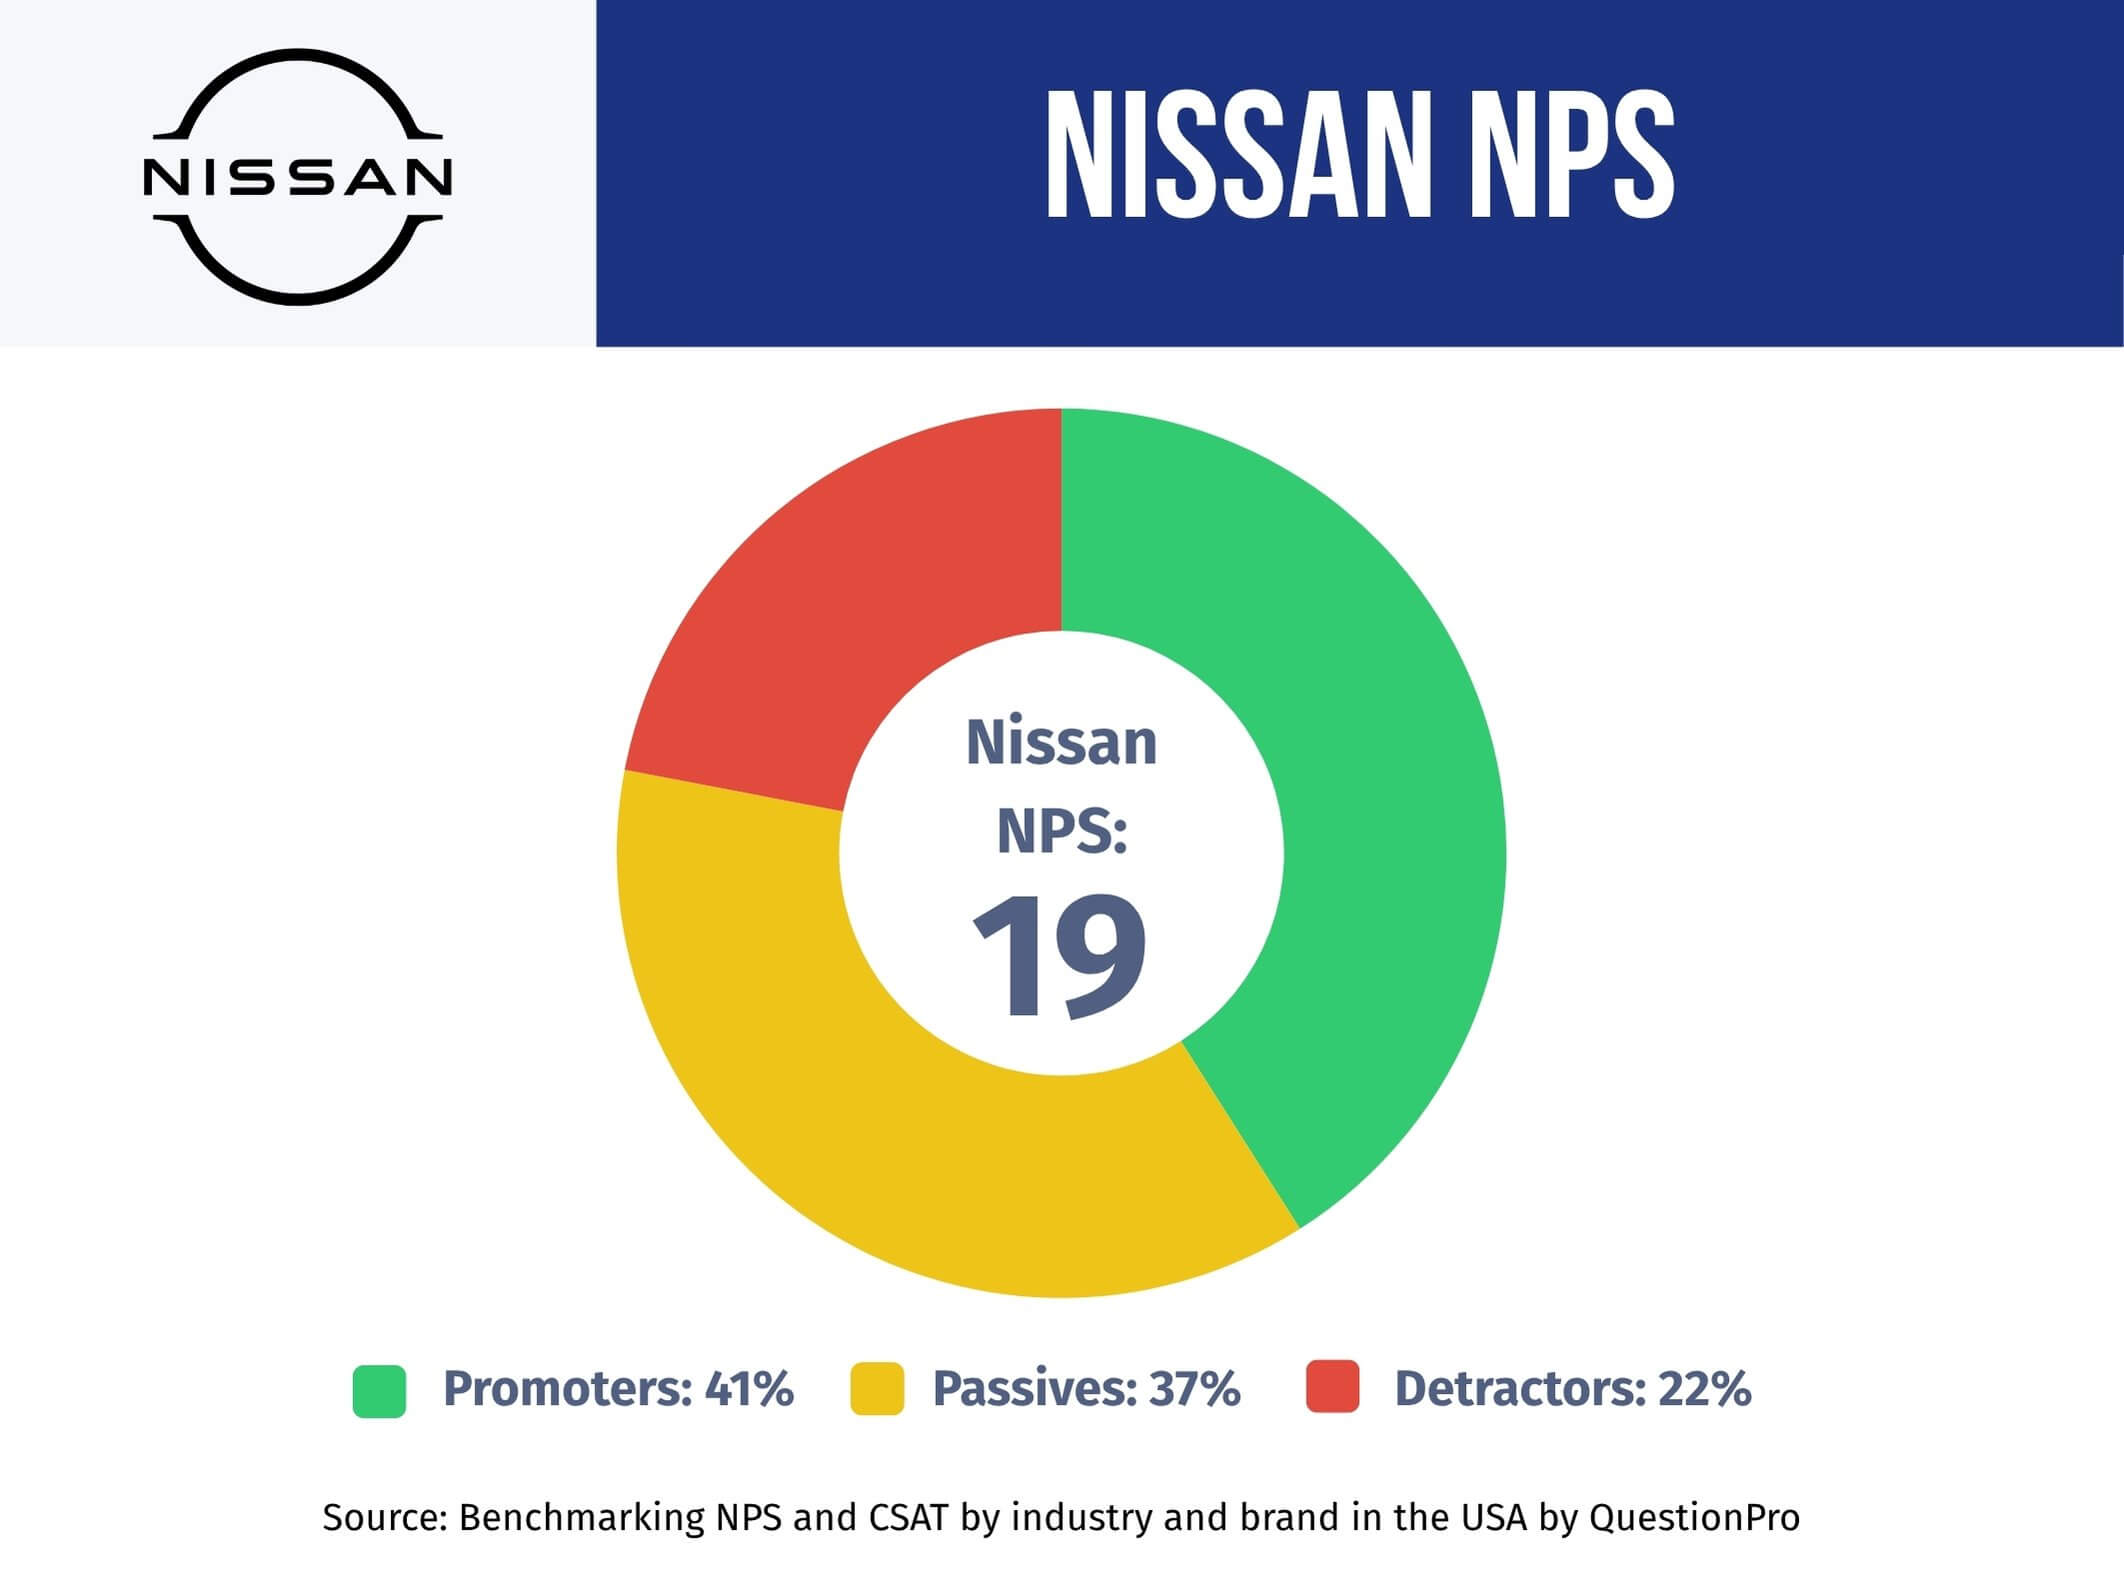
- Promoters: 41% of respondents are loyal enough to recommend Nissan to a friend or colleague.
- Passives: 37% are satisfied but not enthusiastic, and could switch brands with little friction.
- Detractors: 22% are actively unhappy and likely to discourage others from buying a Nissan.
A large passive middle combined with a sizable detractor group is what keeps the overall score low, even though promoters are technically the biggest single group. That gap between “satisfied” and “loyal” is the real story behind the number.
What does Net Promoter Score measure?
Net Promoter Score (NPS) is a customer loyalty metric built from a single question: “On a scale of 0 to 10, how likely are you to recommend us to a friend or colleague?” The answer converts into one number between -100 and 100.
The math behind it stays simple. NPS equals the percentage of Promoters minus the percentage of Detractors, based on how each respondent scored the recommendation question.
| Score range | Category | What it means |
|---|---|---|
| 9 to 10 | Promoters | Loyal customers who actively recommend the brand |
| 7 to 8 | Passives | Satisfied but unenthusiastic, open to switching |
| 0 to 6 | Detractors | Dissatisfied customers who discourage others |
A positive score means promoters outnumber detractors, and most U.S. industries treat anything above 30 as solid. Net Promoter Score is the parent metric behind most loyalty tracking programs, and it works best alongside Customer Satisfaction Score (CSAT) surveys, which measure how happy a customer feels today rather than whether that feeling turns into a referral tomorrow.
Why does Nissan’s NPS look different depending on the source?
Search for Nissan’s NPS and the numbers will not agree, and that mismatch is normal rather than a mistake. Each source measures a different population using a different method and timeframe.
QuestionPro’s figure of 19 comes from a controlled quarterly survey of 1,000 U.S. vehicle buyers, all asked the same standardized recommendation question. Brand-tracking sites report separate figures for individual Nissan entities, with results ranging from negative scores up into the mid-40s, because those samples pull from different respondent pools, as shown across Comparably’s Nissan brand pages. The American Customer Satisfaction Index uses a completely different scale and puts Nissan’s satisfaction score at 77 out of 100 for 2024, close to the mass-market average of 79, according to Statista’s ACSI tracking.
None of these numbers are wrong. They answer different questions about who was surveyed, when, and what was actually asked. Comparing an internal NPS program to a public figure only works when the sample size, timeframe, and exact question wording line up.
How does Nissan compare to other automakers in 2025?
Nissan’s score of 19 places it last among the five major automotive brands tracked in QuestionPro’s NPS in the automotive industry benchmark study.
| Brand | 2025 NPS | Standout driver |
|---|---|---|
| Toyota | 67 | Long-term reliability and trust |
| Honda | 57 | Dealership service and resale value |
| Chevrolet | 48 | Perceived value for price |
| Ford | 32 | Legacy trust, weaker repurchase intent |
| Nissan | 19 | Service and warranty friction |
The 48-point gap between Toyota and Nissan is not the result of one bad quarter. Toyota’s 81% promoter rate comes from decades of consistent build quality that keeps repair complaints rare. Nissan’s detractor rate, by contrast, reflects a pattern that repeats across quarters, which is why narrowing the gap takes sustained operational change rather than a single marketing push.
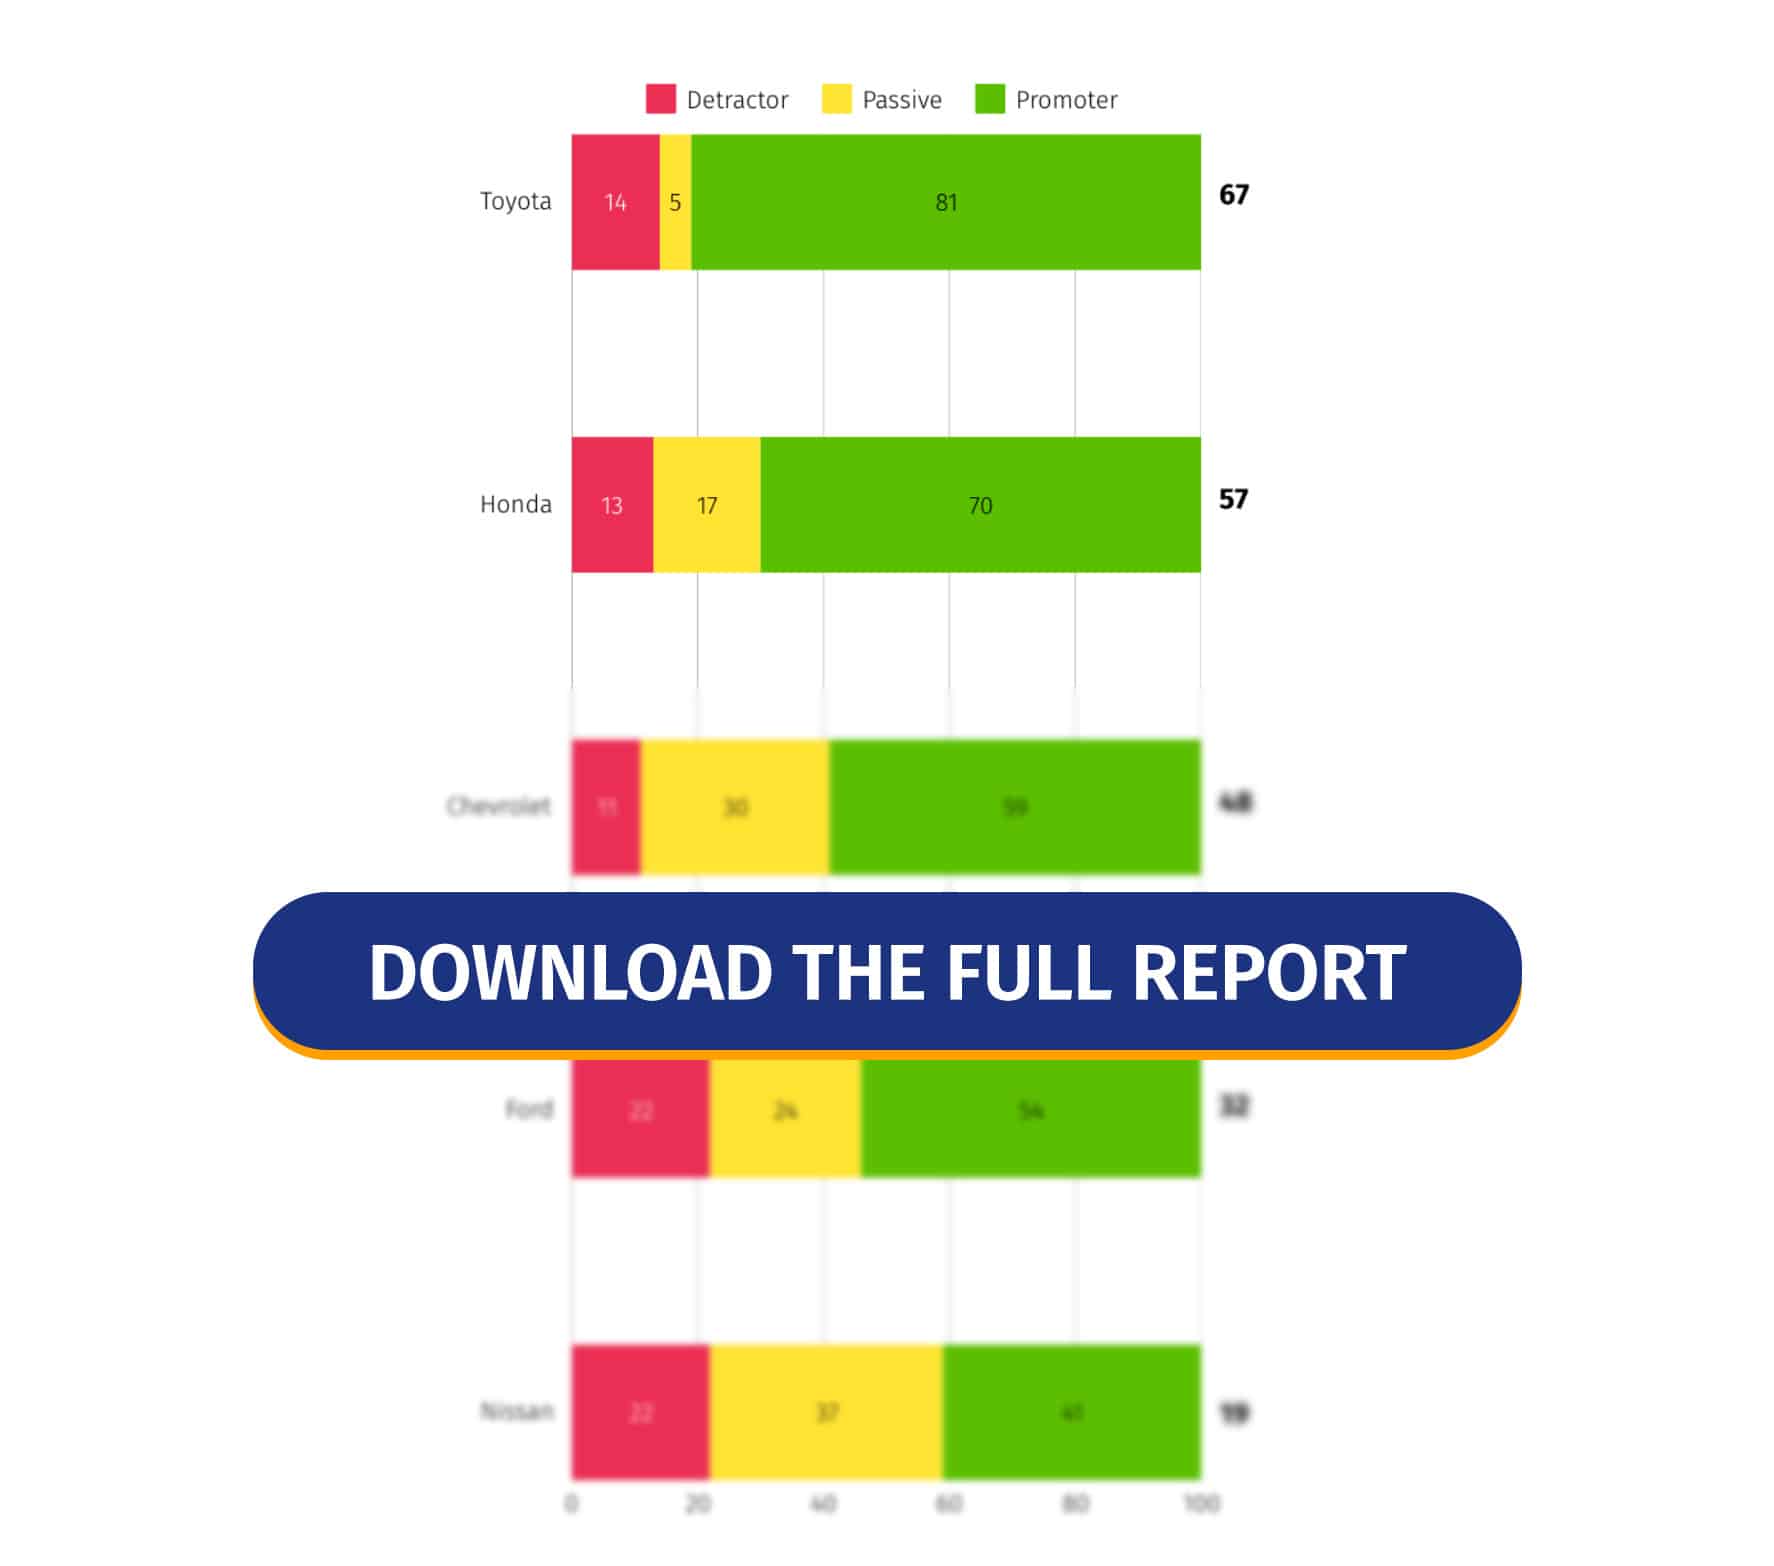
These insights are based on QuestionPro’s most recent study, where 1,000 participants were surveyed to measure the NPS across different companies and industries. The report represents genuine user feedback from Q1 2025 and is updated every quarter.
What is driving Nissan’s NPS down?
Customer feedback tied to Nissan’s low score points to a handful of recurring issues rather than one isolated complaint category. Automakers that run dedicated automotive customer experience programs, built on top of general-purpose online survey software, tend to catch these patterns earlier because feedback gets tied to a specific service visit or purchase rather than collected in the abstract.
Inconsistent customer service
Reviewers describe dismissive or unhelpful responses from dealership and support staff. A lack of empathy in these interactions leaves customers feeling unheard well after the original issue is resolved.
Vehicle reliability concerns
Some owners report mechanical problems, including engine issues and transmission faults, occasionally on vehicles still under warranty. Reliability complaints like these directly erode the trust that drives repeat purchases and referrals.
Warranty and claims friction
Customers note that Nissan sometimes covers major repairs under warranty but declines to reimburse related costs such as towing or rental cars. That gap between “covered” and “made whole” shifts the financial burden back onto the customer.
Digital service gaps
Persistent login issues and unresponsive support channels on Nissan’s digital platforms add friction on top of existing service concerns, compounding frustration rather than resolving it.
How can a business measure and improve NPS like Nissan?
Turning an NPS number into action follows a consistent process, whether the brand is a global automaker or a regional dealership group.
- Send a short recommendation survey.
A ready-made NPS survey template covers the core recommendation question, followed by an open-ended “why did you give that score” prompt to capture context. - Distribute to the right audience.
Email, SMS, and QR codes work for existing customers. For broader benchmarking, a panel like QuestionPro Audience can target respondents by age, region, or vehicle ownership. - Sort responses automatically.
Survey platforms group answers into Promoters, Passives, and Detractors as responses come in, removing manual calculation. - Close the loop fast.
Route detractor responses to a recovery workflow and promoter responses to a referral or review request within days, not weeks. - Track the trend, not just the snapshot.
A single quarter’s score matters less than whether it is moving up or down over time.
Common mistakes to avoid when tracking automotive NPS
A few recurring errors distort how brands interpret and act on their NPS data.
| Mistake | Why it backfires |
|---|---|
| Confusing quality awards with loyalty scores | Nissan topped the mass-market segment in the J.D. Power 2025 U.S. Initial Quality Study, which measures problems in the first 90 days, a different question from whether owners recommend the brand years later |
| Treating one quarter as the full picture | A single score can reflect a temporary spike in complaints rather than a lasting trend |
| Ignoring the passive segment | Passives rarely complain, but they switch brands quietly and skew future scores |
| Comparing scores across mismatched samples | Public trackers and proprietary surveys rarely use the same question, scale, or audience |
| Collecting feedback without a follow-up plan | An NPS program without a closed-loop response process only measures dissatisfaction, it never resolves it |
Where NPS goes from here for automotive brands
A single NPS number will never explain everything about how customers feel, but tracked consistently, it shows whether service investments and product fixes are actually landing. Nissan’s 2025 score is a signal, not a verdict, and the detail behind it, service friction, warranty gaps, and inconsistent support, points to specific places to start.
Brands that pair quarterly NPS tracking with a real closed-loop response process, the kind built into QuestionPro’s Customer Experience platform, tend to close these gaps faster than those relying on annual surveys alone. This guide has covered what Nissan’s score means, why public figures diverge, and how any automotive brand can turn the same data into measurable loyalty gains.
Check out the Q1 2025 NPS Benchmark Report to learn how top brands are winning customer loyalty.
Want to improve your NPS? Reach out to the QuestionPro experts for customized tips to help you boost customer satisfaction and loyalty.
Frequently Asked Questions (FAQs)
Scores above 30 are considered solid in most U.S. industries, but automotive runs higher than average. QuestionPro’s Q1 2025 data puts the sector benchmark at 41, so a genuinely strong automotive NPS typically starts in the 50s and climbs from there.
Yes. NPS ranges from -100 to 100, and a negative score simply means detractors outnumber promoters. It signals serious dissatisfaction but is not unusual for brands going through service disruptions, recalls, or leadership changes.
The figures come from a quarterly survey of 1,000 U.S. consumers who recently purchased or serviced a vehicle, all asked the same standardized recommendation question. QuestionPro refreshes the report each quarter to reflect current sentiment.
NPS measures loyalty and the likelihood of a referral using one recommendation question. CSAT measures satisfaction with a specific interaction, like a service visit, using a direct happiness rating. Brands typically track both together.
No. Quality studies measure defects and problems in the first 90 days of ownership, while NPS measures long-term loyalty across the full ownership experience, including service and support. A brand can lead on quality and still lag on loyalty.