Customer journey analytics tools help organizations track, analyze, and optimize how customers move across touchpoints such as websites, mobile apps, call centers, and in-store visits. In the USA, where customers often interact across multiple digital and physical channels before making a decision, these tools provide the visibility needed to reduce friction and improve retention.
In this blog, we’ll explain what customer journey analytics tools mean, how they work, and how to choose the right one without overcomplicating your tech stack.
What Do Customer Journey Analytics Tools Mean?
Customer journey analytics tools are software platforms that collect and connect customer interaction data across channels to show the full customer lifecycle.
Instead of analyzing isolated sessions, they answer questions like:
- Where do customers drop off?
- Which touchpoints influence purchase?
- What sequence leads to churn?
- How does experience feedback connect to behavior?
They combine behavioral data, such as clicks and transactions, with operational data like CRM updates and support interactions.
If you want a broader explanation of the framework, read this complete guide to customer journey analytics, which covers the strategic foundation behind these tools.
How Do Customer Journey Analytics Tools Work?
Customer journey analytics tools work by unifying data from multiple systems into a centralized analysis layer. Instead of analyzing isolated interactions, they reconstruct the full lifecycle of a customer across channels and time.
Here is the simplified process:
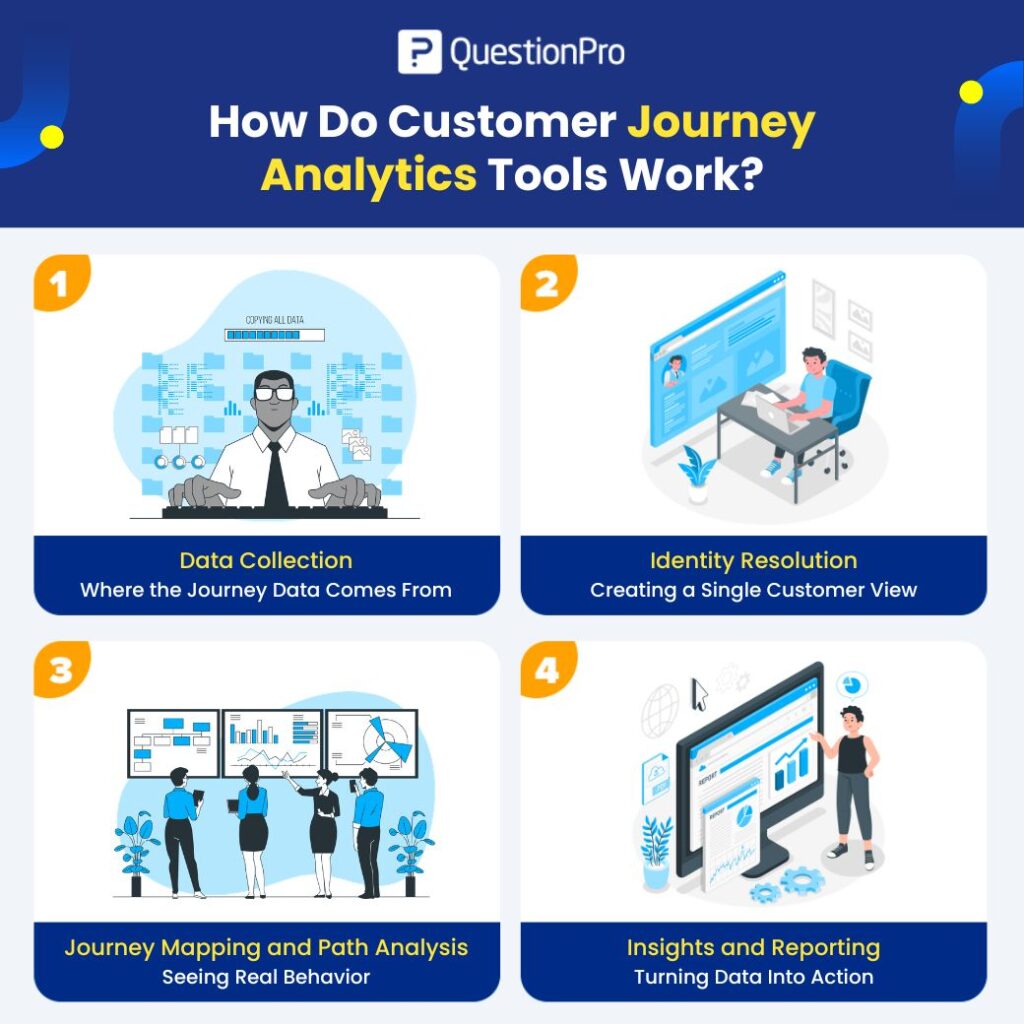
1. Data Collection: Where the Journey Data Comes From
Data collection is the foundation of customer journey analytics. The platform connects to multiple systems and continuously ingests interaction data.
Common sources include:
- Websites and mobile apps for page views, clicks, sessions, product interactions, and transactions
- CRM systems for contact records, lifecycle stages, and sales updates
- Marketing automation platforms for email opens, campaign engagement, and ad interactions
- Call centers and support tools for tickets, complaints, and service history
- Survey platforms for customer satisfaction scores, NPS, and open-ended feedback
- E-commerce systems for cart behavior, checkout steps, refunds, and repeat purchases
In mature US organizations, this often includes both online and offline signals, such as in-store purchases or event attendance.
The key requirement at this stage is consistency. Events must be standardized so that a “purchase” or “lead” means the same thing across systems.
2. Identity Resolution: Creating a Single Customer View
Identity resolution is the process of stitching interactions from different devices and channels into one customer profile.
This is where fragmented sessions become a unified journey.
For example:
- A user browses products on mobile.
- Later logs in on the desktop.
- Then calls customer support.
- Finally completes a purchase in-store.
Without identity resolution, journeys remain fragmented into separate sessions. With identity stitching, they become one continuous journey.
In US markets, identity stitching must also align with privacy regulations such as CCPA, meaning consent and data handling rules must be built into the system.
This step is critical. If identity resolution is weak, attribution models and retention analysis lose accuracy.
3. Journey Mapping and Path Analysis: Seeing Real Behavior
Once customer profiles are unified, the platform reconstructs actual paths.
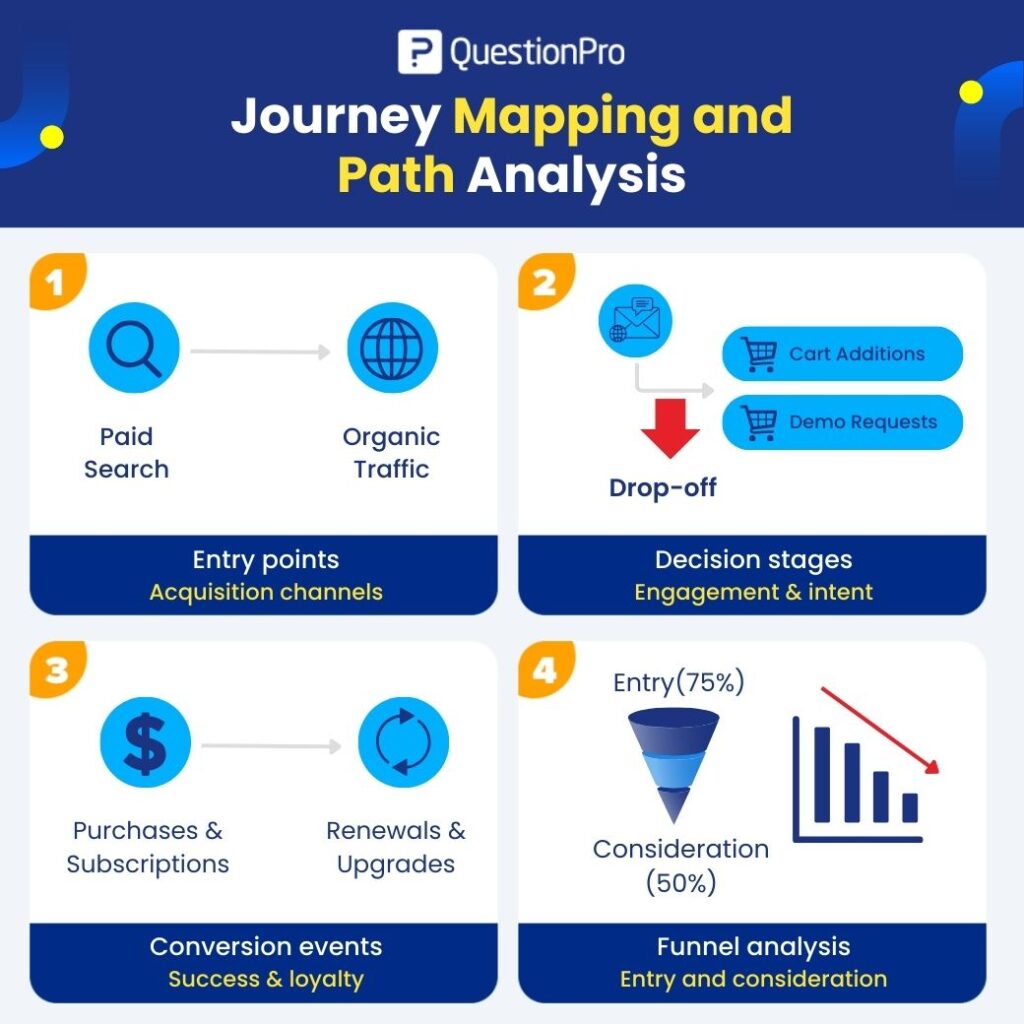
This includes:
- Entry points such as paid search, organic traffic, referrals, or email campaigns
- Decision stages like product comparison, demo requests, or cart additions
- Drop-offs where users abandon the journey
- Conversion events such as purchases, subscriptions, renewals, or upgrades
Path analysis shows the most common sequences. Funnel analysis highlights where conversion rates decline.
For example:
- 10,000 visitors start on a landing page
- 4,000 view product details
- 1,200 add to cart
- 600 complete purchase
The system highlights where friction increases and which steps correlate with higher completion rates.
This stage turns raw data into structured behavioral insight.
4. Insights and Reporting: Turning Data Into Action
The final stage translates analysis into usable dashboards and reports.
Dashboards typically show:
- Funnel performance across stages
- Cohort behavior comparing users by acquisition date or channel
- Retention curves tracking repeat engagement over time
- Attribution results measuring channel contribution
Advanced platforms go further by applying predictive analytics.
Predictive analytics uses historical behavior patterns to forecast future outcomes, such as:
- Churn risk
- Upsell probability
- High-value customer likelihood
- Next-best action suggestions
For example, if churned customers historically reduced login frequency before canceling, the system can flag similar active users as high risk.
Reporting is most effective when it is actionable. The goal is not more charts, but clearer decisions about marketing spend, UX changes, and customer experience improvements.
Together, these four stages transform disconnected touchpoints into measurable, continuous customer journeys.
Why Are Customer Journey Analytics Tools Important in the USA?
US consumers often switch devices multiple times before purchasing. According to the Pew Research Center, over 90 percent of Americans use the internet regularly, and mobile usage continues to dominate daily digital activity.
This multi-device behavior makes simple web analytics insufficient.
For US-based businesses, especially in retail, SaaS, financial services, and healthcare, customer journey analytics tools provide:
- Visibility across state-specific markets
- Compliance alignment with regulations such as CCPA
- Insights into omnichannel behavior
- Stronger attribution across paid media channels
Without unified analytics, marketing and CX teams operate in silos.
What Features Should You Look for in Customer Journey Analytics Tools?
When evaluating customer journey software, focus on functionality rather than brand recognition. A recognizable logo does not guarantee clean integrations, accurate attribution, or usable dashboards. The real test is whether the platform can handle your data complexity and produce insights that teams can act on.
Below are the features that matter most:
- Cross-channel data integration
The tool should connect marketing, sales, product, and service systems.
- Real-time or near real-time analytics
Faster reporting enables quicker intervention when drop-offs spike.
- Attribution modeling
Multi-touch attribution helps measure which channels drive conversions.
- Journey visualization
Clear path and funnel views help non-technical teams understand insights quickly.
- Experience data integration
Strong platforms combine behavioral signals with Voice of Customer feedback.
- Data privacy controls
In the USA, compliance with CCPA and industry-specific regulations is critical.
Choosing customer journey analytics tools is less about choosing the most popular vendor and more about selecting a platform that integrates cleanly, reports quickly, protects data properly, and connects behavioral insights with customer sentiment. Those capabilities determine whether the tool drives operational change or becomes another reporting dashboard.
Difference Between Journey Mapping Software and Journey Analytics Platforms
This confusion is common because both tools use the word “journey,” but they serve different purposes.
The difference comes down to design versus measurement.
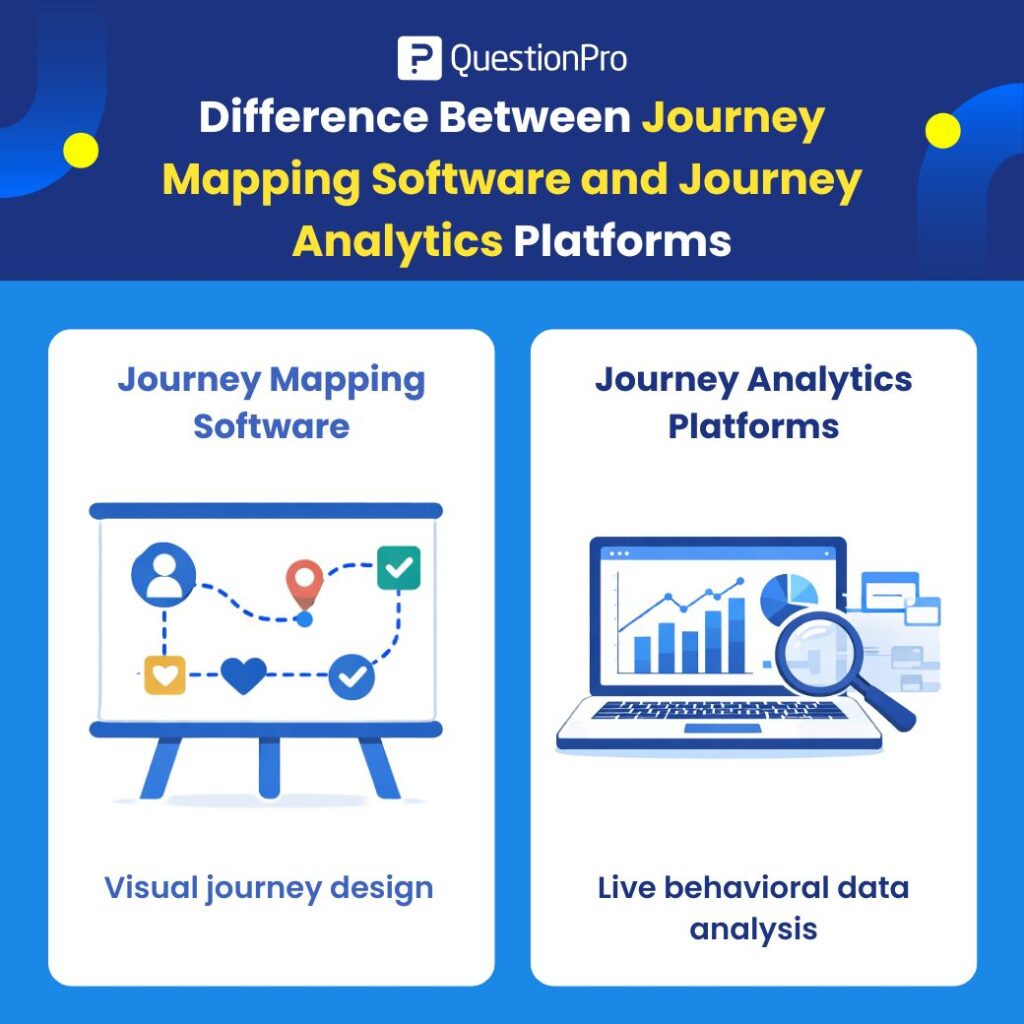
Journey mapping software focuses on visual journey design. It is typically used to:
- Map out customer personas
- Identify touchpoints across stages
- Document emotions and pain points
- Facilitate workshops with marketing or CX teams
These tools are valuable during strategy sessions. They represent what businesses believe the journey looks like, not necessarily what customers are actually doing.
Customer journey analytics platforms analyze live behavioral data. Instead of relying on assumptions, they:
- Track real interactions across channels
- Continuously update journey performance
- Measure drop-offs and conversion rates
- Connect behavior to outcomes like revenue or churn
These platforms use data from websites, CRM systems, apps, and support channels to reconstruct actual paths.
Because the data updates automatically, the journey evolves in real time. If conversion rates decline in a specific state in the USA or a new friction point appears in checkout, the system reflects it immediately.
Many organizations start with static maps to clarify strategy and internal alignment. As digital complexity increases, they adopt analytics platforms to validate and refine those maps with real data.
Are Customer Journey Analytics Tools Replacing Traditional Analytics?
Customer journey analytics tools are not replacing traditional analytics. They are extending them.
Traditional platforms such as Google Analytics focus on session-based metrics. They measure traffic, page views, bounce rates, and conversions within individual visits. That data is essential for understanding channel performance and website behavior.
Customer journey platforms take a different approach. They focus on lifecycle-based behavior. Instead of analyzing isolated sessions, they track how a customer moves across touchpoints over time, across devices, and across departments. They connect marketing engagement, product usage, support interactions, and feedback into a continuous view.
Frequently Asked Questions (FAQs)
Answer: The main purpose of customer journey analytics tools is to unify cross-channel data into a single customer lifecycle view. They help organizations identify friction points, improve retention, optimize marketing performance, and understand how customers move from first interaction to long-term engagement.
Answer: No. While large enterprises were early adopters, mid-market US companies increasingly use customer journey analytics tools to compete in digital-first markets. Cloud-based platforms now make advanced journey tracking accessible without massive IT infrastructure.
Answer: Most customer journey analytics tools require some analytics oversight, especially during implementation. However, many modern platforms offer user-friendly dashboards designed for marketing, product, and CX teams. Technical expertise is helpful, but daily usage does not always require a full data science team.
Answer: Implementation can take anywhere from a few weeks for mid-sized companies to several months for large enterprises with complex integrations.
Answer: Yes. Many customer journey analytics tools include features that support compliance with US regulations such as the California Consumer Privacy Act (CCPA). These features may include consent tracking, data anonymization, role-based access controls, and secure data storage. However, compliance also depends on how the organization configures and governs the system.