• Skip to main content
  • Skip to primary sidebar
  • Skip to footer
QuestionPro

QuestionPro

questionpro logo
  • Products
    survey software iconSurvey softwareEasy to use and accessible for everyone. Design, send and analyze online surveys.research edition iconResearch SuiteA suite of enterprise-grade research tools for market research professionals.CX iconCustomer ExperienceExperiences change the world. Deliver the best with our CX management software.WF iconEmployee ExperienceCreate the best employee experience and act on real-time data from end to end.
  • Solutions
    IndustriesGamingAutomotiveSports and eventsEducationGovernment
    Travel & HospitalityFinancial ServicesHealthcareCannabisTechnology
    Use CaseAskWhyCommunitiesAudienceContactless surveysMobile
    LivePollsMember ExperienceGDPRPositive People Science360 Feedback Surveys
  • Resources
    BlogeBooksSurvey TemplatesCase StudiesTrainingHelp center
  • Features
  • Pricing
Language
  • English
  • Español (Spanish)
  • Português (Portuguese (Brazil))
  • Nederlands (Dutch)
  • العربية (Arabic)
  • Français (French)
  • Italiano (Italian)
  • 日本語 (Japanese)
  • Türkçe (Turkish)
  • Svenska (Swedish)
  • Hebrew IL (Hebrew)
  • ไทย (Thai)
  • Deutsch (German)
  • Portuguese de Portugal (Portuguese (Portugal))
  • Español / España (Spanish / Spain)
Call Us
+1 800 531 0228 +1 (647) 956-1242 +55 9448 6154 +49 030 9173 9255 +44 01344 921310 +81-3-6869-1954 +61 (02) 6190 6592 +971 529 852 540
Log In Log In
SIGN UP FREE

Home Market Research

Question Stacks in QuestionPro BI for a shared view of related ratings

question-stacks

A service survey may ask customers to rate helpfulness and clarity separately. Both questions matter, but the team may also need one view of how those Support satisfaction add up.

Building that view in a spreadsheet means deciding which questions belong together, aligning their answer scales, and repeating the work whenever the definition changes.

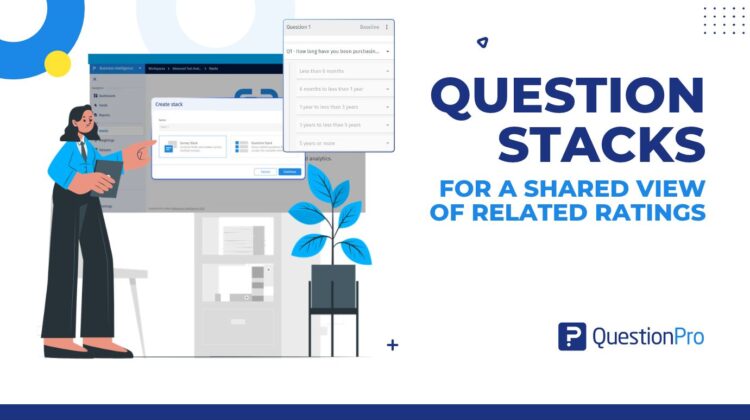
Question Stacks bring this workflow into QuestionPro BI. Group compatible questions from one survey, review their answer mappings, and use the saved metric group in a dashboard chart.

Why related ratings need a common scale

A combined result is useful only when its answers mean the same thing. A low rating for Helpfulness should align with the corresponding low rating for Clarity, even when someone reviews or adjusts the mapping later.

A question stack makes that definition visible. The first question provides the baseline answer scale, while later questions map their answers to it. This adds a reusable definition to the survey dashboard workflow.

Create a reusable metric group

Each question stack uses a single survey. Within it, named metric groups organize the related questions you want to report together.

For example, a Support experience stack could contain a Support satisfaction group with helpfulness and clarity. Choose questions because they belong in the same measure, then confirm that their types and answer scales are compatible.

How to create a question stack

  • Open Stacks in your BI workspace and select New stack.
  • Name the stack, choose Question Stack, and continue.
  • Select Add your questions and choose the source survey.
  • Name the metric group and select two to twenty compatible questions.
  • Save the group, expand its mappings, and review each answer against the baseline.
  • Save the stack, then select its metric group when adding a question-based widget.

Matching answer labels are populated automatically. Review them before saving, and use the later question columns to correct a match when needed. Each answer must be mapped once to the common scale.

Use the pooled result in your dashboard

In a dashboard, select Add widget, choose Question based, switch the source selector to Stacks, and choose Question stacks. Select your stack and metric group, name the chart, and add a Bar, Pie or Tabular widget.

The resulting distribution combines the mapped item answers. A Tabular view makes the category counts easy to inspect, while a Bar chart helps colleagues compare the spread across ratings.

If you enable Widget stats in Analytics settings, the summary includes the pooled mean. Keep its interpretation clear: the measure summarizes item answers, and one person may contribute an answer to each selected question. Response count shows respondents.

A Support experience example

Imagine a service team reviewing a survey with comparable five-point helpfulness and clarity ratings. Individual charts help the team examine each part of the experience, while a pooled Support satisfaction group gives it a combined view on the same answer scale.

The analyst chooses Helpfulness as the baseline, checks the Clarity mappings, and saves the group. The team can then use the same definition in its dashboard instead of rebuilding the combination for every chart.

The combined result can support a broader BI reporting dashboard, alongside the individual measures that explain it. A pooled view should complement the questions that help the team understand where ratings differ.

Keep the definition consistent as reporting evolves

A saved metric group becomes a shared input to its widgets. When you change an answer mapping and save the stack, refresh the dependent widgets and review the resulting values.

Question Stacks serve a specific need within BI. They combine related questions within a survey. For other data preparation needs, BI datasets provide a separate workflow.

Bring related answers into a clear reporting view

Related questions tell a fuller story together. With Question Stacks, that story becomes part of your dashboard, giving your team a clearer starting point for what comes next.


Create memorable experiences based on real-time data, insights and advanced analysis. Request Demo

SHARE THIS ARTICLE:

About the author
Prabal Gupta

View all posts by Prabal Gupta

Primary Sidebar

Research what's on your mind. Find out what's on theirs!

A suite of tools to leverage research and transform insights.

Discover our insight platform

RELATED ARTICLES

HubSpot - QuestionPro Integration

Free vs. Paid Survey Tools for Nonprofits: What You Actually Get

Jul 09,2026

HubSpot - QuestionPro Integration

Participant Bias: What it is, Types & How to Remove it?

Jan 24,2024

HubSpot - QuestionPro Integration

The Engine of Change: Action + Accountability | Tuesday CX Thoughts

Apr 20,2026

BROWSE BY CATEGORY

Footer

MORE LIKE THIS

question-stacks

Question Stacks in QuestionPro BI for a shared view of related ratings

Nov 11, 2026

QuestionPro CX- AI widget

Beyond Dashboards: How Conversational AI Is Transforming Customer Experience Analytics

Nov 9, 2026

shared-workspace-in-questionpro-audience

Shared workspace in QuestionPro Audience: Share projects with your team without giving up ownership

Nov 8, 2026

test-survey-logic

Test survey logic without the click-through marathon: Meet the survey path simulator

Nov 5, 2026

Other categories

questionpro-logo-nw
Help center Live Chat SIGN UP FREE
  • Sample questions
  • Sample reports
  • Survey logic
  • Branding
  • Integrations
  • Professional services
  • Security
  • Survey Software
  • Customer Experience
  • Workforce
  • Communities
  • Audience
  • Polls Explore the QuestionPro Poll Software - The World's leading Online Poll Maker & Creator. Create online polls, distribute them using email and multiple other options and start analyzing poll results.
  • Research Edition
  • LivePolls
  • InsightsHub
  • Blog
  • Articles
  • eBooks
  • Survey Templates
  • Case Studies
  • Training
  • Webinars
  • All Plans
  • Nonprofit
  • Academic
  • Qualtrics Alternative Explore the list of features that QuestionPro has compared to Qualtrics and learn how you can get more, for less.
  • SurveyMonkey Alternative
  • VisionCritical Alternative
  • Medallia Alternative
  • Likert Scale Complete Likert Scale Questions, Examples and Surveys for 5, 7 and 9 point scales. Learn everything about Likert Scale with corresponding example for each question and survey demonstrations.
  • Conjoint Analysis
  • Net Promoter Score (NPS) Learn everything about Net Promoter Score (NPS) and the Net Promoter Question. Get a clear view on the universal Net Promoter Score Formula, how to undertake Net Promoter Score Calculation followed by a simple Net Promoter Score Example.
  • Offline Surveys
  • Customer Satisfaction Surveys
  • Employee Survey Software Employee survey software & tool to create, send and analyze employee surveys. Get real-time analysis for employee satisfaction, engagement, work culture and map your employee experience from onboarding to exit!
  • Market Research Survey Software Real-time, automated and advanced market research survey software & tool to create surveys, collect data and analyze results for actionable market insights.
  • GDPR & EU Compliance
  • Employee Experience
  • Customer Journey
  • Synthetic Data
  • About us
  • Executive Team
  • In the news
  • Testimonials
  • Advisory Board
  • Careers
  • Brand
  • Media Kit
  • Contact Us

QuestionPro in your language

  • English
  • Español (Spanish)
  • Português (Portuguese (Brazil))
  • Nederlands (Dutch)
  • العربية (Arabic)
  • Français (French)
  • Italiano (Italian)
  • 日本語 (Japanese)
  • Türkçe (Turkish)
  • Svenska (Swedish)
  • Hebrew IL (Hebrew)
  • ไทย (Thai)
  • Deutsch (German)
  • Portuguese de Portugal (Portuguese (Portugal))
  • Español / España (Spanish / Spain)

Awards & certificates

  • survey-leader-asia-leader-2023
  • survey-leader-asiapacific-leader-2023
  • survey-leader-enterprise-leader-2023
  • survey-leader-europe-leader-2023
  • survey-leader-latinamerica-leader-2023
  • survey-leader-leader-2023
  • survey-leader-middleeast-leader-2023
  • survey-leader-mid-market-leader-2023
  • survey-leader-small-business-leader-2023
  • survey-leader-unitedkingdom-leader-2023
  • survey-momentumleader-leader-2023
  • bbb-acredited
The Experience Journal

Find innovative ideas about Experience Management from the experts

  • © 2022 QuestionPro Survey Software | +1 (800) 531 0228
  • Sitemap
  • Privacy Statement
  • Terms of Use

