• Skip to main content
  • Skip to primary sidebar
  • Skip to footer
QuestionPro

QuestionPro

questionpro logo
  • Products
    survey software iconSurvey softwareEasy to use and accessible for everyone. Design, send and analyze online surveys.research edition iconResearch SuiteA suite of enterprise-grade research tools for market research professionals.CX iconCustomer ExperienceExperiences change the world. Deliver the best with our CX management software.WF iconEmployee ExperienceCreate the best employee experience and act on real-time data from end to end.
  • Solutions
    IndustriesGamingAutomotiveSports and eventsEducationGovernment
    Travel & HospitalityFinancial ServicesHealthcareCannabisTechnology
    Use CaseAskWhyCommunitiesAudienceContactless surveysMobile
    LivePollsMember ExperienceGDPRPositive People Science360 Feedback Surveys
  • Resources
    BlogeBooksSurvey TemplatesCase StudiesTrainingHelp center
  • Features
  • Pricing
Language
  • English
  • Español (Spanish)
  • Português (Portuguese (Brazil))
  • Nederlands (Dutch)
  • العربية (Arabic)
  • Français (French)
  • Italiano (Italian)
  • 日本語 (Japanese)
  • Türkçe (Turkish)
  • Svenska (Swedish)
  • Hebrew IL (Hebrew)
  • ไทย (Thai)
  • Deutsch (German)
  • Portuguese de Portugal (Portuguese (Portugal))
Call Us
+1 800 531 0228 +1 (647) 956-1242 +52 999 402 4079 +49 301 663 5782 +44 20 3650 3166 +81-3-6869-1954 +61 2 8074 5080 +971 529 852 540
Log In Log In
SIGN UP FREE

Home CX Consumer Insights

A picture is worth a thousand words…

Used with permission from Adam Frost (twitter: @adamfrostuk)

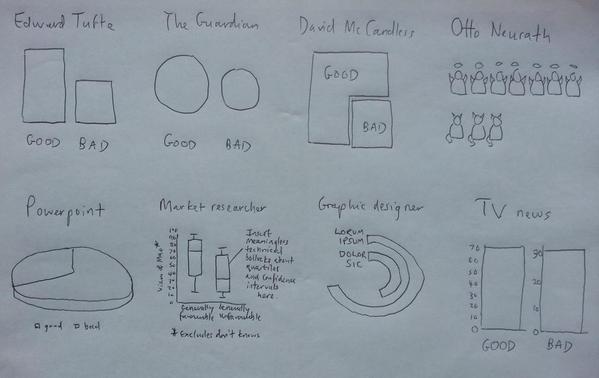
Each chart represents one simple piece of data. Any guesses what that data might be?

Data visualization: don’t overcomplicate

Here is what each chart was portraying: “Mao was ‘70% good, 30% bad’ according to the Chinese government.”

It seems that in every profession, we can get mired in a certain way of doing things, including visualizing data. And the type of visualization can either make sense, confuse, or even seemingly distort the data being presented.

In this era of focusing on data visualization, I’d like to issue a word of caution. Yes, we’ve heard that pie charts are overused. However, it doesn’t mean that we always need to find a super-fancy-schmancy way to represent simple pieces of data. We can go too far in trying to find an interesting, eye-catching, novel way to represent data that we end up losing focus on being able to actually tell the right story with the appropriate supporting visuals.

Quick tips to choose the right visual

As with everything else, choosing the right visual to represent your data may depend on your audience. One audience might respond well to a pie chart showing how much time each department is using from a vendor; another audience might get stuck on that pie chart and end up arguing about who is using too much time versus who is using too little time, leading to a need to represent the data with a different chart to bring the focus back on how many requests are coming in from each department (true story).

It should also depend on the data being represented. Are you trying to show increases in satisfaction? Perhaps a simple line chart of satisfaction trended over time would do. Are you trying to show hours spent on a particular project? Perhaps a stacked bar chart would be better, especially if you want to highlight where the most hours went for the project.

Which brings me to the third dependency: the story you want to tell with the chart. And this is where data visualization can end up trying too hard to tell the story in a way that will capture the viewers’ attention. Just remember that, often, simpler is better.

Because, after all, sometimes, a simple bar chart is really all you need.

SHARE THIS ARTICLE:

About the author
Zontziry (Z) Johnson

View all posts by Zontziry (Z) Johnson

Primary Sidebar

Research what's on your mind. Find out what's on theirs!

A suite of tools to leverage research and transform insights.

Discover our insight platform

RELATED ARTICLES

HubSpot - QuestionPro Integration

Healthcare experience: What it is + Free Tips

May 27,2022

HubSpot - QuestionPro Integration

10 Best Free Poll Everywhere Alternatives of All Time

Aug 19,2022

HubSpot - QuestionPro Integration

Frontline Understanding of the Journey — Tuesday CX Thoughts

Feb 06,2024

BROWSE BY CATEGORY

  • Academic
  • Academic Research
  • Artificial Intelligence
  • Assessments
  • Audience
  • Brand Awareness
  • Business
  • Case Studies
  • Communities
  • Consumer Insights
  • Customer effort score
  • Customer Engagement
  • Customer Experience
  • Customer Loyalty
  • Customer Research
  • Customer Satisfaction
  • CX
  • Employee Benefits
  • Employee Engagement
  • Employee Engagement
  • Employee Retention
  • Enterprise
  • Events
  • Forms
  • Friday Five
  • General Data Protection Regulation
  • Guest Post
  • Insights Hub
  • Life@QuestionPro
  • LivePolls
  • Market Research
  • Marketing
  • Mobile
  • Mobile App
  • Mobile diaries
  • Mobile Surveys
  • New Features
  • non-profit
  • NPS
  • Online Communities
  • Polls
  • Question Types
  • Questionnaire
  • QuestionPro
  • QuestionPro Products
  • Release Notes
  • Research Tools and Apps
  • Revenue at Risk
  • Startups
  • Survey Templates
  • Surveys
  • Tech News
  • Tips
  • Training
  • Training Tips
  • Trending
  • Tuesday CX Thoughts (TCXT)
  • Uncategorized
  • VOC
  • Webinar
  • Webinars
  • What’s Coming Up
  • Workforce
  • Workforce Intelligence

Footer

MORE LIKE THIS

Medtech Market Research

MedTech Market Research: Fueling Innovation in 2025

May 8, 2025

customer-retention-strategies

15 Top Customer Retention Strategies to Boost Loyalty in 2025

May 8, 2025

the-home-depot-nps-2025

The Home Depot NPS & Customer Satisfaction 2025

May 7, 2025

panel-research-companies

Top 8 Panel Research Companies for Quality Research in 2025

May 6, 2025

Other categories

  • Academic
  • Academic Research
  • Artificial Intelligence
  • Assessments
  • Audience
  • Brand Awareness
  • Business
  • Case Studies
  • Communities
  • Consumer Insights
  • Customer effort score
  • Customer Engagement
  • Customer Experience
  • Customer Loyalty
  • Customer Research
  • Customer Satisfaction
  • CX
  • Employee Benefits
  • Employee Engagement
  • Employee Engagement
  • Employee Retention
  • Enterprise
  • Events
  • Forms
  • Friday Five
  • General Data Protection Regulation
  • Guest Post
  • Insights Hub
  • Life@QuestionPro
  • LivePolls
  • Market Research
  • Marketing
  • Mobile
  • Mobile App
  • Mobile diaries
  • Mobile Surveys
  • New Features
  • non-profit
  • NPS
  • Online Communities
  • Polls
  • Question Types
  • Questionnaire
  • QuestionPro
  • QuestionPro Products
  • Release Notes
  • Research Tools and Apps
  • Revenue at Risk
  • Startups
  • Survey Templates
  • Surveys
  • Tech News
  • Tips
  • Training
  • Training Tips
  • Trending
  • Tuesday CX Thoughts (TCXT)
  • Uncategorized
  • VOC
  • Webinar
  • Webinars
  • What’s Coming Up
  • Workforce
  • Workforce Intelligence

questionpro-logo-nw
Help center Live Chat SIGN UP FREE
  • Sample questions
  • Sample reports
  • Survey logic
  • Branding
  • Integrations
  • Professional services
  • Security
  • Survey Software
  • Customer Experience
  • Workforce
  • Communities
  • Audience
  • Polls Explore the QuestionPro Poll Software - The World's leading Online Poll Maker & Creator. Create online polls, distribute them using email and multiple other options and start analyzing poll results.
  • Research Edition
  • LivePolls
  • InsightsHub
  • Blog
  • Articles
  • eBooks
  • Survey Templates
  • Case Studies
  • Training
  • Webinars
  • All Plans
  • Nonprofit
  • Academic
  • Qualtrics Alternative Explore the list of features that QuestionPro has compared to Qualtrics and learn how you can get more, for less.
  • SurveyMonkey Alternative
  • VisionCritical Alternative
  • Medallia Alternative
  • Likert Scale Complete Likert Scale Questions, Examples and Surveys for 5, 7 and 9 point scales. Learn everything about Likert Scale with corresponding example for each question and survey demonstrations.
  • Conjoint Analysis
  • Net Promoter Score (NPS) Learn everything about Net Promoter Score (NPS) and the Net Promoter Question. Get a clear view on the universal Net Promoter Score Formula, how to undertake Net Promoter Score Calculation followed by a simple Net Promoter Score Example.
  • Offline Surveys
  • Customer Satisfaction Surveys
  • Employee Survey Software Employee survey software & tool to create, send and analyze employee surveys. Get real-time analysis for employee satisfaction, engagement, work culture and map your employee experience from onboarding to exit!
  • Market Research Survey Software Real-time, automated and advanced market research survey software & tool to create surveys, collect data and analyze results for actionable market insights.
  • GDPR & EU Compliance
  • Employee Experience
  • Customer Journey
  • Synthetic Data
  • About us
  • Executive Team
  • In the news
  • Testimonials
  • Advisory Board
  • Careers
  • Brand
  • Media Kit
  • Contact Us

QuestionPro in your language

  • English
  • Español (Spanish)
  • Português (Portuguese (Brazil))
  • Nederlands (Dutch)
  • العربية (Arabic)
  • Français (French)
  • Italiano (Italian)
  • 日本語 (Japanese)
  • Türkçe (Turkish)
  • Svenska (Swedish)
  • Hebrew IL (Hebrew)
  • ไทย (Thai)
  • Deutsch (German)
  • Portuguese de Portugal (Portuguese (Portugal))

Awards & certificates

  • survey-leader-asia-leader-2023
  • survey-leader-asiapacific-leader-2023
  • survey-leader-enterprise-leader-2023
  • survey-leader-europe-leader-2023
  • survey-leader-latinamerica-leader-2023
  • survey-leader-leader-2023
  • survey-leader-middleeast-leader-2023
  • survey-leader-mid-market-leader-2023
  • survey-leader-small-business-leader-2023
  • survey-leader-unitedkingdom-leader-2023
  • survey-momentumleader-leader-2023
  • bbb-acredited
The Experience Journal

Find innovative ideas about Experience Management from the experts

  • © 2022 QuestionPro Survey Software | +1 (800) 531 0228
  • Sitemap
  • Privacy Statement
  • Terms of Use