



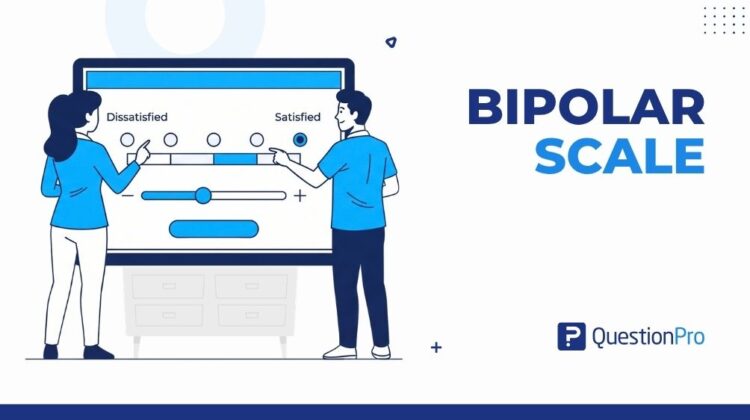
A bipolar scale is one of the oldest tools in survey design, and it still shows up in customer, employee, and market research today. It asks people to place their opinion somewhere between two opposite ideas, such as satisfied and dissatisfied.
Getting a bipolar scale wrong is easy. Too few points flatten real opinions. Too many points confuse respondents. Get it right, and you capture both direction and intensity of an attitude in a single question.
This guide covers what a bipolar scale is, how it differs from similar formats, real examples, common mistakes, and how to build one in QuestionPro.
What is a bipolar scale?
A bipolar scale is a survey rating scale that measures an attitude between two opposite endpoints, such as Happy and Sad or Satisfied and Dissatisfied. Respondents pick a point between the poles that best reflects both the direction and strength of their opinion.
The word “bipolar” here refers only to the two poles of the scale. It has nothing to do with the clinical meaning of the term, which we cover later in this guide.
The simplest bipolar scale has just two options, such as True or False. This version recognizes no degrees between the extremes. Most respondents want more nuance than that, which is why a several-step scale is usually the better choice.
QuestionPro supports bipolar scaling as one of many survey question types, including radio, slider, and matrix formats.
Bipolar scale vs. unipolar scale vs. Likert scale
These three terms get mixed up often, and the confusion shows up in real survey design mistakes. Here is how they actually differ.
A Likert scale is the broad family of rating scales that measure agreement, satisfaction, or frequency. Both unipolar and bipolar formats fall under this umbrella when the Likert scale is used to capture attitudes.
A unipolar scale measures the presence or absence of a single quality, from none to a lot. A unipolar Likert scale never crosses into a negative or opposite quality.
| Scale type | What it measures | Example |
|---|---|---|
| Unipolar | One quality, from none to a lot | Not at all satisfied to Completely satisfied |
| Bipolar | Two opposite qualities on one continuum | Completely dissatisfied to Completely satisfied |
| Semantic differential | Attitude between two opposite adjectives | Boring to Exciting |
A close cousin of the bipolar scale is the semantic differential scale, which also uses opposite adjectives at each end but is typically applied to brand or product perception rather than agreement or satisfaction.
How to design a bipolar scale
A bipolar scale needs a few deliberate design choices before it goes into a live survey. Skipping these steps is the main reason bipolar scales produce messy or biased data.
Does the scale need a midpoint?
A midpoint gives respondents a neither, nor option. It matters when neutrality is a genuine possibility, such as measuring satisfaction. It matters less when you are directly comparing two named options, since forcing a choice can be the goal.
Leaving out a midpoint when neutrality is realistic tends to frustrate respondents and can raise survey drop-off.
Balanced or unbalanced?
A balanced bipolar scale has an equal number of positive and negative options on each side of the midpoint. An unbalanced, or unipolar-leaning, scale skews toward one side, often with only one negative option against several positive ones.
Balanced scales are the safer default. An unbalanced scale should only be used when you have a specific reason to expect responses to skew one way.
How many scale points?
The University of Waterloo’s Statistical Consulting and Survey Research Unit analyzed rating scale design and found that five points work best for unipolar scales, while bipolar scales hold up better with five to seven points.
Going beyond nine or ten points rarely adds useful precision. It mostly adds cognitive load, especially on a phone screen.
Words, numbers, or images?
Verbal labels are the most common anchor type, but they are not required. Bipolar scales can use color gradients, star ratings, or smiley faces to mark the two extremes, which can work well for shorter, mobile-first surveys.
Real-world examples of bipolar scale questions
Bipolar scales show up across nearly every research use case. A few examples make the format easier to picture.
- Customer experience: “How satisfied or dissatisfied are you with your recent purchase?” rated from Completely dissatisfied to Completely satisfied.
- QuestionPro Employee Experience: “How connected or disconnected do you feel to your team?” rated from Very disconnected to Very connected.
- Brand perception: “How would you describe this brand?” rated from Outdated to Modern.
- Product feedback: “How would you rate this feature?” rated from Extremely unhelpful to Extremely helpful.
- Market research: “Compared to five years ago, are you exercising more or less?” rated on a bipolar frequency scale.
Each of these questions captures direction and intensity in a single response, which is the main advantage a bipolar scale offers over a simple yes or no question.
Common mistakes to avoid with bipolar scales
Most bipolar scale problems trace back to a handful of avoidable errors. The table below maps each one to a quick fix.
| Mistake | Why it hurts your data | Quick fix |
|---|---|---|
| Too many scale points | Overwhelms respondents and adds noise, not precision | Stay within five to seven points |
| Unlabeled scale points | Respondents guess what a middle number means | Label every point, not just the ends |
| Mixing bipolar and unipolar formats | Makes cross-question comparison unreliable | Pick one format per construct and stay consistent |
| Accidentally unbalanced options | Quietly skews results toward one pole | Count positive and negative options before publishing |
| No midpoint on a neutral topic | Forces a false choice and raises drop-off | Add a neither, nor option when neutrality is realistic |
Testing the scale with a small group before full launch catches most of these issues early. A short pilot round, even with ten or twenty respondents, tends to surface confusing labels long before a full send does.
How to build a bipolar scale question in QuestionPro
QuestionPro includes a dedicated Bipolar Matrix question type built for this exact format. Setting one up takes a few steps.
- Add a new question and select the Multi-Point Scale matrix question type.
- Open the question settings and turn on the Bipolar option.
- Enter opposite terms for each end of the scale, such as Dissatisfied and Satisfied.
- Choose a scale length between three and eleven points, and pick a radio or slider answer format.
- Add row and column labels, then preview the question before publishing.
Reports for bipolar questions display the percentage of responses at each point, so you can see at a glance where opinion clusters on the scale. Cross-tabulating that report against a customer segment or tenure band often reveals whether one group is pulling the overall average toward either pole.
Once a bipolar scale is live, the same Survey Software account can pair it with customer satisfaction survey templates or employee feedback forms, so the scale fits into a broader measurement program rather than sitting on its own.
A well-built bipolar scale earns its place in a survey because it answers a real question about direction and strength, not because it looks familiar. Choosing the right number of points, labeling them clearly, and testing before launch will do more for data quality than any other single decision in the question.
Frequently Asked Questions (FAQs)
No. A bipolar scale measures opposite attitudes, such as satisfaction or agreement. A bipolar questionnaire in a clinical setting is a separate tool used to help assess bipolar disorder symptoms.
Yes. CSAT commonly uses a bipolar scale from very dissatisfied to very satisfied. NPS itself uses a single 0-to-10 likelihood scale, which is unipolar, though follow-up questions can use a bipolar format.
Both use two opposite anchors, but a semantic differential scale usually measures brand or product perception with adjective pairs like modern versus outdated, while a bipolar scale more often measures agreement or satisfaction.
Shorter bipolar scales, generally five points or fewer, work best on mobile screens. Long scales with many labeled points force extra scrolling and tapping, which can lower completion rates on phones compared to desktops, where more points are easier to scan.
Responses are typically coded numerically around a center point, such as -3 to 3, then averaged or compared across groups. This makes it possible to track shifts in sentiment over time or between segments.



