


Chevrolet NPS 2025 stands at 48, according to QuestionPro’s Q1 2025 benchmarking study. Net Promoter Score (NPS) is a loyalty metric that subtracts the percentage of detractors from the percentage of promoters, on a scale of -100 to 100. That puts Chevrolet seven points above the 41 automotive average.
Other sources report very different numbers, so context matters. In this blog, we’ll break down the score, compare it with rival automakers, explain why figures vary, and show how to measure NPS yourself.
What is Chevrolet’s NPS in 2025?
Chevrolet’s NPS is 48, based on a Q1 2025 survey of 1,000 U.S. consumers (QuestionPro). A positive score means promoters outnumber detractors.

NPS comes from one question: how likely are you to recommend this brand to a friend or family member, on a 0 to 10 scale? Answers fall into three groups:
- Promoters (9 to 10): Loyal owners who actively recommend the brand.
- Passives (7 to 8): Satisfied owners who could still switch.
- Detractors (0 to 6): Unhappy owners who may discourage others.
The formula is simple: NPS equals % promoters minus % detractors. The headline score is the figure to cite. Treat any Chevrolet-only promoter and detractor split with caution unless it names a source.
How does Chevrolet’s NPS compare with other automakers?
Chevrolet ranks third among five major brands in QuestionPro’s study. It sits behind Toyota and Honda and ahead of Ford and Nissan.
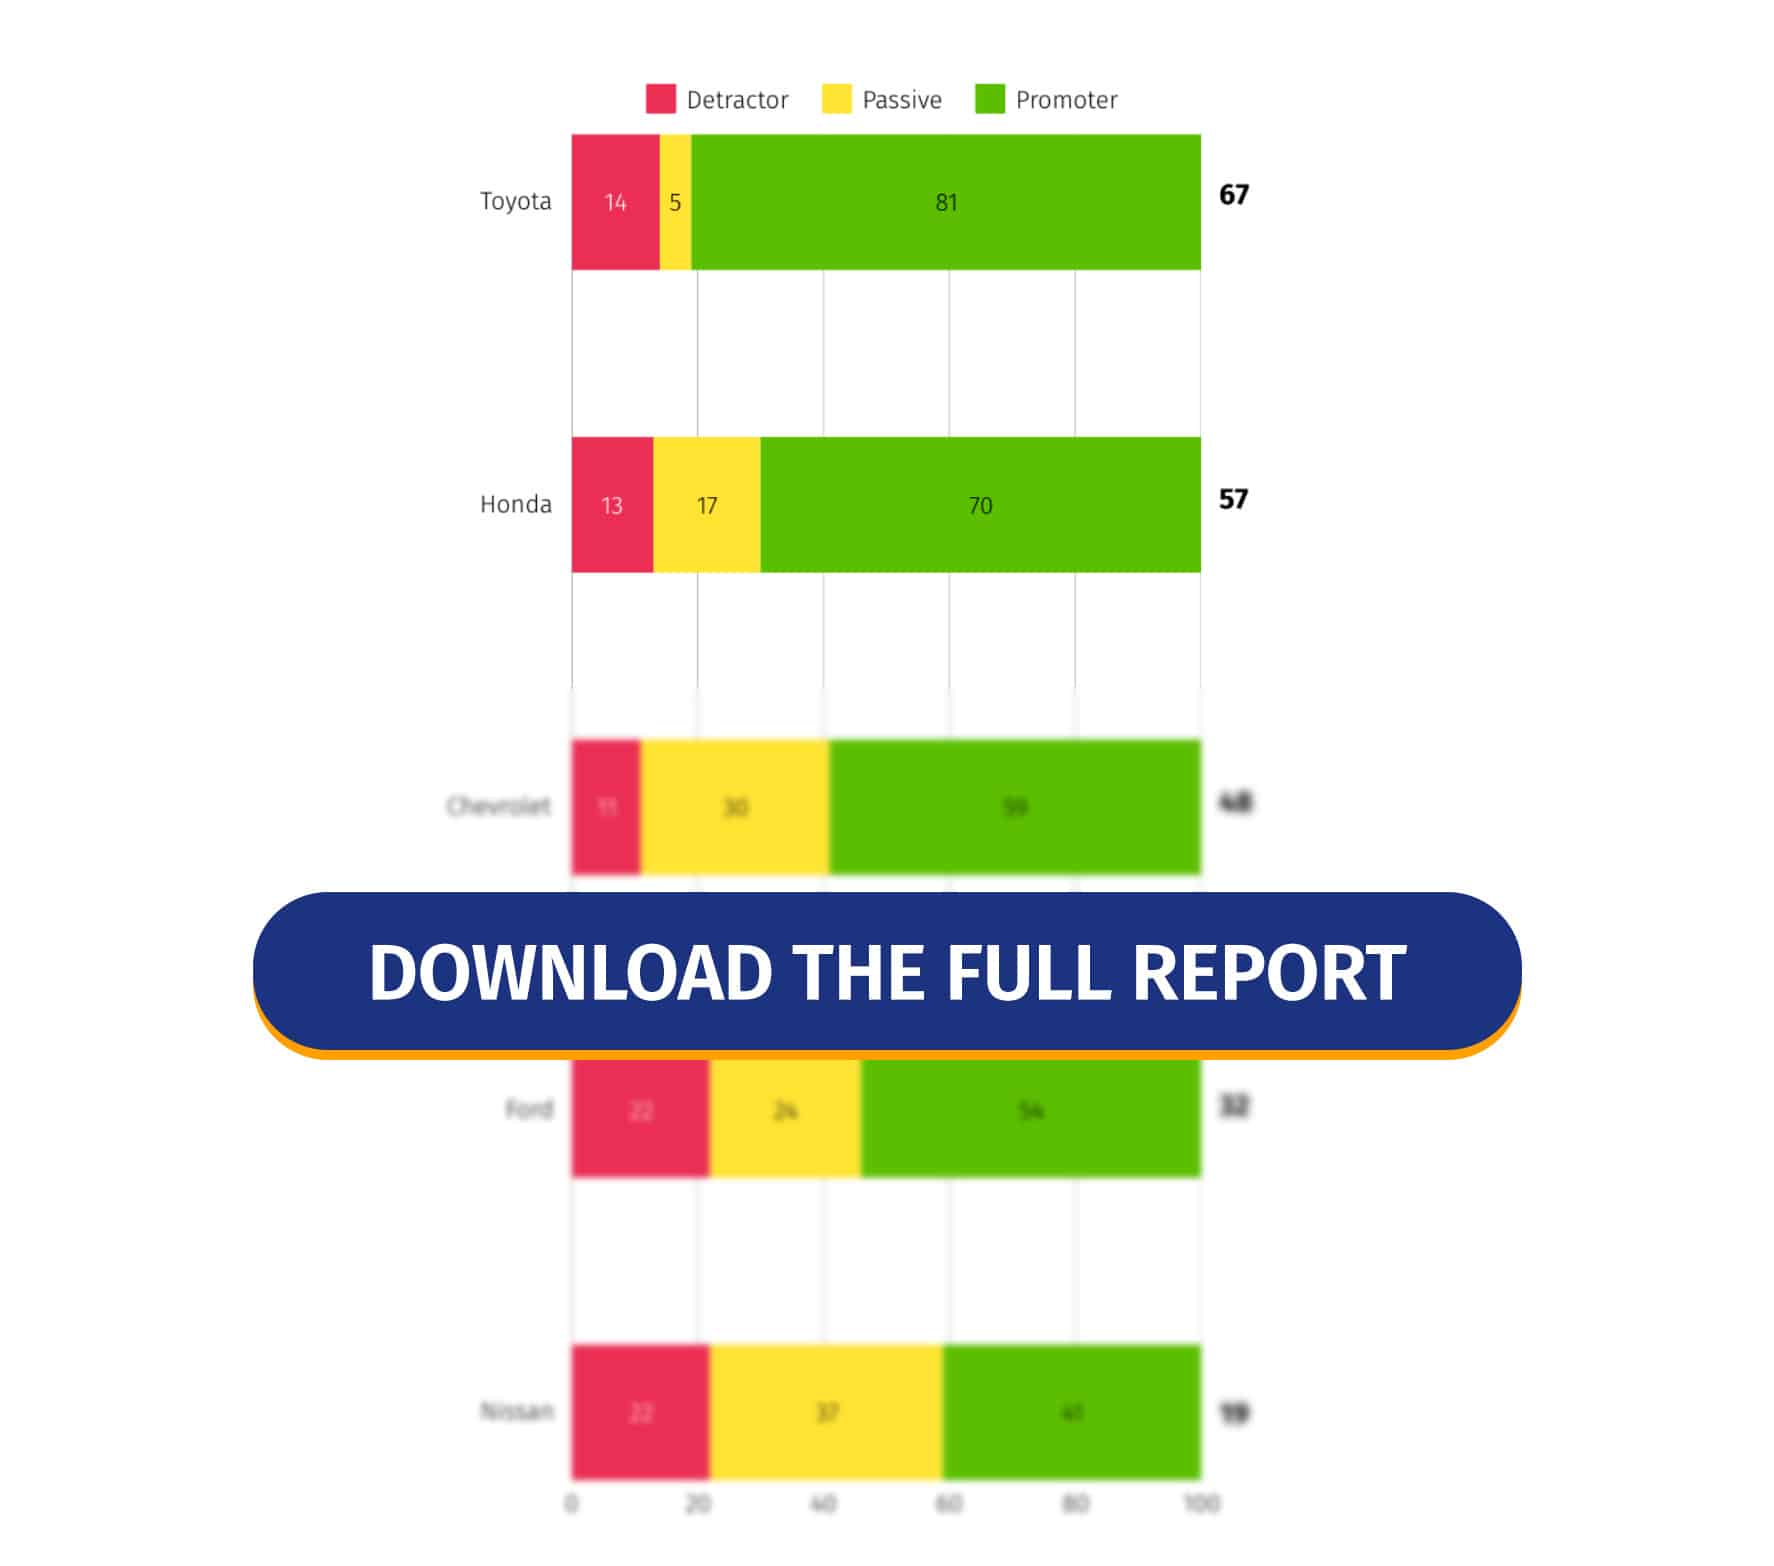
| Brand | NPS | Versus industry average (41) |
|---|---|---|
| Toyota | 67 | +26 |
| Honda | 57 | +16 |
| Chevrolet | 48 | +7 |
| Ford | 32 | -9 |
| Nissan | 19 | -22 |
Source: QuestionPro automotive NPS benchmarks, Q1 2025, 1,000 U.S. customers. Automotive is one sector among many, so check NPS benchmarks by industry before comparing across categories.
We invite you to download the full report. It’s a valuable resource for evaluating your company’s performance and determining your customers’ perceptions of you.
Why do Chevrolet NPS scores differ by source?
Chevrolet scores vary because each source measures something different. Sample, method, and time period all change the result, so NPS, satisfaction indexes, and quality counts are not interchangeable.
NPS surveys
Survey-based NPS asks about willingness to recommend. QuestionPro’s 48 comes from 1,000 U.S. consumers.
Satisfaction indexes
The American Customer Satisfaction Index (ACSI) is a 0 to 100 score built from customer surveys. In its 2026 automobile study, Chevrolet scored 75, down 5%. The industry average was 78 and Toyota led at 83. The study drew on 6,699 surveys collected from July 2025 to June 2026.
Initial quality studies
The J.D. Power U.S. Initial Quality Study counts problems per 100 vehicles (PP100) during the first 90 days of ownership. Lower is better. In 2026, Chevrolet scored 171 PP100 against an industry average of 175. It ranked ninth among mass-market brands, and the Blazer and Tahoe won segment awards. The study covered 78,514 owners.
Read these as three views of the same brand. None of them contradicts the others.
What drives Chevrolet customer loyalty, and what holds it back?
Chevrolet’s lead over Ford and Nissan likely comes from a broad lineup and perceived value. Recent satisfaction and quality data point to risks. The drivers below are interpretations, not survey findings.
What helps loyalty
- Wide lineup: Trucks, SUVs, EVs, and performance cars give owners a Chevrolet for each life stage.
- Perceived value: QuestionPro’s automotive benchmarks note that owners feel they get more for their money.
- Driver-assist technology: Super Cruise, GM’s hands-free highway driving system, sets some models apart.
- Dealer reach: A large U.S. dealer footprint keeps sales and service close to owners.
What holds it back
- Falling satisfaction: The ACSI score dropped 5% to 75 in 2026, below the 78 industry average.
- Mid-pack quality: Chevrolet ranked ninth among mass-market brands in the 2026 J.D. Power study.
- Uneven dealer experience: NPS is a brand score, but owners judge individual stores. One poor service visit can turn a passive into a detractor.
Step-by-step guide to measuring NPS for a car brand or dealership
You can measure NPS in five steps: ask the question, pick the moment, add a follow-up, calculate, and segment. The same steps work for a manufacturer, a dealer group, or a single store.
- Ask the core question.
“How likely are you to recommend this dealership to a friend or family member?” Use a ready-made NPS survey template to start fast. - Pick the moment.
Send a transactional survey within 24 hours of a sale or service visit. Send a relationship survey about 90 days after purchase. - Add an open-ended follow-up.
Ask “Why did you give that score?” An AskWhy question prompts respondents to explain their rating in their own words. - Calculate the score.
Take the industry split from QuestionPro’s automotive NPS study: 59% promoters, 23% passives, and 18% detractors. NPS equals 59 minus 18, or 41. - Segment and act.
Break results down by model, store, and region. Contact detractors quickly.
Track dealership feedback at scale
Dealer groups can run these surveys across many locations. QuestionPro’s Automotive Customer Experience solution is built for sales and service feedback, and general survey software covers one-off studies.
Which NPS benchmark should you compare against?
Compare against the benchmark that matches your scope. A single dealership should not measure itself against a national brand score.
| Your situation | Best comparison | Why |
|---|---|---|
| Automaker or national brand | Industry average (41) and direct rivals | Same customer base and sampling logic |
| Dealer group | Your own quarterly trend plus the brand average | Controls for local market differences |
| Single dealership | Your last four quarters, then peer stores | Small samples swing widely |
Common mistakes when reading Chevrolet NPS
The most common mistake is treating one NPS figure as a verdict. A score is a starting point for questions.
- Mixing sources.
Comparing a 48 from one study with a -24 from another compares different methods. - Ignoring sample size.
A store with 30 responses can swing by 20 points on a handful of replies. - Skipping passives.
Passives are the easiest group to move toward promoters. - Using one survey for everything.
A transactional survey tied to a specific visit shows what to fix. A brand-level score does not. - Reading a snapshot as a trend.
The 48 reflects Q1 2025. ACSI data shows satisfaction has moved since.
What Chevrolet’s score tells every brand
Chevrolet’s 48 shows that a broad lineup and fair pricing can earn loyalty. Its slipping 2026 satisfaction score shows how quickly that goodwill can erode.
Brands that track NPS every quarter, read the comments behind it, and fix detractor issues fast stay ahead. A platform such as QuestionPro Customer Experience makes that routine instead of occasional.
Want to know how leading Automobile brands earn loyalty and high NPS? Get the Q1 2025 NPS Benchmark Report to see how leading brands drive customer satisfaction and find strategies to keep their customers returning.
Want to increase your NPS? Contact the experts at QuestionPro for proper advice on measuring and improving customer satisfaction.
Frequently Asked Questions (FAQs)
Yes. A score of 48 is solid because it sits seven points above the 41 automotive average in QuestionPro’s Q1 2025 study. It still trails Toyota at 67 and Honda at 57, so Chevrolet has room to grow.
Send a transactional survey after every sale or service visit. Run a relationship survey once or twice a year. Report results quarterly, because small samples at a single store can swing widely from month to month.
NPS signals loyalty but does not guarantee repurchase. Pair it with a direct question about purchase intent, such as whether the owner would buy another Chevrolet, and compare answers by model and length of ownership.
NPS asks how likely a customer is to recommend the brand, which reflects long-term loyalty. Customer satisfaction score (CSAT) asks how satisfied they were with one experience, such as a service visit. Automakers usually track both.
Check ACSI’s automobile study each July and J.D. Power’s Initial Quality Study each June. Both publish brand-level Chevrolet results. NPS benchmark reports, such as QuestionPro’s quarterly study, add a loyalty view.



