A QR code survey turns any physical touchpoint into a feedback opportunity. Instead of asking someone to remember a link, you let them scan a code and land straight on your survey. For US businesses with in-person customers, that one scan can be the difference between a comment and silence.
QR code surveys work because they remove effort. A receipt, a table card, a product box, or an event screen can carry a direct path to feedback, and most phones scan a code without installing anything extra.
In this guide, we’ll cover how a QR code survey works, where to place one, how to measure what it collects, and where QuestionPro fits into that process.
What is a QR code survey?
A QR code survey is an online survey that opens automatically when someone scans a printed or displayed QR code with a smartphone camera. The code stores a link, and scanning it sends the respondent straight to the survey instead of a webpage they have to find on their own.
A QR code itself, short for Quick Response code, is a two-dimensional barcode that can hold a URL or other short data. In a survey context, that URL almost always points to a live, mobile-friendly survey page.
It helps to separate two things that sound similar. A QR code survey link is a code that opens an entire survey. A QR code question, by contrast, is a single question type inside a survey where the respondent scans something as their answer, such as scanning a product barcode. This guide focuses on the first kind, using a QR code to launch a survey.
QR codes for surveys commonly appear on:
- Receipts and checkout counters.
- Table tents and menus.
- Product packaging and inserts.
- Event signs, slides, and badges.
- Posters and flyers.
- Appointment cards and waiting room signage.
Placing a code on any of these turns a passive moment into a chance to collect feedback without extra staff effort. For businesses that serve people in person, this closes a gap that offline surveys are built to address.
How does a QR code survey work?
A QR code survey works by linking a scannable image to a live survey URL, so scanning the code and opening the survey happen in a single step. No app download is usually required.
The typical flow looks like this:
- Build the survey with short, mobile-ready questions.
- Generate a QR code from the survey’s live link.
- Place the code on a physical or digital asset.
- A respondent scans it with their phone camera.
- The survey opens in their mobile browser.
- Responses flow into the same dashboard as any other survey channel.
There are two types of codes worth knowing. A static QR code has a fixed link baked in permanently, so changing the destination means printing a new code. A dynamic QR code points to a short redirect link that can be updated behind the scenes, which means you can swap the destination survey without reprinting anything.
Most current smartphones scan QR codes directly through the built-in camera app, so a separate scanner app is rarely needed. Because scanning happens on a phone, the survey behind the code has to be genuinely mobile surveys-ready, or people will abandon it before finishing.
QR code survey vs. other distribution methods
A QR code survey is not always the right distribution choice. It works best when feedback is tied to a physical location or moment, while other methods fit better for digital or list-based outreach.
The table below compares QR codes against the other common ways to distribute a survey.
| Method | Best for | Setup effort | Typical response speed |
|---|---|---|---|
| QR code | In-person moments (store, event, visit) | Low, print and place | Immediate, while experience is fresh |
| Email link | Existing customer or subscriber lists | Low | Delayed, hours to days |
| SMS link | Mobile-first audiences with phone numbers on file | Medium | Fast, often within the hour |
| In-person tablet | Staffed locations with high foot traffic | High, needs hardware | Immediate, but limited to one device |
Choosing between these usually comes down to whether you already have contact details. If you do not, and the feedback moment happens in person, a QR code survey fills that gap better than an email or SMS link ever could.
Where can you use a QR code survey?
A QR code survey works best in places where people already have a reason to give feedback, right after an experience ends.
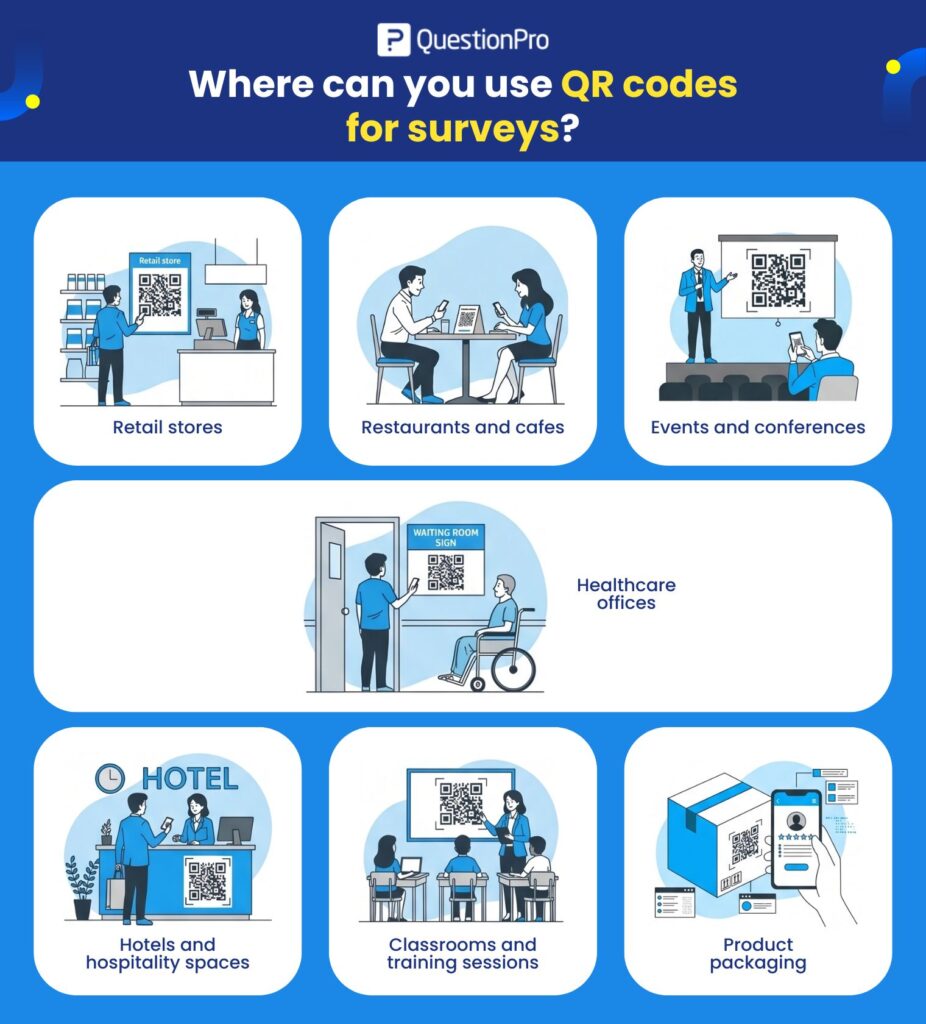
Strong placements include:
- Retail stores: Near checkout or printed on the receipt, asking about the shopping experience.
- Restaurants and cafes: On table tents or receipts, asking about service right after the meal.
- Events and conferences: On session slides, exit signage, or badges, asking about that specific session.
- Healthcare offices: On appointment cards or waiting room signs, asking about the visit.
- Hotels: In rooms or at checkout, asking about stay quality.
- Classrooms and training sessions: Right after a lesson or workshop ends.
- Product packaging: Asking about first-use experience or instructions.
For example, pairing a QR code with an event feedback survey template lets attendees scan and respond before they leave a session, while the details are still fresh. The same logic applies to a customer satisfaction survey template placed at a retail counter.
How do you create a QR code survey?
To create a QR code survey, build the survey first, then generate a QR code from its live link rather than starting with the code itself.
A straightforward setup process looks like this:
- Write short, mobile-friendly questions. Five or fewer works best for a scan-and-go survey.
- Publish the survey and copy its live URL.
- Generate a QR code from that URL using your survey platform’s built-in option.
- Download the code as an image file.
- Add it to your chosen print or digital material.
- Test the scan on at least two different phones before publishing it anywhere.
Most modern survey software includes QR code generation as part of the distribution step, so a separate QR tool usually is not necessary. QuestionPro’s QR code help page walks through printing or publishing a code directly from an existing survey, so responses land in the same report as every other channel.
Before it goes live, scan the code yourself from a few devices and confirm the first question loads quickly and reads clearly on a small screen.
How do you measure QR code survey performance?
You measure a QR code survey by tracking scan volume alongside response rate and completion rate, not scan count alone. A scan only shows interest, while a completed response shows actual feedback.
Three numbers matter most here. Response rate is the percentage of scans that turn into a submitted response. Completion rate is the percentage of started responses that finish every required question. Scan rate is simply how many times the code was scanned in a given period, which on its own says little without the other two.
| Metric | What it tells you |
|---|---|
| Scan count | How much foot traffic noticed and tried the code |
| Response rate | How well the scan converts into an actual answer |
| Completion rate | Whether the survey itself is too long or confusing |
| Location comparison | Which stores, events, or rooms generate the most feedback |
More than 100 million people in the US are projected to scan a QR code in 2026, so scan volume alone is becoming a weak signal, since scanning has turned into routine behavior rather than a sign of genuine interest. Tracking adoption trends like these helps explain why response and completion rate matter more than scan count on its own. Using a separate code per location also lets you compare performance by store, room, or session instead of lumping every scan into one number.
How can you improve QR code survey response rates?
You improve QR code survey response rates by making the code easy to notice, giving people a clear reason to scan, and keeping the survey short enough to finish on a phone.
A few tactics consistently move the number:
- Place the code where people naturally pause, not where they have to search for it.
- Add a specific call to action instead of a generic label.
- Tell people how long the survey takes before they scan.
- Keep the survey to five questions or fewer.
- Leave white space around the printed code so it scans cleanly.
- Avoid asking for personal details up front.
The wording next to the code matters more than it looks:
Weak: “Scan this QR code.” Stronger: “Scan to rate your visit in 60 seconds.”
Scan-to-action conversion on QR codes typically falls in the 15 to 20 percent range depending on placement and context, according to Bitly’s QR code research. A clear, time-bound call to action is one of the few variables fully within your control, worth testing more than once. Pairing that with ideas from this guide on survey response rates can push the number higher still.
What mistakes should you avoid with survey QR codes?
The most common mistake with a survey QR code is assuming people will scan it without being told why. A code by itself is not a call to action.
| Mistake | Why it hurts results |
|---|---|
| Survey is too long | Phone-based respondents abandon long forms quickly |
| Code placed too low or too small | People cannot scan it comfortably, so they skip it |
| Low contrast printing | The scanner cannot read the code reliably |
| Never tested before launch | Broken links or slow loads go unnoticed until it is too late |
| One code for every location | No way to compare feedback by store, event, or room |
| No stated purpose | People do not know why their input matters |
A good QR code survey should feel like three steps: scan, answer, submit. Anything that adds friction to that sequence costs you responses.
Real-world examples of QR code surveys
A regional coffee chain added a code to its printed receipts with the line “Rate today’s visit in under a minute.” Scans came disproportionately from the lunch rush, which told the team exactly when service quality needed the closest attention.
A three-day industry conference placed a different code on the closing slide of every session. Because each session had its own code, organizers could rank sessions by satisfaction instead of relying on one blended event score.
A packaged goods brand printed a code inside the box lid asking about unboxing and first use. Pairing it with QuestionPro’s QR code distribution feature meant the same survey tool used for other channels also handled this one, so responses sat in one dashboard rather than a separate system.
Getting more out of the moment people already give you
A QR code will not rescue a weak survey, and it will not create interest that was not there to begin with. What it does is remove the one barrier that usually kills in-person feedback: finding the link in the first place.
The businesses that get the most out of a QR code survey treat the code as the easy part. The real work is in the five questions behind it, the placement that catches someone at the right moment, and the habit of checking response and completion rates often enough to notice when something stops working.
Frequently Asked Questions (FAQs)
Usually not. Most survey platforms, including QuestionPro, generate a QR code directly from an existing survey link at no added cost. The only expense is typically printing, if the code goes on a physical item like a receipt or sign.
Not in real time. The phone needs a data or WiFi connection to load the survey after scanning, though some platforms let respondents complete a form offline and sync it once a connection returns.
Generally yes, if the code links to a known, branded survey URL. Businesses should avoid unbranded codes with no visible source, since scam codes have made some US consumers more cautious about scanning unfamiliar ones.
Aim for 60 seconds or less, roughly five questions or fewer. QR traffic skews mobile and impulsive, so a survey that takes longer than a minute will lose far more respondents than the same questions sent by email.
Yes, with a dynamic QR code pointing to a survey that detects language or routes by a parameter in the link. For location tracking specifically, a separate static code per site is usually simpler to manage and report on.