
In the world of data analytics, clarity is king. As researchers and insights teams, we often face overwhelming data in our dashboards, making it difficult to focus on the metrics that truly matter. Stat highlight is a simple yet powerful new feature in QuestionPro BI that cuts through the noise and helps you zero in on the statistic that counts.
What is the Stat Highlight Widget?
The stat highlight widget in QuestionPro BI lets you select a question and highlight the most critical statistic you want to showcase. It’s designed to streamline the user experience by eliminating unnecessary distractions, helping you communicate insights with clarity and ease.
Whether you’re working with open-ended questions, rating scales, or customer satisfaction surveys, the stat highlight widget empowers you to quickly identify and highlight the statistic that holds the most significance for your analysis.
Example use cases:
- Average age: If you ask respondents for their age in an open-ended question, you can instantly highlight the average age.
- Rating scale: On a 1–10 scale, display the average rating rather thanall individual responses.
- Net Promoter Score (NPS): For an NPS question, easily highlight the NPS score to showcase how likely respondents are to recommend your brand.
Stat highlight makes these tasks easier and faster, reducing time and cognitive load so you can focus on what truly matters.
How can you use stat highlight?
Using the stat dighlight widget is simple. Follow these detailed instructions to set up the stat highlight in your QuestionPro BI dashboard.
Use cases & examples: When to use stat highlight
The beauty of stat highlight is its ability to spotlight the key metric without unnecessary clutter. Here are a few specific examples of when you might want to use this widget:
1. Customer feedback
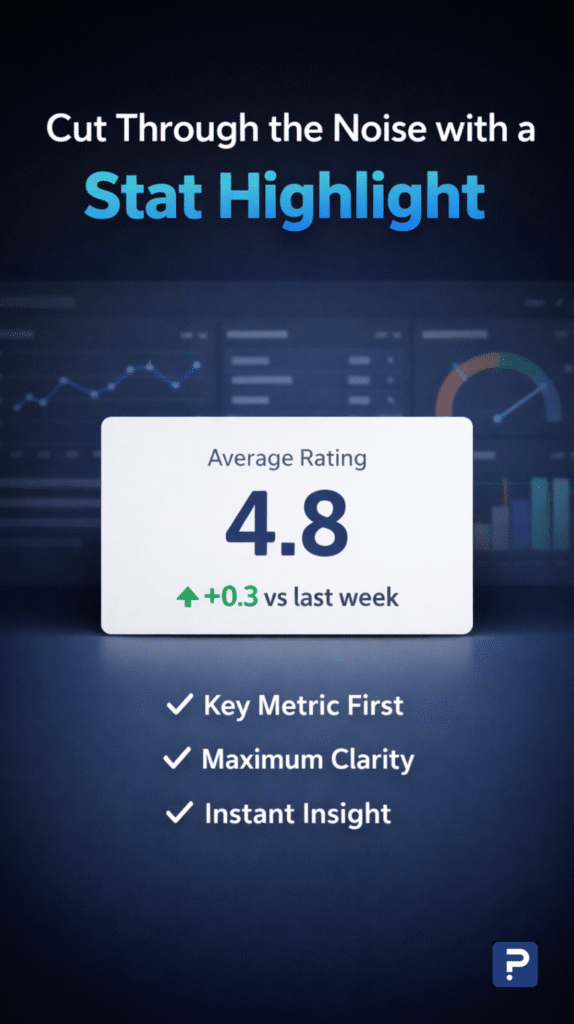
After collecting customer feedback on a 1–5 scale, you may want to highlight the average rating (e.g., 4.2/5) rather than displaying a percentage breakdown of each rating. This gives you a quick snapshot of overall satisfaction without overwhelming the viewer.
2. Employee engagement surveys
If you’re conducting an employee satisfaction survey and want to highlight the average score for a specific factor (e.g., work-life balance), stat highlight helps you pinpoint this in a concise and easy-to-understand format.
3. Market research studies
When analyzing a market research study, you might want to emphasize the most relevant insight, such as the mean product satisfaction score, rather than getting bogged down in the details of each individual response.
4. NPS surveys
In an NPS survey, focusing on the NPS score itself provides a clear picture of customer loyalty. Stat highlight ensures that you can share this score without needing to dive into the percentages of promoters, passives, or detractors.
However, if you do want the scoring of promoters, passives, or detractors, stat highlight also helps you surface that insight instantly.
5. Open-ended responses
For open-ended questions, such as “What age group do you belong to?”, you can highlight the average age to provide a straightforward, data-backed insight.
Why stat highlight is a must-have feature for researchers and insights teams
Stat highlight may seem simple, but it addresses a significant need for researchers and insights teams: reducing data overload. Too often, we are forced to present large datasets, which leads to confusion and decision fatigue for those consuming the reports.
With stat highlight, you can focus on just one statistic that represents the essence of your data. This simplicity brings clarity and allows you to:
- Present key insights faster: Whether you’re in a meeting or creating a report, Stat Highlight helps you quickly communicate the information that matters most.
- Reduce cognitive load: Instead of overwhelming your audience with too many numbers, focus on a single key metric to make your presentation or analysis easier to digest.
- Streamline decision-making: Decision-makers and stakeholders can act on insights immediately, knowing exactly what to focus on.
Solving data clarity problems with stat highlight
Traditionally, dashboards can be overwhelming. Too many data points often create cognitive overload, making it difficult to identify the insight that truly matters. Stat highlight solves this problem by presenting a single key metric, giving you an instant view of what’s most important.
Here’s how you can benefit
For example, imagine a survey asking users to rate your product on a 1–5 scale. While seeing the percentage breakdown of each rating is helpful, highlighting the average rating (mean score) is even more useful. Stat highlight makes that possible effortlessly.
When should you avoid using stat highlight?
While stat highlight is a powerful tool, it’s not the best choice for every scenario. For instance, if you need to display multiple statistics together, such as a breakdown of NPS into promoters, passives, and detractors, stat highlight may not be the most suitable option. In these cases, other QuestionPro BI widgets that display multiple statistics side by side would be better.
However, if you only need to highlight a single score, such as the Promoters score in an NPS survey, stat highlight is perfect for the task. This feature lets you showcase the most important statistic without unnecessary distractions, even when a specific value needs to stand out.
Pricing of the stat highlight
One of the best things about the Stat Highlight widget is that there’s no additional charge. It’s available to any QuestionPro BI user at no extra cost. If you already have access to QuestionPro BI, you can start using Stat Highlight right away.
Product roadmap & future vision
In 2026, the stat highlight widget will receive incremental updates to enhance its functionality while staying true to its core value of providing simplicity and clarity. We plan to introduce additional features, including trend analysis, to highlight key patterns over time. Explore the full capabilities of QuestionPro BI and experience the stat highlight widget today. For more detailed resources, check out the QuestionPro BI resource hub and stay tuned for upcoming tutorials and feature updates!
Conclusion: The power of simplicity
In data analytics, simplicity is often the key to unlocking the most valuable insights. The stat highlight widget in QuestionPro BI allows researchers and insights teams to cut through the noise, spotlight the key metric, and provide immediate clarity. This seemingly simple tool can transform how you present data, making it one of the most sought‑after features for survey analysts and data professionals alike.
Stay ahead of the curve by incorporating stat highlight into your QuestionPro BI reports, and see how much easier it can be to turn complex data into actionable insights.