Trader Joe’s NPS 2025 score offers a clear window into why the grocery chain keeps such a devoted following. Shoppers do not just return for the private-label snacks. They tell friends, family, and strangers in the checkout line to go too.
That word-of-mouth pull is exactly what Net Promoter Score is built to capture. It turns a gut feeling about a brand into a single, comparable number.
In this article, we’ll break down Trader Joe’s actual 2025 NPS, how it stacks up against grocery industry benchmarks, what fuels the score, and how any retail brand can start tracking the same metric.
What is Net Promoter Score (NPS)?
Net Promoter Score (NPS) is a customer loyalty metric that measures how likely someone is to recommend a company to a friend or colleague. It comes from a single question, scored on an 11-point scale.
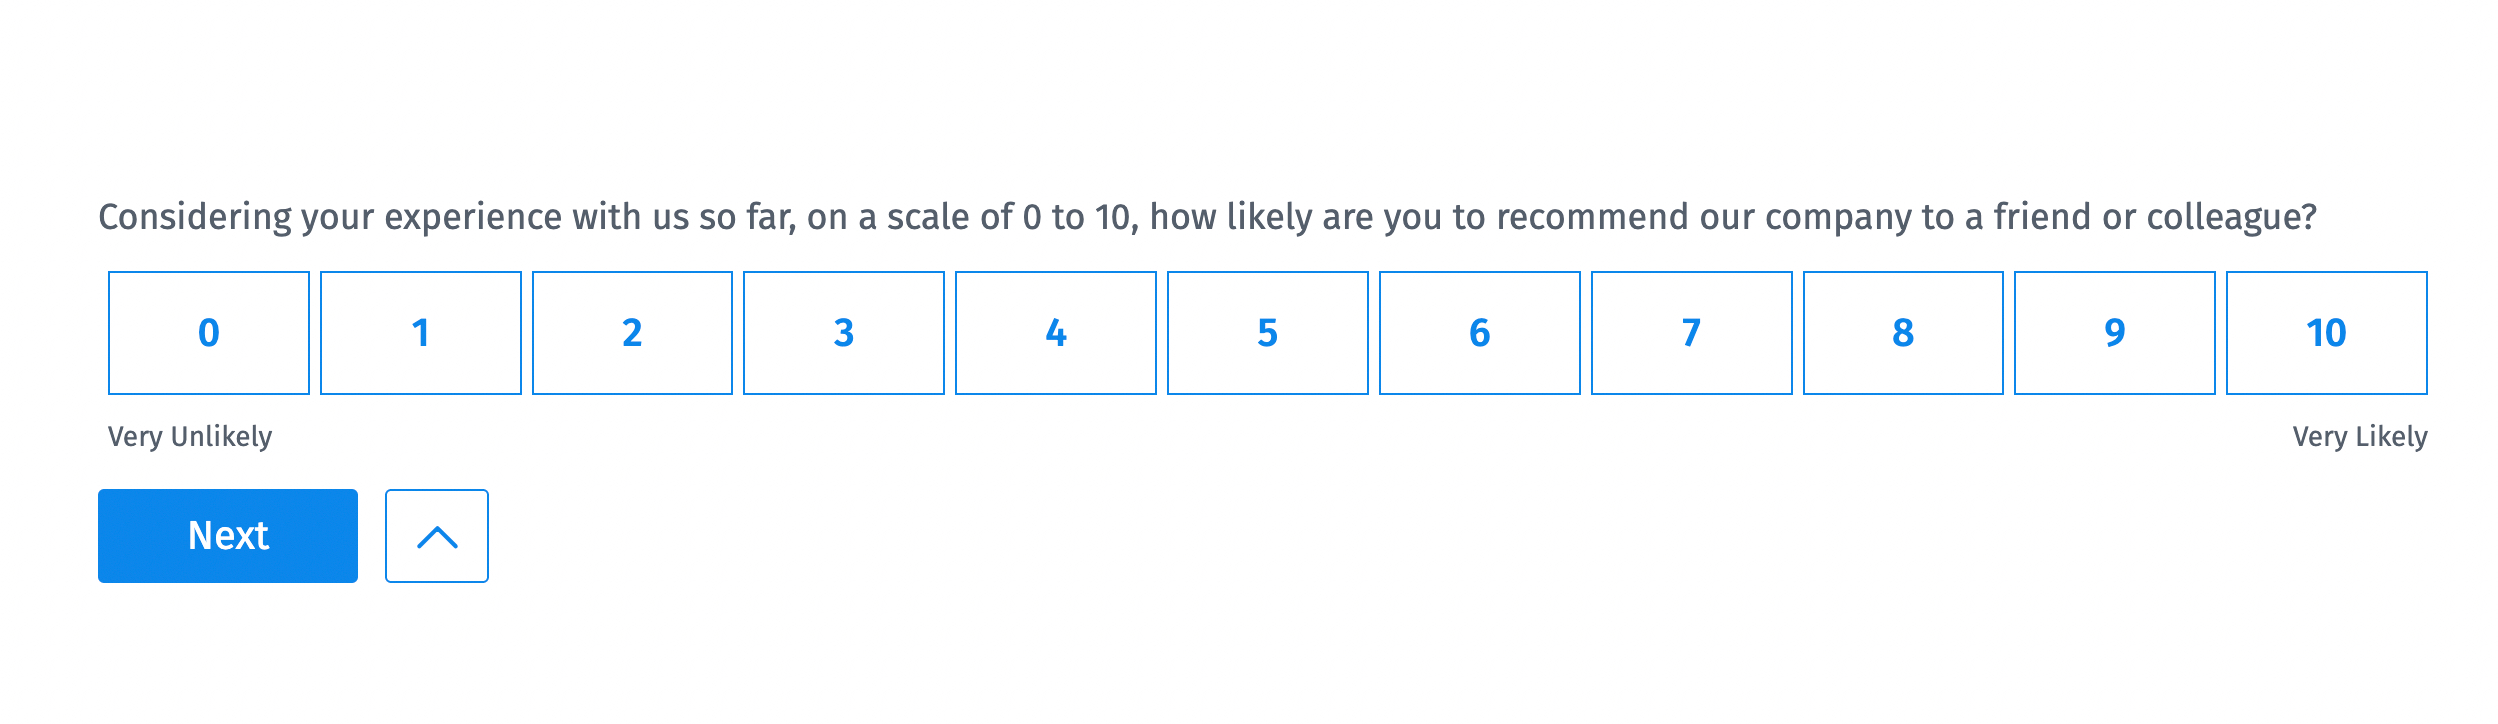
The question reads: “On a scale of 0 to 10, how likely are you to recommend us to a friend or colleague?” Responses sort customers into three groups.
- Promoters (9 to 10): Loyal customers who actively recommend the brand.
- Passives (7 to 8): Satisfied but unenthusiastic customers who rarely promote or criticize.
- Detractors (0 to 6): Unhappy customers who can damage a brand’s reputation through negative word of mouth.
The formula is simple. NPS = % Promoters − % Detractors. Passives count toward the total respondent base but do not factor into the subtraction itself.
Scores range from -100 to 100. Anything above 0 is considered acceptable, above 30 is generally strong, and above 70 is rare even among the world’s most loved brands. Net Promoter Score (NPS) has become one of the most widely used customer experience metrics because it is quick to collect and easy to benchmark across companies.
What is Trader Joe’s NPS score in 2025?
Trader Joe’s NPS score for 2025 is 41, according to QuestionPro’s Q1 2025 Benchmarking NPS and CSAT Report. That places the grocer comfortably ahead of the grocery retail average.
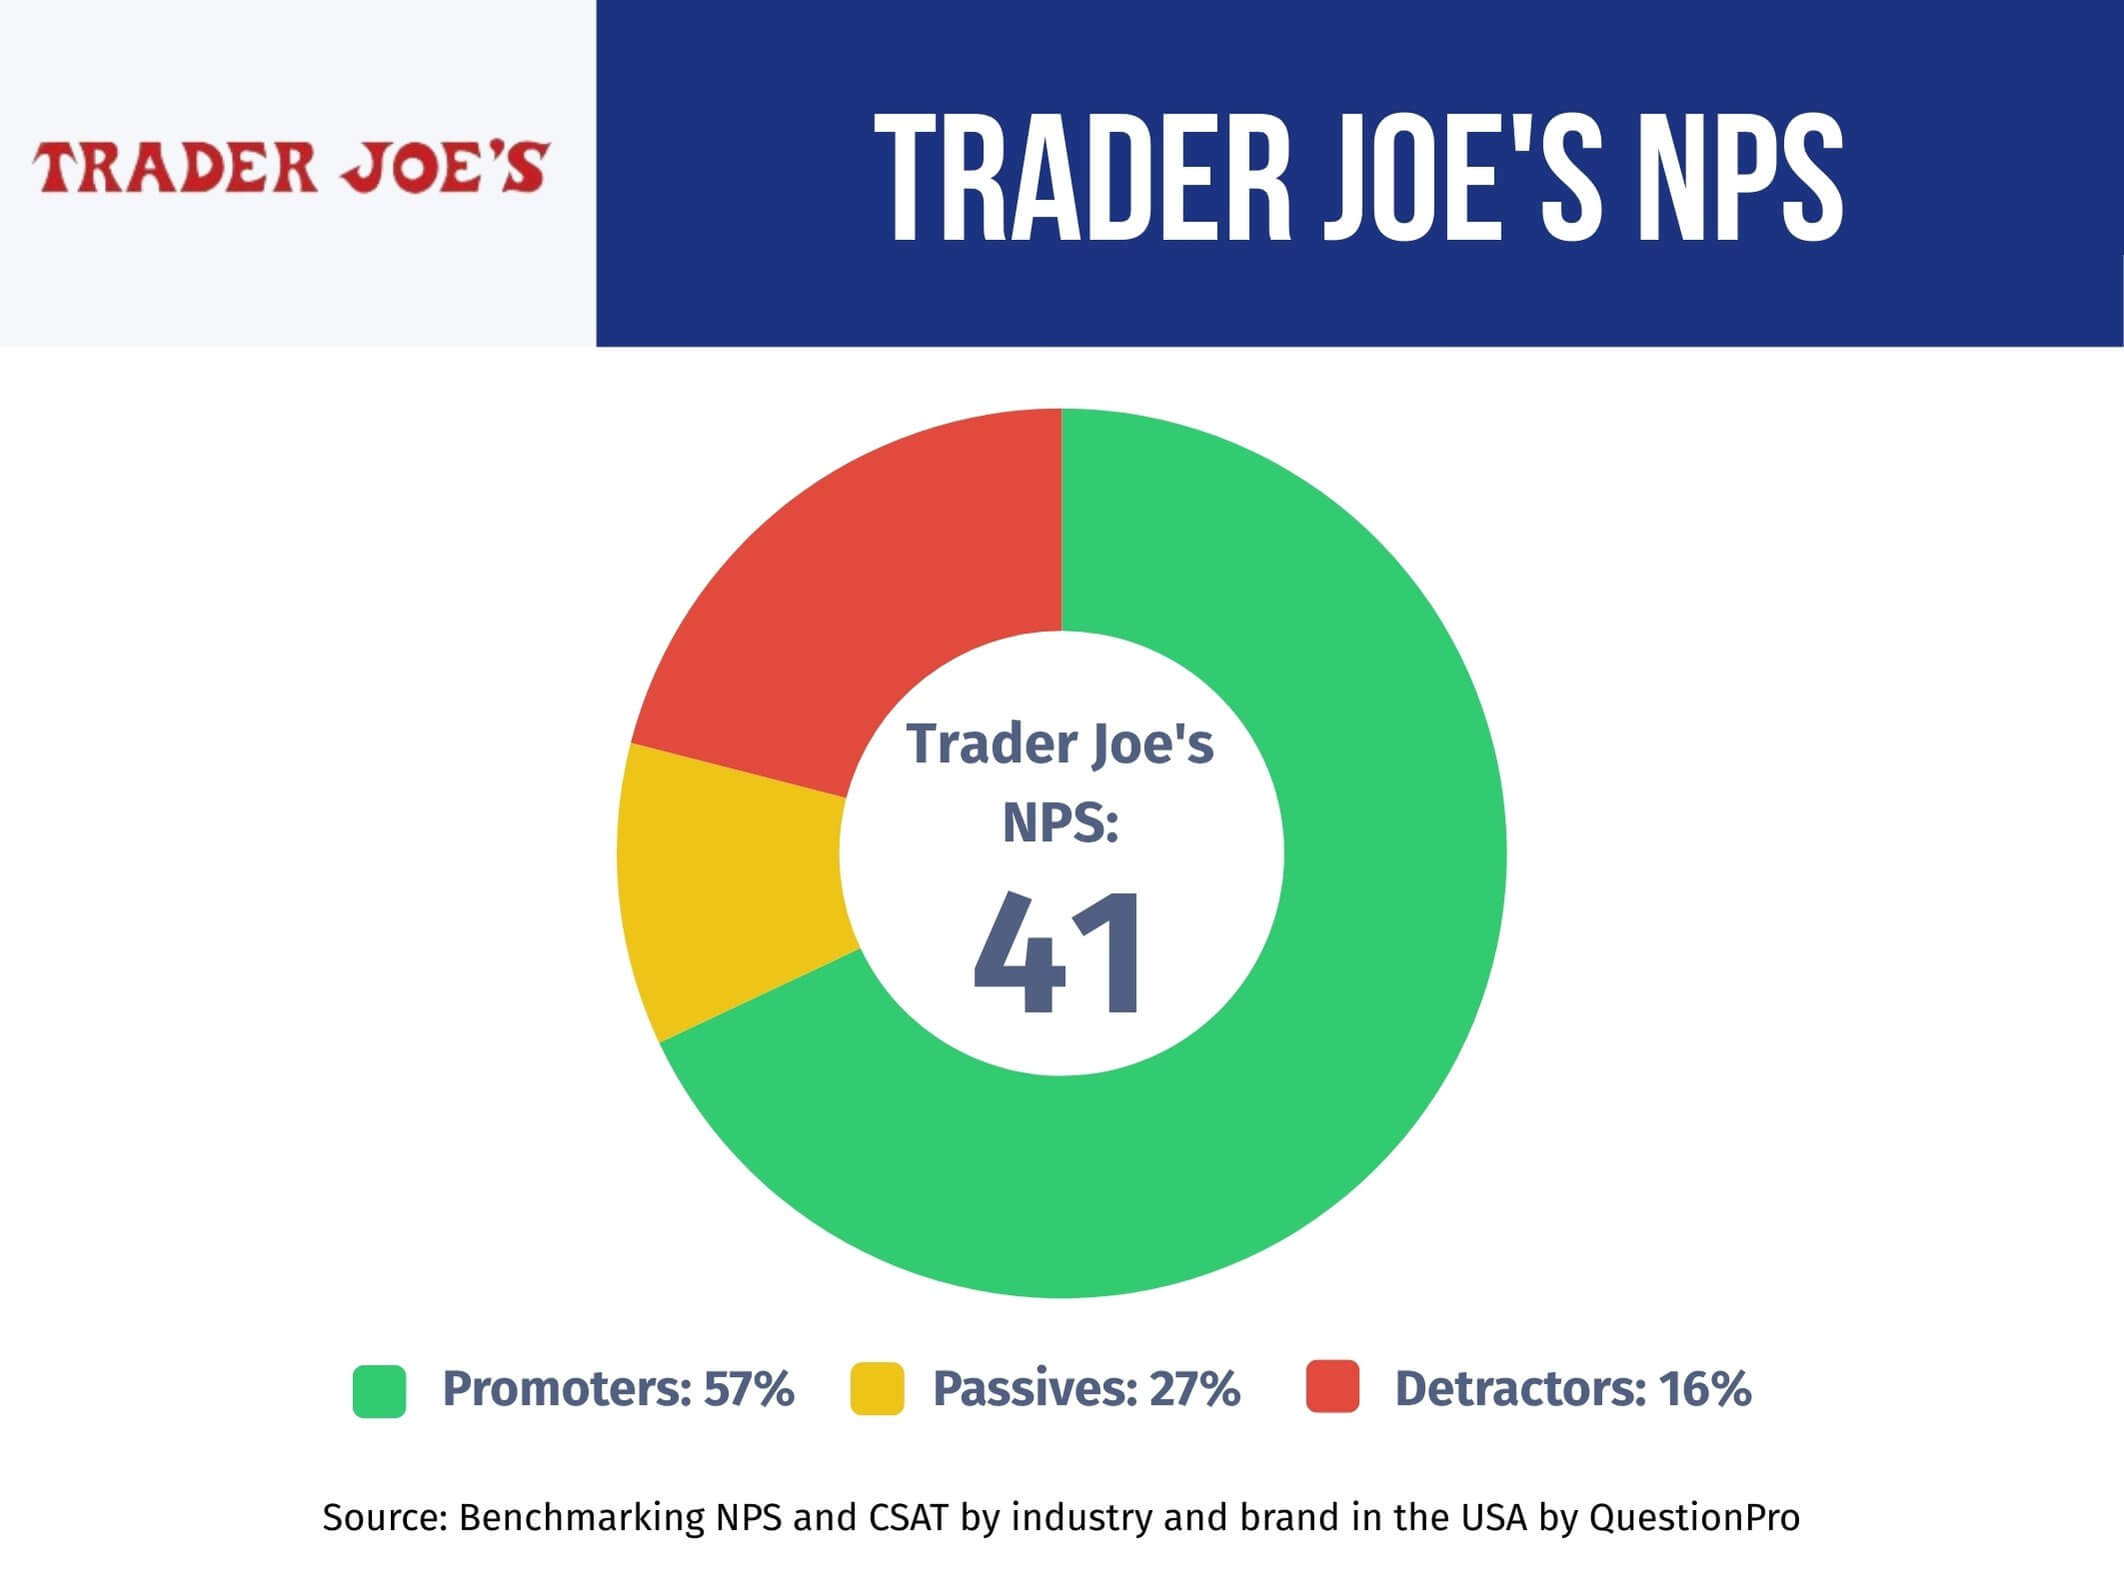
The report surveyed 1,000 U.S. participants across several industries to measure customer loyalty and satisfaction during the first quarter of 2025. For Trader Joe’s specifically, the response breakdown looked like this.
Trader Joe’s earned 57% Promoters, 27% Passives, and 16% Detractors. Subtracting the detractor share from the promoter share produces the final score of 41.
A high share of Promoters combined with a relatively small Detractor group is the profile of a brand with strong, durable customer loyalty rather than a one-time spike in goodwill. Few grocery chains post a Promoter share above 55%, which is what separates Trader Joe’s from the pack.
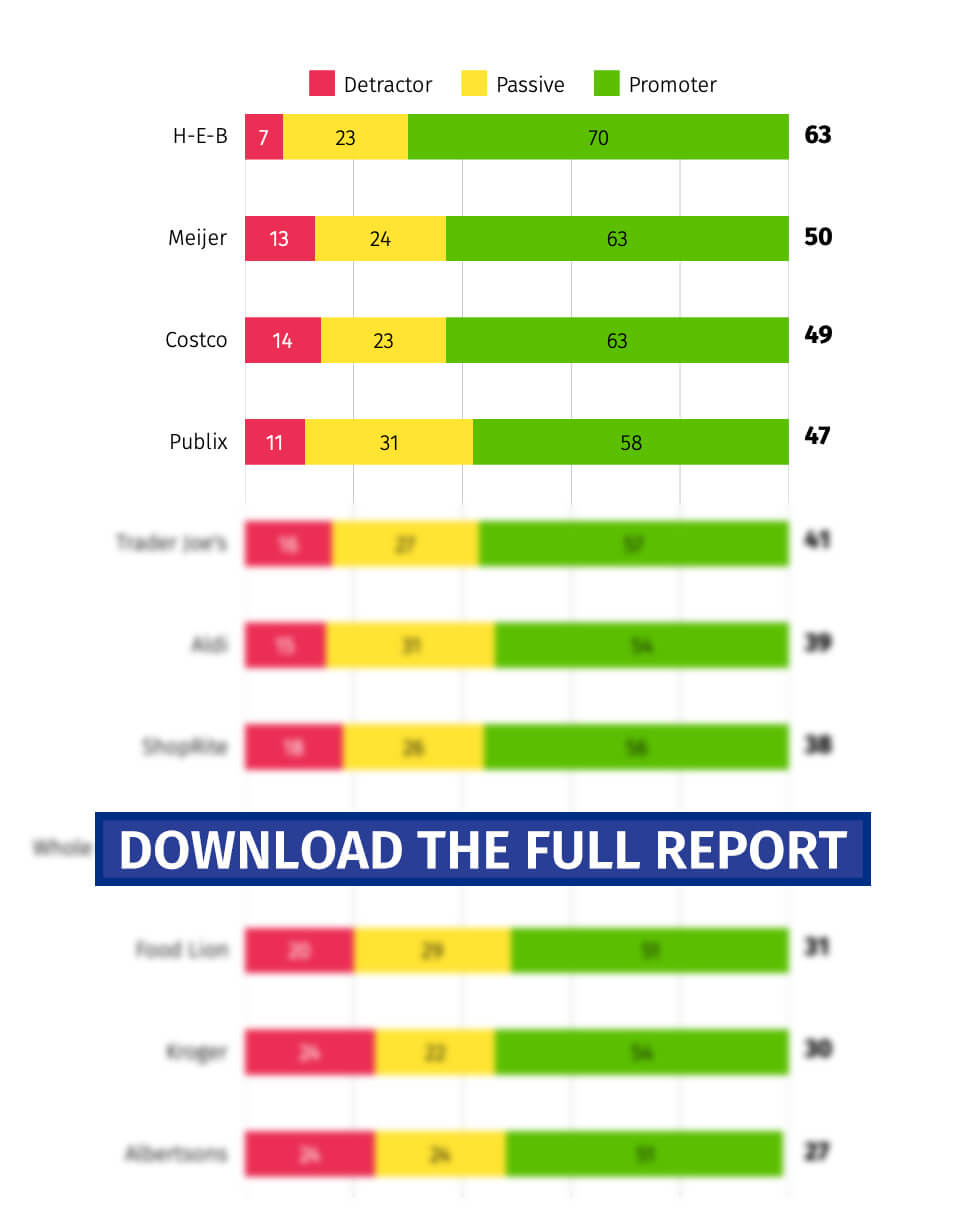
All these insights come from QuestionPro’s latest study, which surveyed 1,000 participants to measure the NPS of various companies and industries. This report reflects honest user opinions from Q1 2025 and is updated quarterly.
So we invite you to download it, it will surely be very useful for understanding how well your company is doing.
How does Trader Joe’s NPS compare to grocery industry benchmarks?
Trader Joe’s NPS of 41 sits well above the grocery retail category average of 37, based on the same Q1 2025 benchmarking data. The gap may look small on paper, but a few points on the NPS scale usually reflect a meaningful difference in how consistently a brand delivers on customer expectations.
Here is how grocery retail compares with a few other consumer-facing industries tracked in the same report.
| Industry | Average NPS (Q1 2025) |
|---|---|
| Hotel and hospitality | 44 |
| Banking and credit unions | 41 |
| Automotive | 41 |
| Trader Joe’s (individual brand) | 41 |
| Big box retail | 37 |
| Grocery retail (category average) | 37 |
| Airlines | 33 |
| Insurance | 23 |
Grocery retail sits mid-pack among the industries QuestionPro tracks, which makes Trader Joe’s performance more notable. The chain matches categories like banking and automotive, sectors where higher price points and longer customer relationships typically make loyalty easier to earn. A grocery brand hitting that same number, on low-margin weekly purchases, points to something specific happening in the shopping experience itself.
NPS vs ACSI: Is Trader Joe’s really the customer satisfaction leader?
Yes. Trader Joe’s leads on both NPS and a separate, widely cited metric called the American Customer Satisfaction Index (ACSI), though the two measure slightly different things.
ACSI is a national benchmark that scores customer satisfaction with a specific recent experience on a 0-to-100 scale, drawing on tens of thousands of consumer interviews each year. NPS, by contrast, measures long-term loyalty and willingness to recommend, not satisfaction with a single visit.
According to the 2026 American Customer Satisfaction Index grocery report, Trader Joe’s ranked first among U.S. grocery chains with a score of 86 out of 100, ahead of Publix at 84 and H-E-B at 83. That ranking was based on roughly 30,000 shopper interviews conducted throughout 2025.
The two metrics tell a consistent story even though they ask different questions.
- NPS asks whether a customer would recommend the brand to someone else.
- ACSI asks how satisfied a customer was with a recent interaction.
- A brand can score well on one and poorly on the other if, for example, service is excellent but prices frustrate loyal shoppers.
- Trader Joe’s scoring near the top of both suggests the loyalty is not a fluke tied to one survey methodology.
Teams that want a single-interaction pulse alongside a loyalty score often run CSAT vs NPS surveys side by side rather than picking one over the other.
What’s driving Trader Joe’s high NPS?
Four factors show up consistently across customer feedback and industry coverage of Trader Joe’s, and together they explain the gap between its score and the grocery average.
Product quality and exclusive private labels
Roughly 80% of what Trader Joe’s sells carries its own private label, which the company can price aggressively while controlling taste and quality through an internal tasting panel. Shoppers cannot buy the exact same product at a competing chain, which builds the kind of exclusivity that turns customers into brand advocates.
Friendly, empowered staff
Crew members are known for casual, helpful interactions rather than scripted service. Customer service quality consistently ranks as one of the top drivers behind ACSI’s staff courtesy and helpfulness scoring for the chain.
Value on everyday items
Trader Joe’s keeps prices low on staples like produce and dairy, which matters more to loyalty than most grocers assume, since these are the items customers buy weekly and notice most.
A sense of community
Smaller store formats and a curated, ever-changing product mix give shopping trips a discovery feel rather than a chore, which shoppers describe as a reason they stay loyal even without a rewards program or delivery app. That kind of loyalty is exactly what turns regular shoppers into brand advocates who promote a company without being asked.
What Trader Joe’s shoppers are actually saying
Public reviews echo the same themes that show up in the NPS and ACSI data. Shoppers frequently mention the price-to-quality ratio as the single biggest surprise, especially when comparing produce prices against larger chains.
Reliability comes up almost as often as price. Customers describe consistent quality across visits and locations, which matters for a chain with hundreds of stores nationwide trying to maintain a single identity.
A smaller but vocal group of reviewers wishes Trader Joe’s had more locations near them, since the chain’s limited footprint compared to competitors like Kroger or Safeway is the most common complaint tied to an otherwise strong shopping experience. That single gap, rather than product or service quality, tends to explain most of the Passive and Detractor responses in the NPS breakdown.
Common mistakes brands make when tracking NPS
Grocery and retail teams trying to replicate a score like Trader Joe’s often run into avoidable problems.
- Treating NPS as a vanity metric.
A number without a follow-up plan for Detractors does not move the business forward. - Surveying too rarely.
Quarterly or annual pulses miss the seasonal shifts that matter in grocery, where holiday traffic and price changes swing sentiment fast. - Skipping the “why” behind the score.
A 0 to 10 rating alone does not explain what to fix. - Comparing against the wrong benchmark.
Comparing a regional chain’s NPS to a national leader like Trader Joe’s without adjusting for store count or market maturity leads to the wrong conclusions. - Ignoring Passives.
These customers are the easiest group to convert into Promoters, yet many teams only focus on winning back Detractors.
How to measure your own NPS score
Getting a reliable, benchmarkable NPS score takes more than sending out one question. A structured process makes the difference between a number you can act on and one you cannot.
Step 1: Ask the right NPS question
Start with a proven NPS survey template that uses the standard 0 to 10 recommendation scale, so your results stay comparable to industry benchmarks like the ones above.
Step 2: Add a follow-up question for context
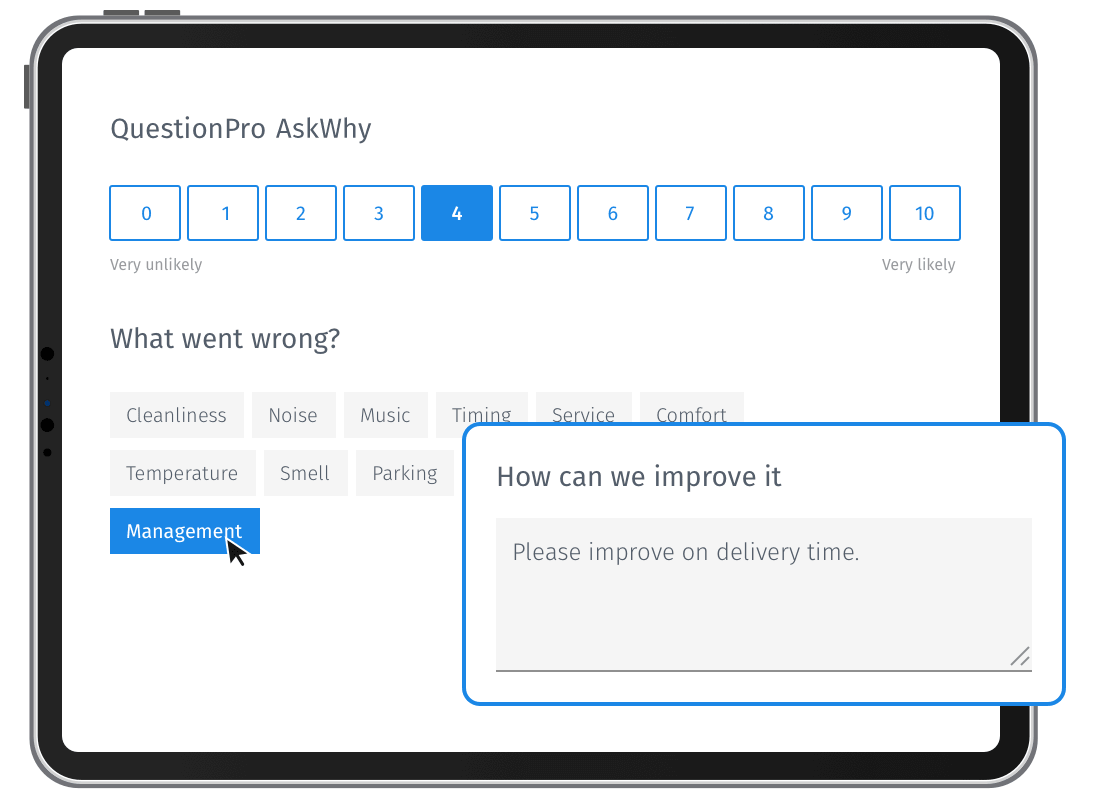
A score alone does not explain itself. Adding an AskWhy follow-up question after the rating captures the specific reason behind each response, which is what turns a Detractor’s feedback into a fixable issue.
Step 3: Distribute, analyze, and repeat
Send the survey through email, SMS, or QR codes at the right moment in the customer journey, then analyze results in real time using survey software that automatically calculates your score and segments respondents into Promoters, Passives, and Detractors.
What to do when your NPS falls short of Trader Joe’s benchmark
A score below the grocery average of 37 is not a reason to panic, but it does call for a specific response depending on where the gap sits.
| Your situation | Recommended next step |
|---|---|
| NPS below 0 | Prioritize closing the loop with Detractors before investing in growth marketing |
| NPS between 0 and 37 | Benchmark against direct competitors, not just the category average, to find the real gap |
| NPS between 37 and 41 | Focus on converting Passives, since they are closer to becoming Promoters than Detractors are |
| NPS above 41 | Protect what is working and watch for early warning signs as the business scales |
Most grocery and retail brands fall into the second or third row, where the fix is rarely a single dramatic change. It is usually a handful of specific, recurring complaints that a well-designed follow-up question can surface within a single survey cycle.
Businesses that want a broader view of where they stand can use QuestionPro Customer Experience to track NPS alongside CSAT and customer effort score in one dashboard, rather than treating each metric as a separate project.
The bottom line on Trader Joe’s NPS in 2025
Trader Joe’s NPS of 41 is not an accident of branding. It reflects a business that has aligned product, price, and service around what its specific customer base actually values, then held that experience steady across hundreds of locations.
The bigger lesson for any grocery or retail team is that a high NPS rarely comes from one big initiative. It comes from consistently getting the small, repeatable parts of the customer journey right, then measuring often enough to catch the moment that consistency slips.
Access the Q1 2025 NPS Benchmark Report to see how leading brands are driving customer loyalty and discover the strategies that keep their customers coming back.
Want to boost your NPS? Reach out to the experts at QuestionPro for tailored advice on measuring and enhancing customer satisfaction.
Frequently Asked Questions (FAQs)
Anything above the category average of 37 is considered strong for U.S. grocery retail. Scores above 50 are rare in this sector and usually belong to smaller, specialty chains rather than national grocers.
Trader Joe’s has not published an official, self-reported NPS score to date. The figures cited in benchmarking reports come from independent, third-party consumer research rather than internal company surveys or investor disclosures.
Star ratings reflect satisfaction with one purchase or visit and are self-selected, since only motivated customers tend to leave reviews. NPS surveys a broader, more representative sample and measures overall willingness to recommend, not just satisfaction with a single trip.
Yes. Market research firms survey representative samples of a brand’s customers directly, so a company does not need to participate or share internal data for an accurate score to exist.
Quarterly is the most common cadence for retail and grocery, since it is frequent enough to catch seasonal shifts in pricing or inventory without generating survey fatigue among repeat customers.
Trader Joe’s isn’t the only company in the grocery retail industry with valuable lessons for those looking to improve their customer service and experience. Below, we recommend a few articles where you can learn how other major brands manage to maintain a high NPS and a loyal customer base — you’ll surely find some useful insights along the way.