Every customer interaction tells a story. From a purchase experience to a support interaction, customers continuously share signals about what they like, what frustrates them, and what they expect from a brand.
But collecting customer feedback is only the first step. The real challenge is making sense of that data, identifying meaningful patterns, and translating insights into better customer experiences.
This is where a Customer Experience (CX) Dashboard becomes essential.
QuestionPro CX Dashboard helps businesses bring customer experience metrics and feedback together through interactive visualizations, making it easier to monitor performance, explore customer sentiment, and understand what drives customer satisfaction.
Why Businesses Need a CX Dashboard
Customer feedback often comes from multiple surveys, channels, and touchpoints. Without a centralized way to analyze this information, teams may struggle to identify trends, compare performance, and understand where improvements are needed.
A CX Dashboard helps address these challenges by providing a consolidated view of customer experience performance.
With the right visualizations, businesses can:
- Monitor key customer experience metrics such as NPS, CSAT, and CES.
- Track changes in customer satisfaction over time.
- Compare feedback across customer segments.
- Identify recurring themes in customer comments.
- Understand the distribution of customer responses.
- Present customer experience performance in an easy-to-understand format.
Instead of reviewing individual survey reports, teams can use dashboards to get a broader perspective of customer experience.
Explore Customer Experience Data Through Interactive Widgets
Different business questions require different ways of looking at data. A CX Dashboard brings multiple visualization options together, allowing teams to choose how they want to interpret and present their customer feedback.
Here are some of the ways businesses can analyze their CX data.
1. Monitor Key Metrics with Metric Tiles
Some metrics need immediate attention. Metric Tiles help highlight important numbers such as NPS, CSAT, CES, response counts, and other key performance indicators.
They provide a quick snapshot of customer experience performance, helping teams understand where they stand.
2. Track Performance Over Time
Customer experience is constantly changing. Trend Charts, Line Charts, and Area Charts help businesses monitor how metrics evolve across different time periods.
Teams can use these visualizations to:
- Track monthly NPS and CSAT performance.
- Monitor changes in customer satisfaction.
- Identify upward or downward trends.
- Evaluate customer experience performance over time.
3. Compare Customer Segments with Cross Tabs
Not every customer segment has the same experience. Cross Tab widgets help compare survey responses across different groups, making it easier to explore differences between customer demographics, locations, products, or other segments.
This helps businesses understand which customer groups are having better experiences and where additional attention may be required.
4. Understand Response Distribution with Bar, Pie, and Donut Charts
Understanding how customers respond is an important part of CX analysis.
Bar Charts help compare values across categories, while Pie Charts and Donut Charts help visualize how responses are distributed.
These visualizations make it easier to understand customer preferences, satisfaction levels, and response patterns.
5. Evaluate Performance Against Targets with Gauge Charts
Tracking a metric is useful, but understanding how it performs against a target is even more valuable.
Gauge Charts help visualize performance against defined goals, making them useful for monitoring customer satisfaction targets, NPS benchmarks, and other business KPIs.
6. Identify Patterns with Heat Maps
Heat Maps provide a visual way to explore response patterns and variations across categories.
They can help teams identify differences in customer responses and quickly spot areas that may need further investigation.
7. Understand the Voice of the Customer with Textual Widgets
Customer comments often contain insights that numerical scores cannot fully explain.
QuestionPro CX Dashboard offers textual visualization options to help teams explore qualitative feedback.
- Word Cloud: Highlights frequently occurring words in customer feedback, helping teams quickly identify common themes.
- Comment List: Displays customer comments in a readable format, making it easier to review individual responses.
- AskWhy: Supports deeper exploration of customer feedback to understand the reasons behind customer responses.
Together, these widgets help businesses look beyond scores and explore the experiences behind them.
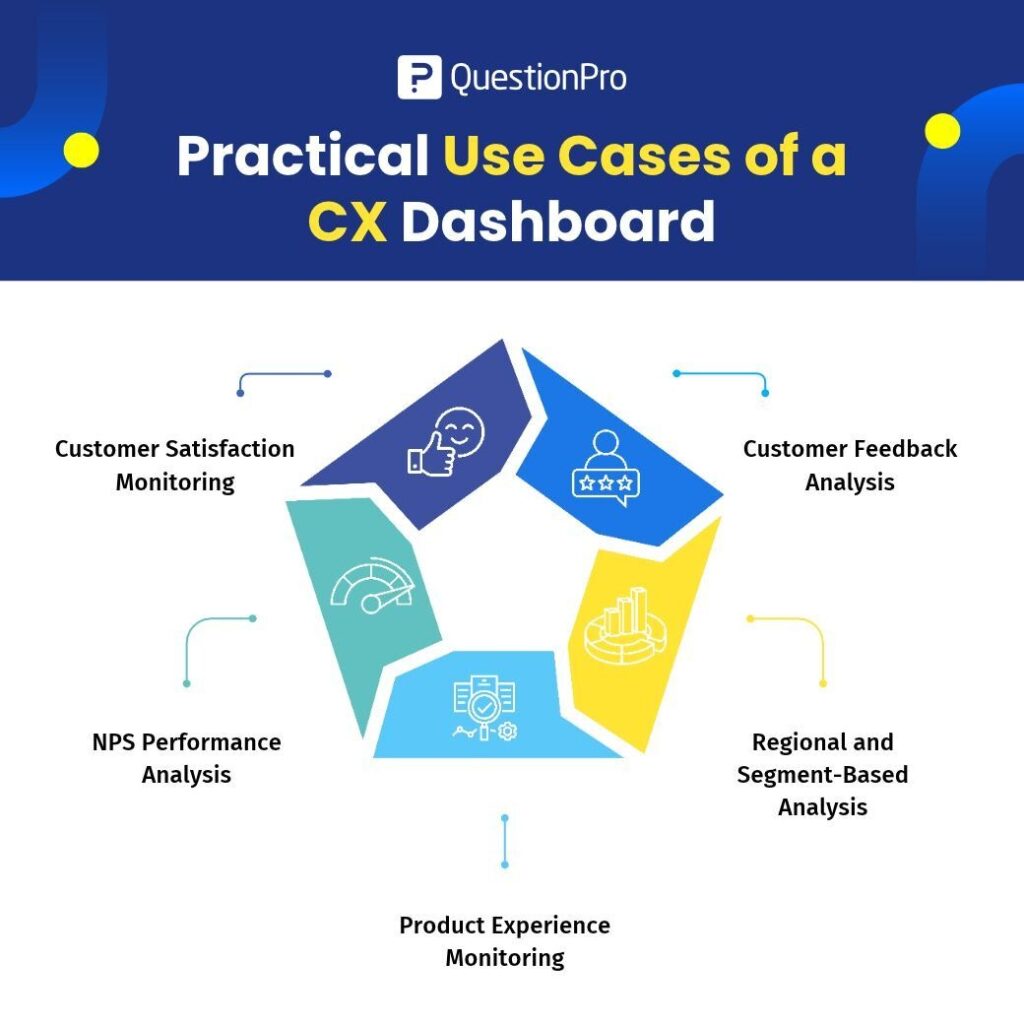
Practical Use Cases of a CX Dashboard
A CX Dashboard can support different teams and business objectives.
Customer Satisfaction Monitoring
CX teams can combine Metric Tiles, Gauge Charts, and Trend Charts to monitor satisfaction levels, evaluate performance against targets, and track changes over time.
NPS Performance Analysis
Businesses can use Metric Tiles, Bar Charts, and Trend Charts to monitor NPS performance and understand how promoter, passive, and detractor responses change over time.
Customer Feedback Analysis
Using Word Clouds, Comment Lists, and AskWhy, teams can explore customer comments, identify recurring feedback themes, and investigate the reasons behind customer experiences.
Regional and Segment-Based Analysis
Cross Tabs and Bar Charts help businesses compare customer experience metrics across regions, customer groups, or business segments.
Product Experience Monitoring
Product teams can use Heat Maps, Trend Charts, and Comment Lists to understand customer feedback about products, features, and interactions.
From Customer Experience Metrics to Better Business Decisions
A CX Dashboard is more than a collection of charts and numbers. It provides a structured way to understand customer experience performance.
When businesses can monitor important metrics, compare customer segments, explore feedback patterns, and review customer comments in one place, they can make more informed decisions about where to focus their improvement efforts.
For CX managers, it means better visibility into customer satisfaction. For analysts, it means easier exploration of customer feedback. For business leaders, it means having relevant customer experience metrics available to support strategic decisions.
Make Customer Experience Data Work for Your Business
Understanding customers requires more than collecting feedback. Businesses need the ability to interpret that feedback, recognize patterns, and connect customer insights with meaningful actions.
With QuestionPro CX Dashboard, organizations can bring their customer experience metrics and feedback visualizations together, making it easier to monitor performance and explore the voice of the customer.
Turn customer feedback into insights. Turn insights into better experiences.