

- Moderation
- Usability test: UX Diagnostics
- Sprint View: Usability tests
- Accessible Usability Scale - AUS
- System Usability Scale - SUS
- SUPR-Q
- PSSUQ
- UX Crowd: Usability tests
- AI Insights for Usability Tests
- Self-Reported Success (SRS)
- AI Executive Summaries
- Participant Diaries and Study Analysis
- Image analysis
- Voting task analysis
- Video tasks: Analysis

Study Analysis
Study Analytics allows you to examine your qualitative data at multiple levels. You can view aggregate insights across all participants to identify high-level trends or focus on individual participant journeys to understand their specific experiences. The dashboard includes response timelines, AI-powered thematic analysis, sentiment tracking, and word clouds to help you uncover meaningful insights from your research.
Watch this video for a quick overview of the Study Analysis features in QuestionPro UX:
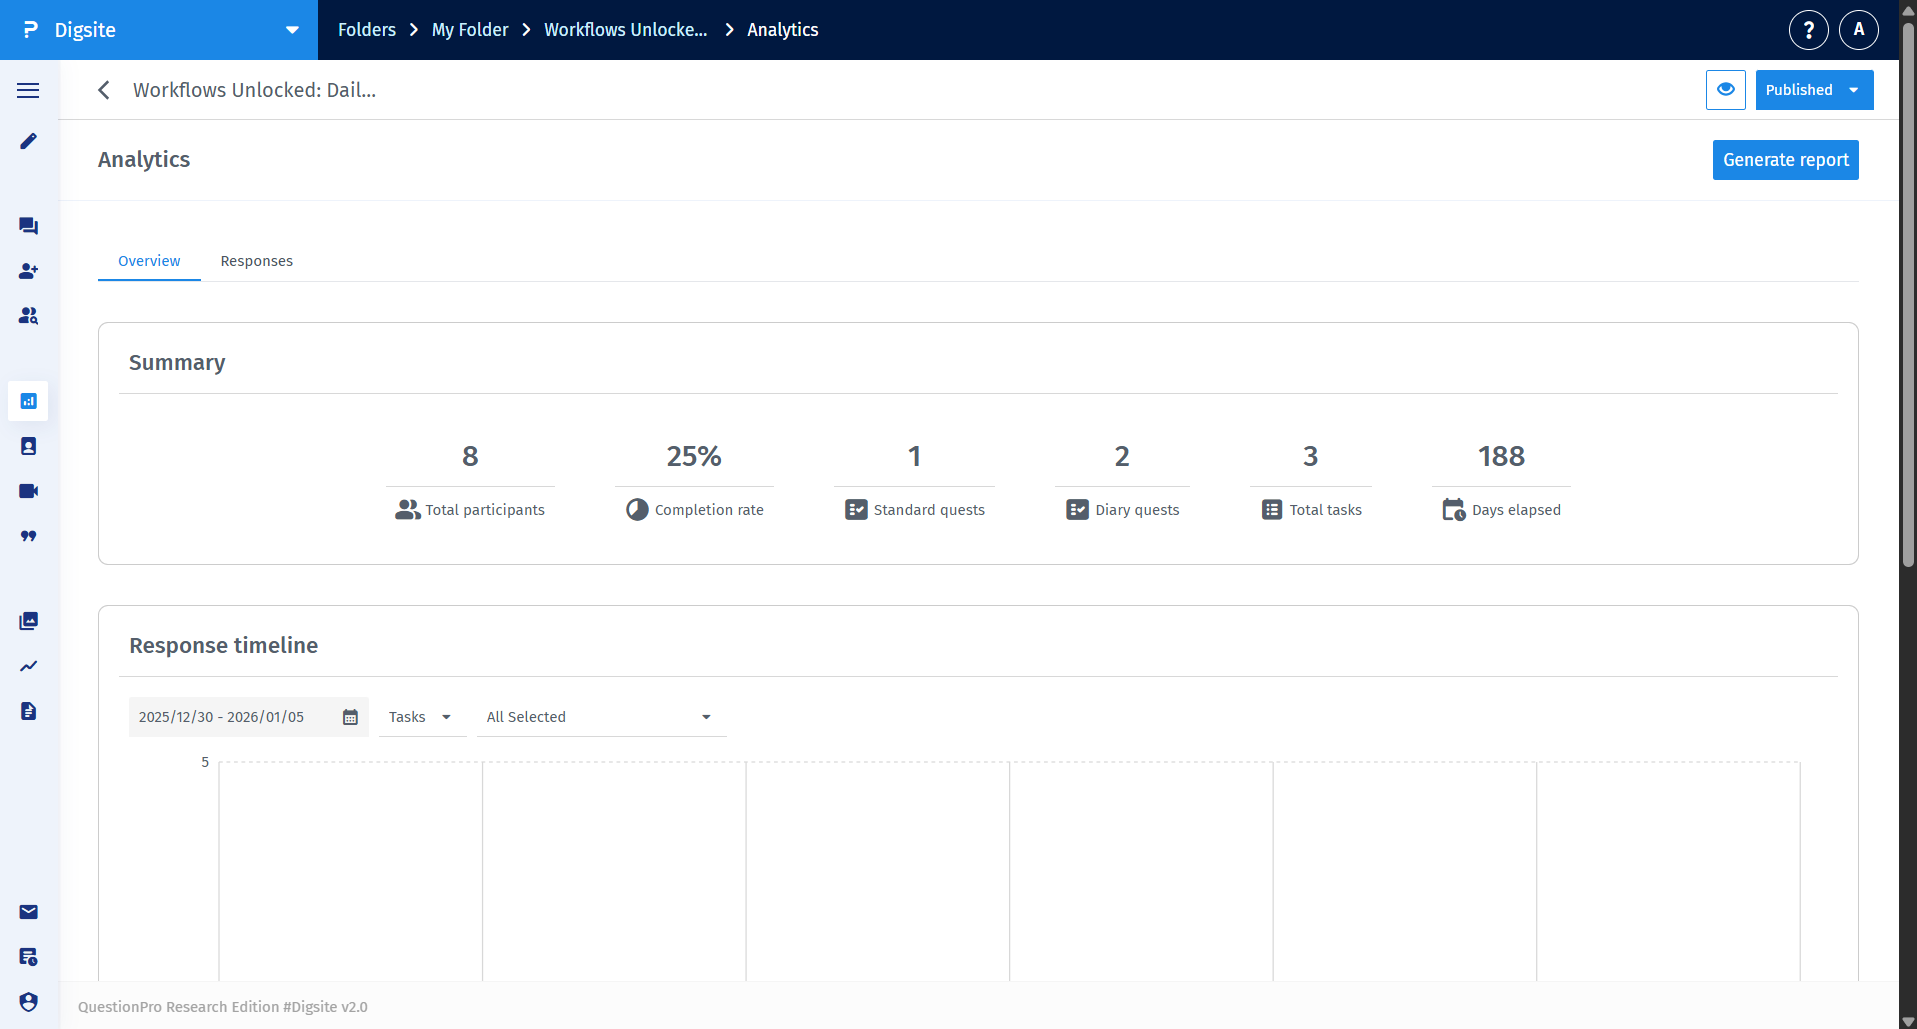
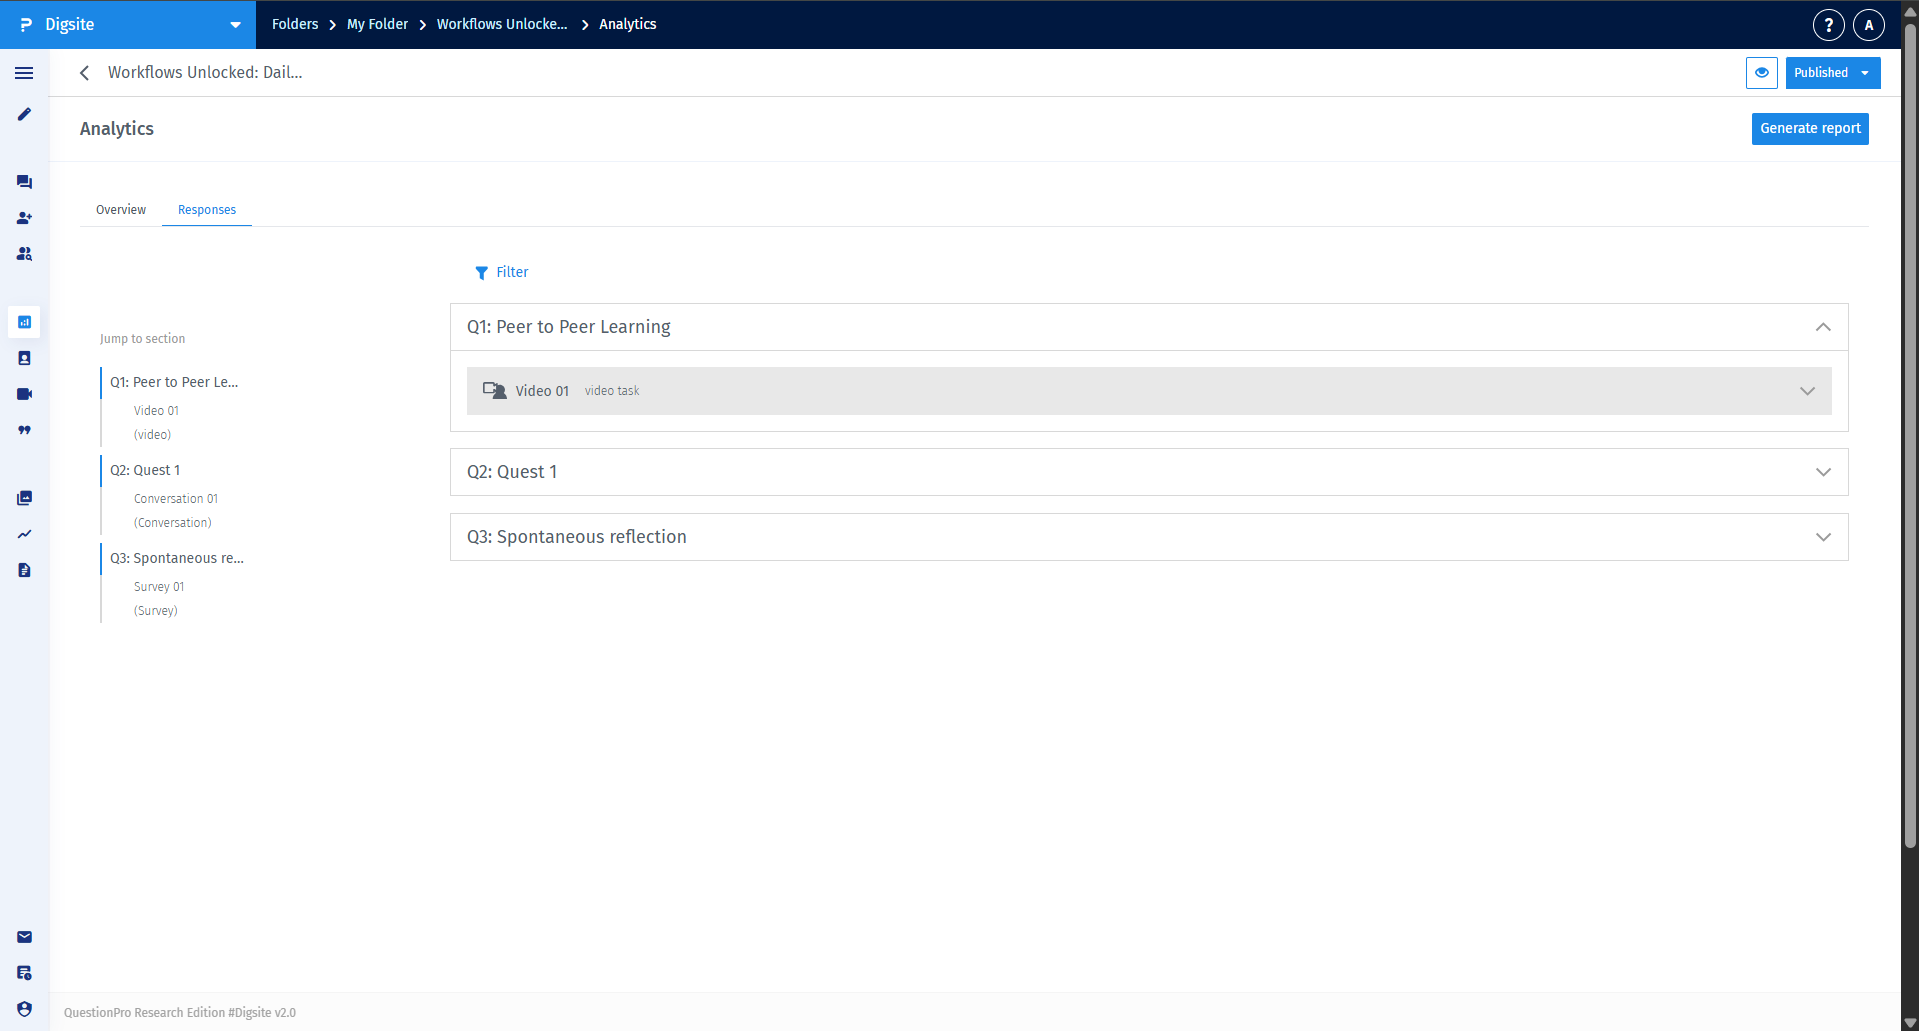
To access your research data, open your study and click the Analytics tab in the left-hand sidebar. This opens the Analytics dashboard, which features two primary views: Overview for aggregate study insights and Responses for detailed, task-by-task data.
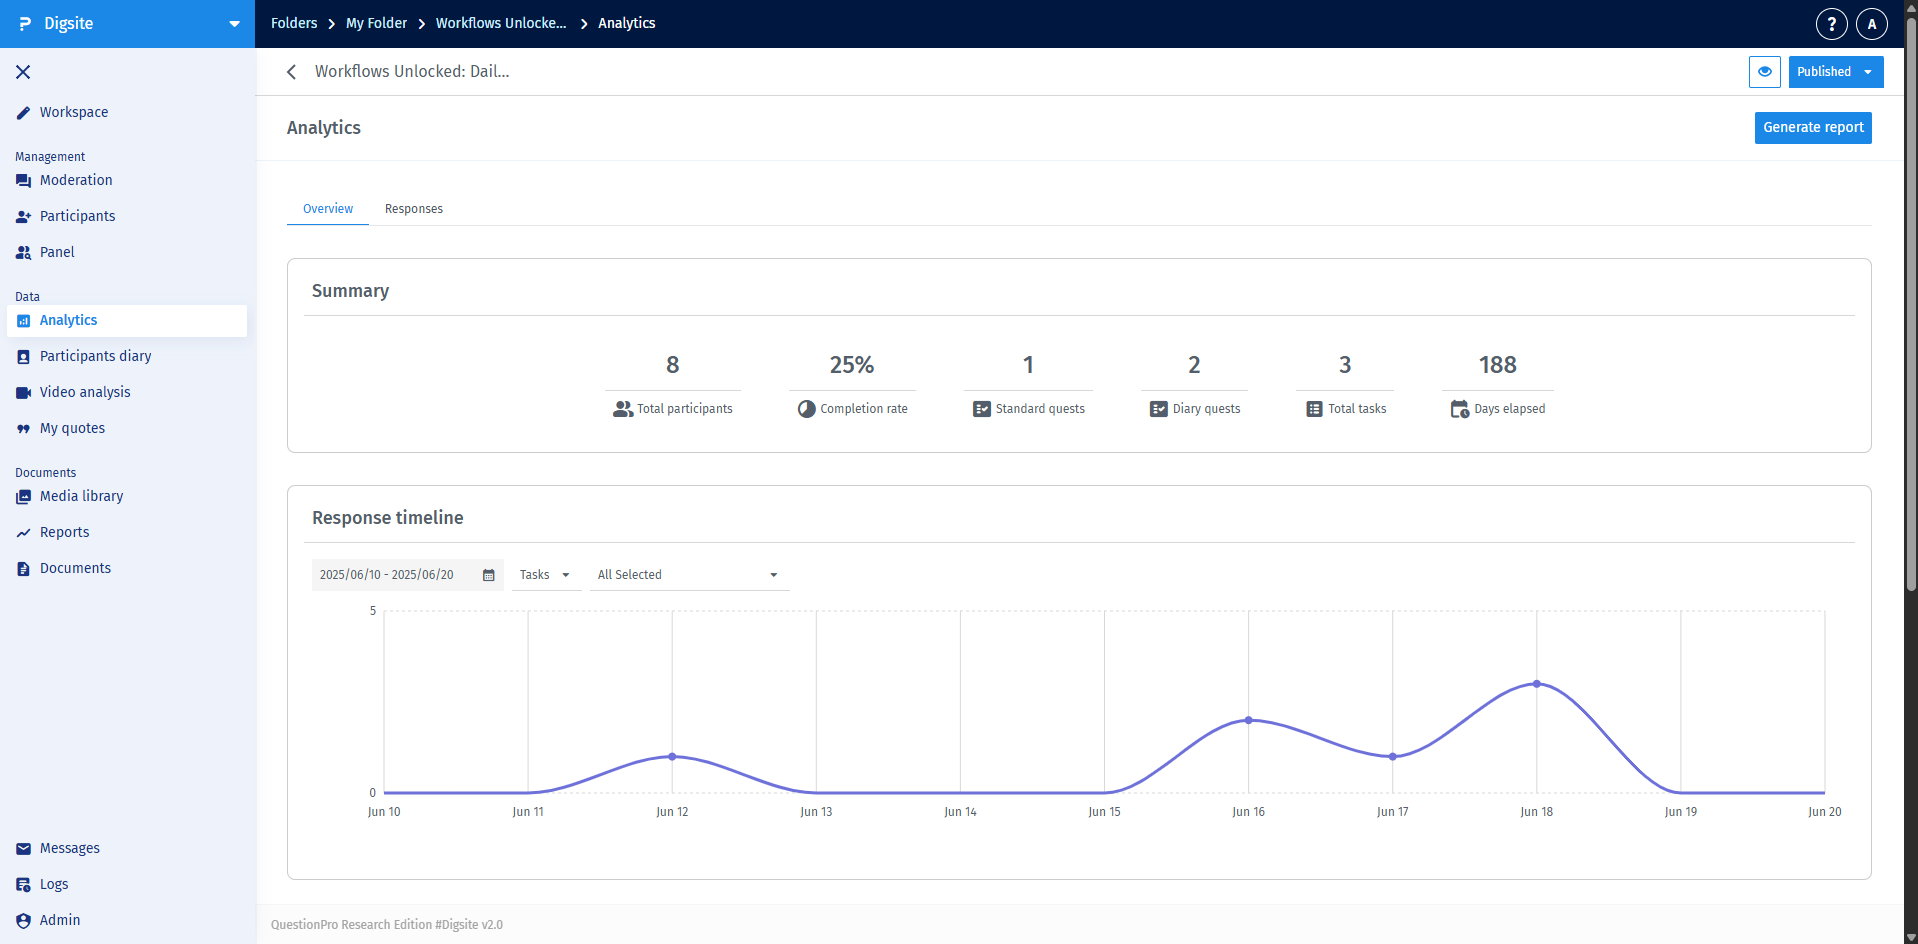
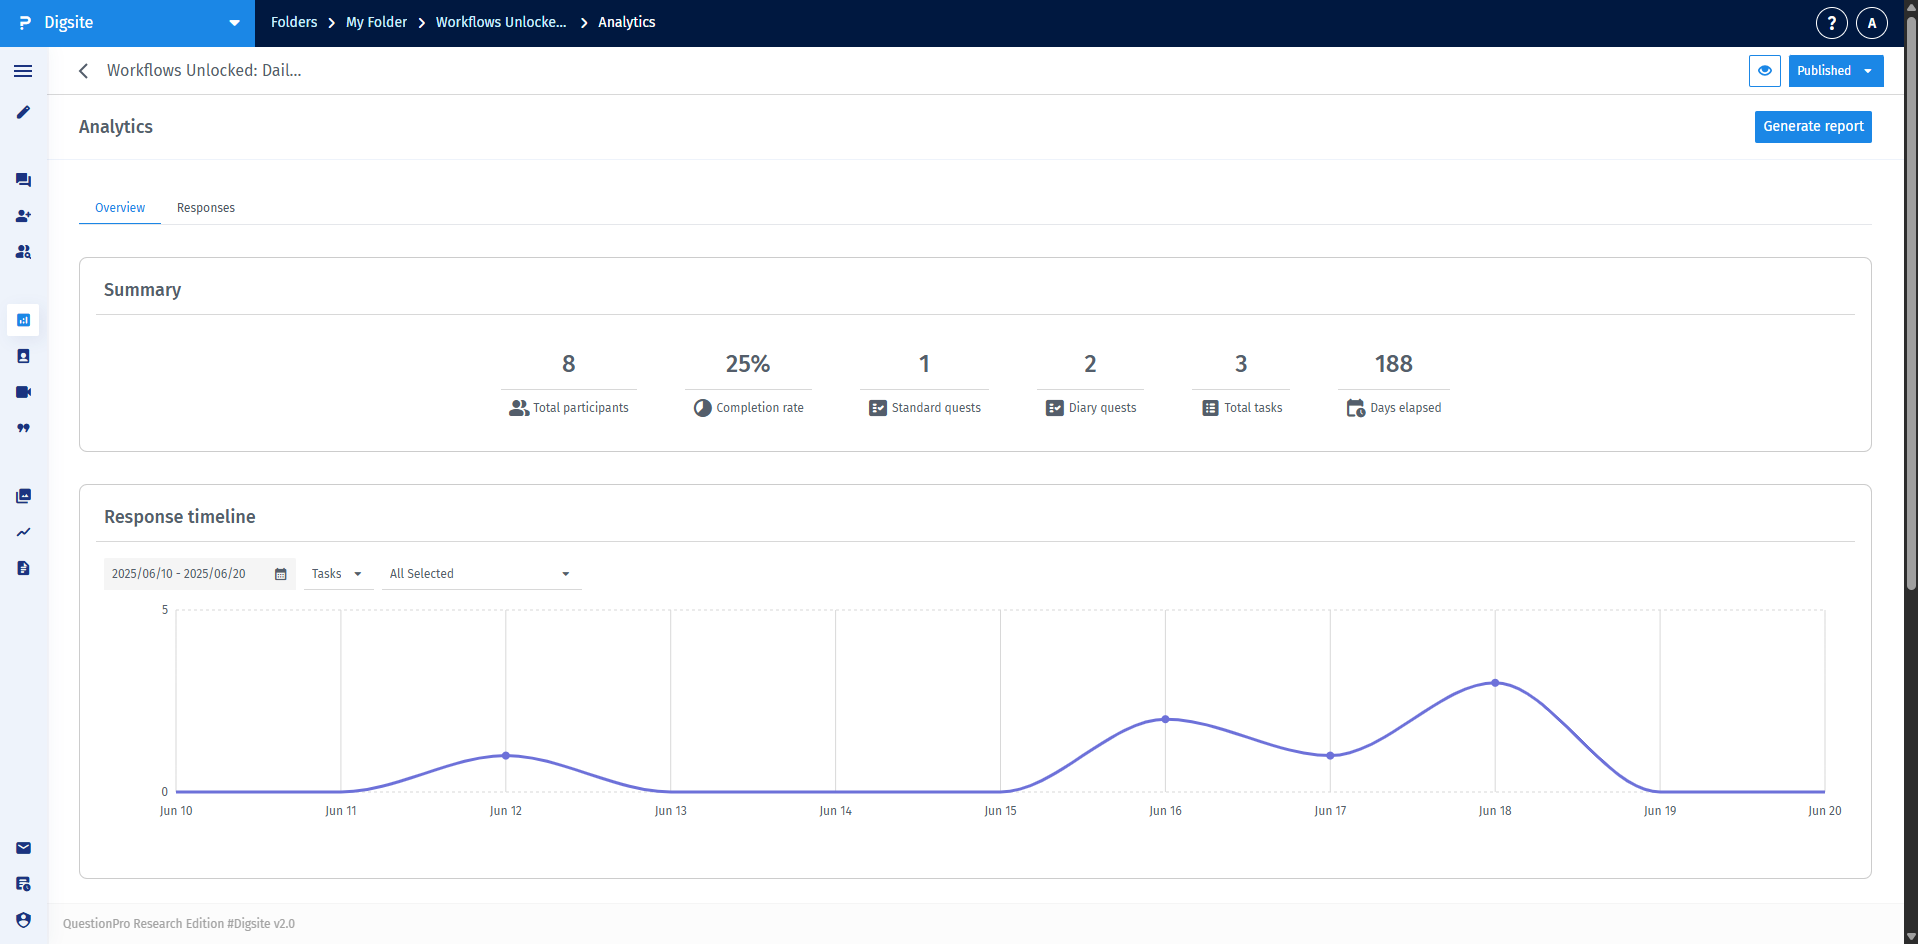
The Overview tab provides study-level metrics through several key cards:
- Summary Card: Displays key metrics including total participants, completion rate, counts of standard and diary quests, total tasks, and days elapsed.
- Response Timeline: A visual representation of participant activity, which can be toggled between daily, weekly, or monthly views.
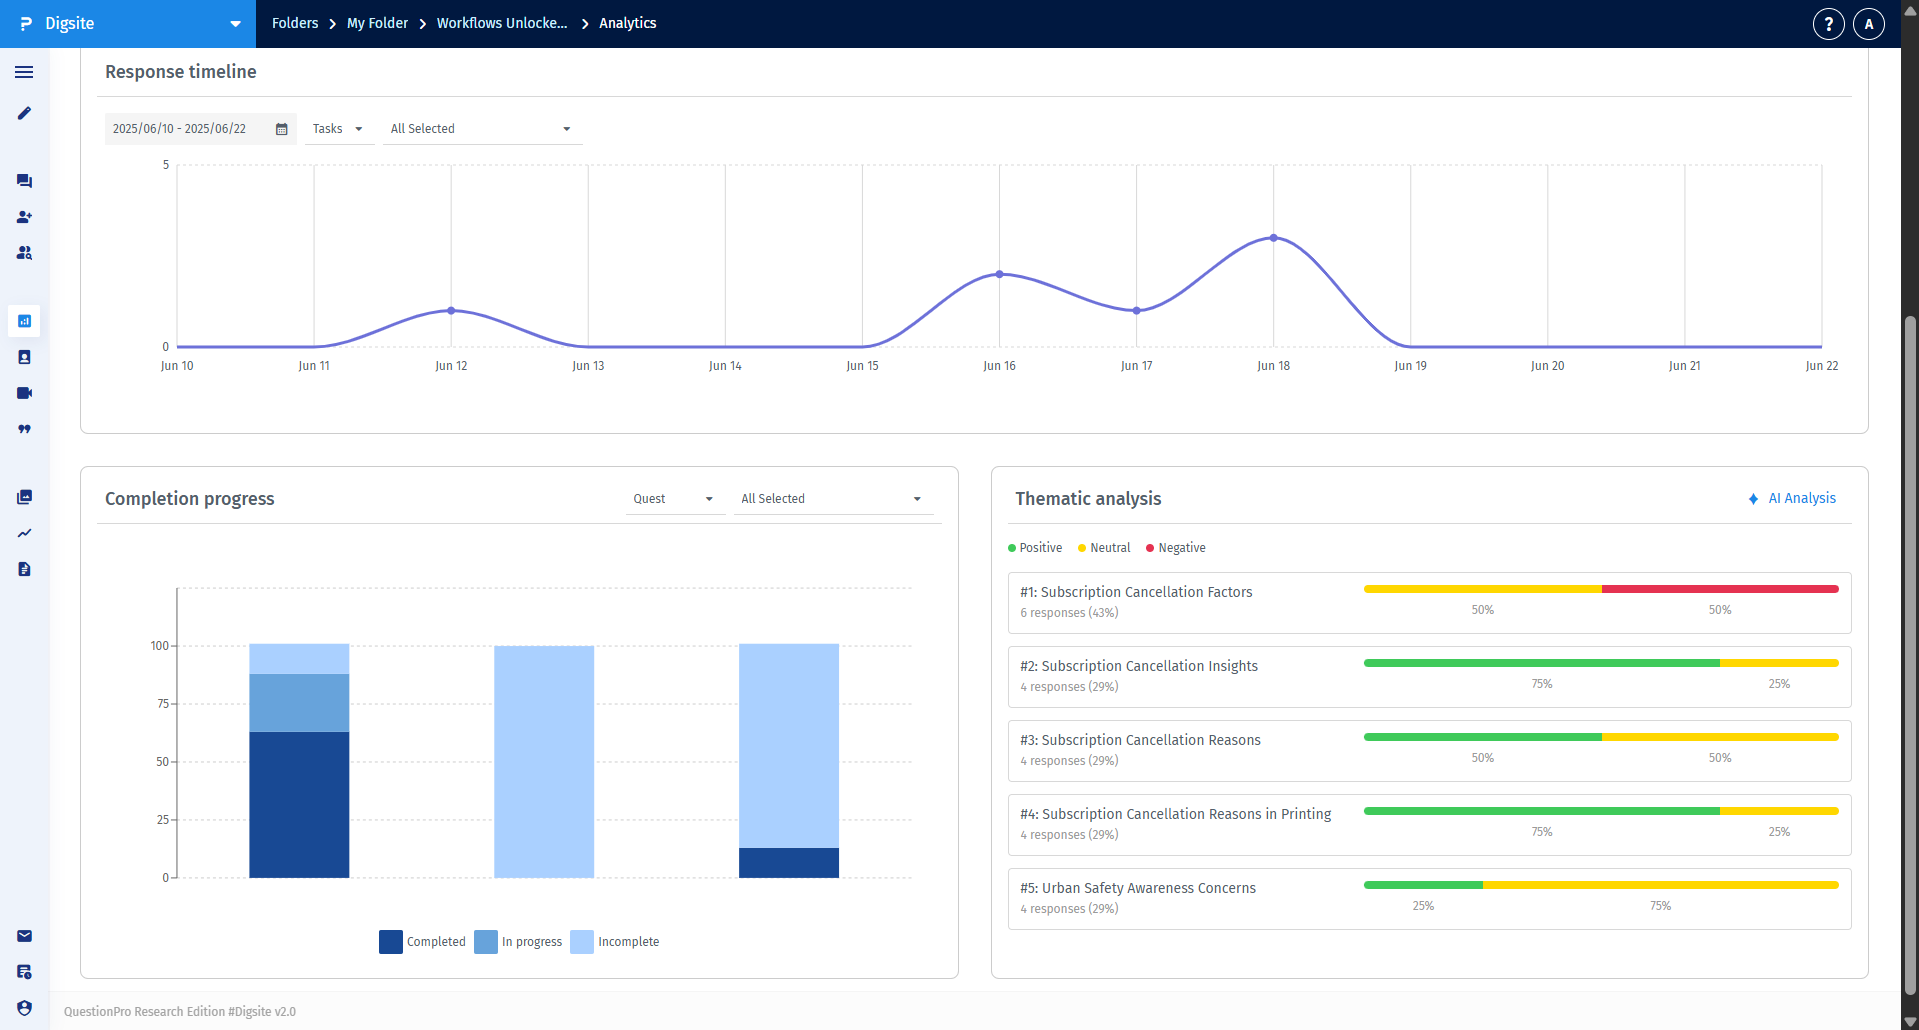
- Completion Progress: Shows the percentage of tasks and quests that are completed, in progress, or incomplete.
- Thematic Analysis: Features AI-powered theme extraction with integrated sentiment analysis across all study responses.
The Response Timeline helps you understand the temporal flow of your study. You can filter by specific tasks or view all responses to identify patterns in engagement and spot any significant surges or drop-offs in participant activity.
Using natural language processing, this feature extracts prominent themes from your study. Each theme card displays the theme title, a brief description, the percentage of responses it appears in, and a sentiment distribution (positive, neutral, or negative).
The Responses tab organizes all submissions by quest and task. Use the left-hand sidebar to navigate through your study structure and apply filters to drill down into specific participant segments or date ranges.
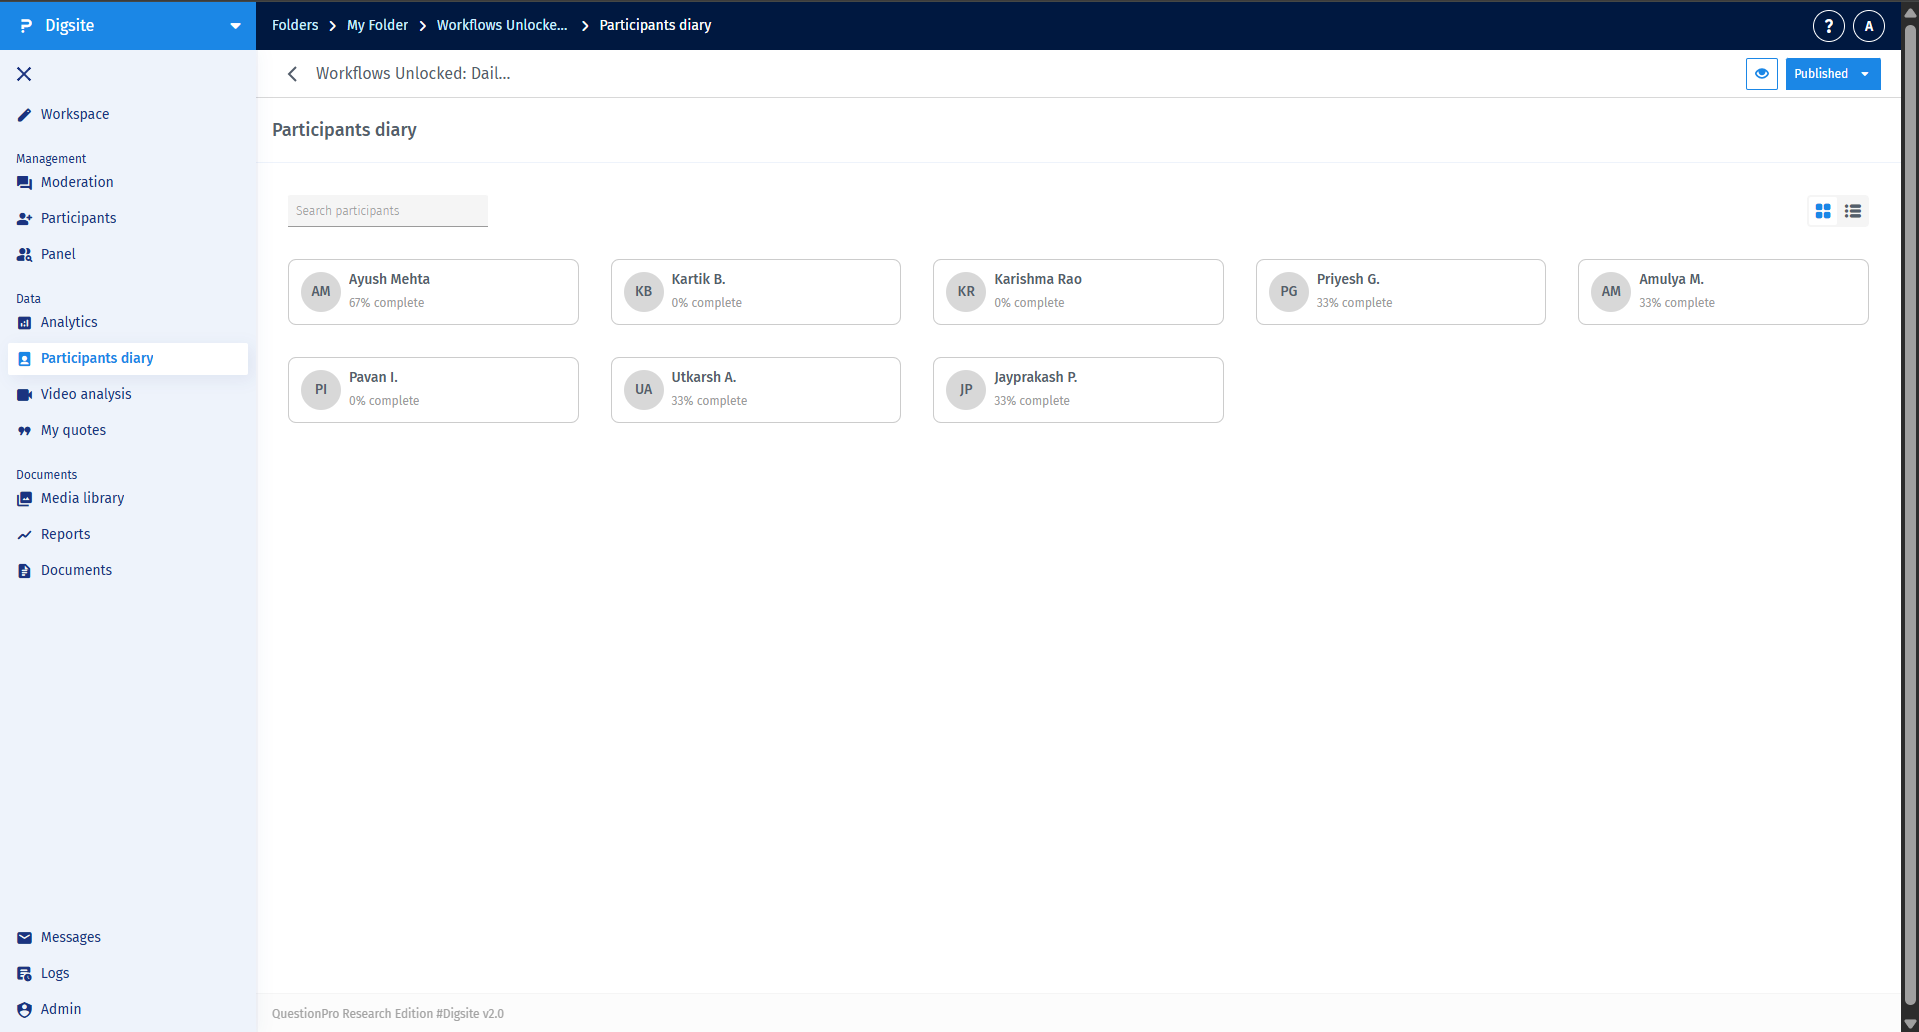
Navigate to the Participant Diaries section in the Analytics sidebar. You can view your participants in a Card view (initials and completion rate) or a List view (names, emails, and login history).
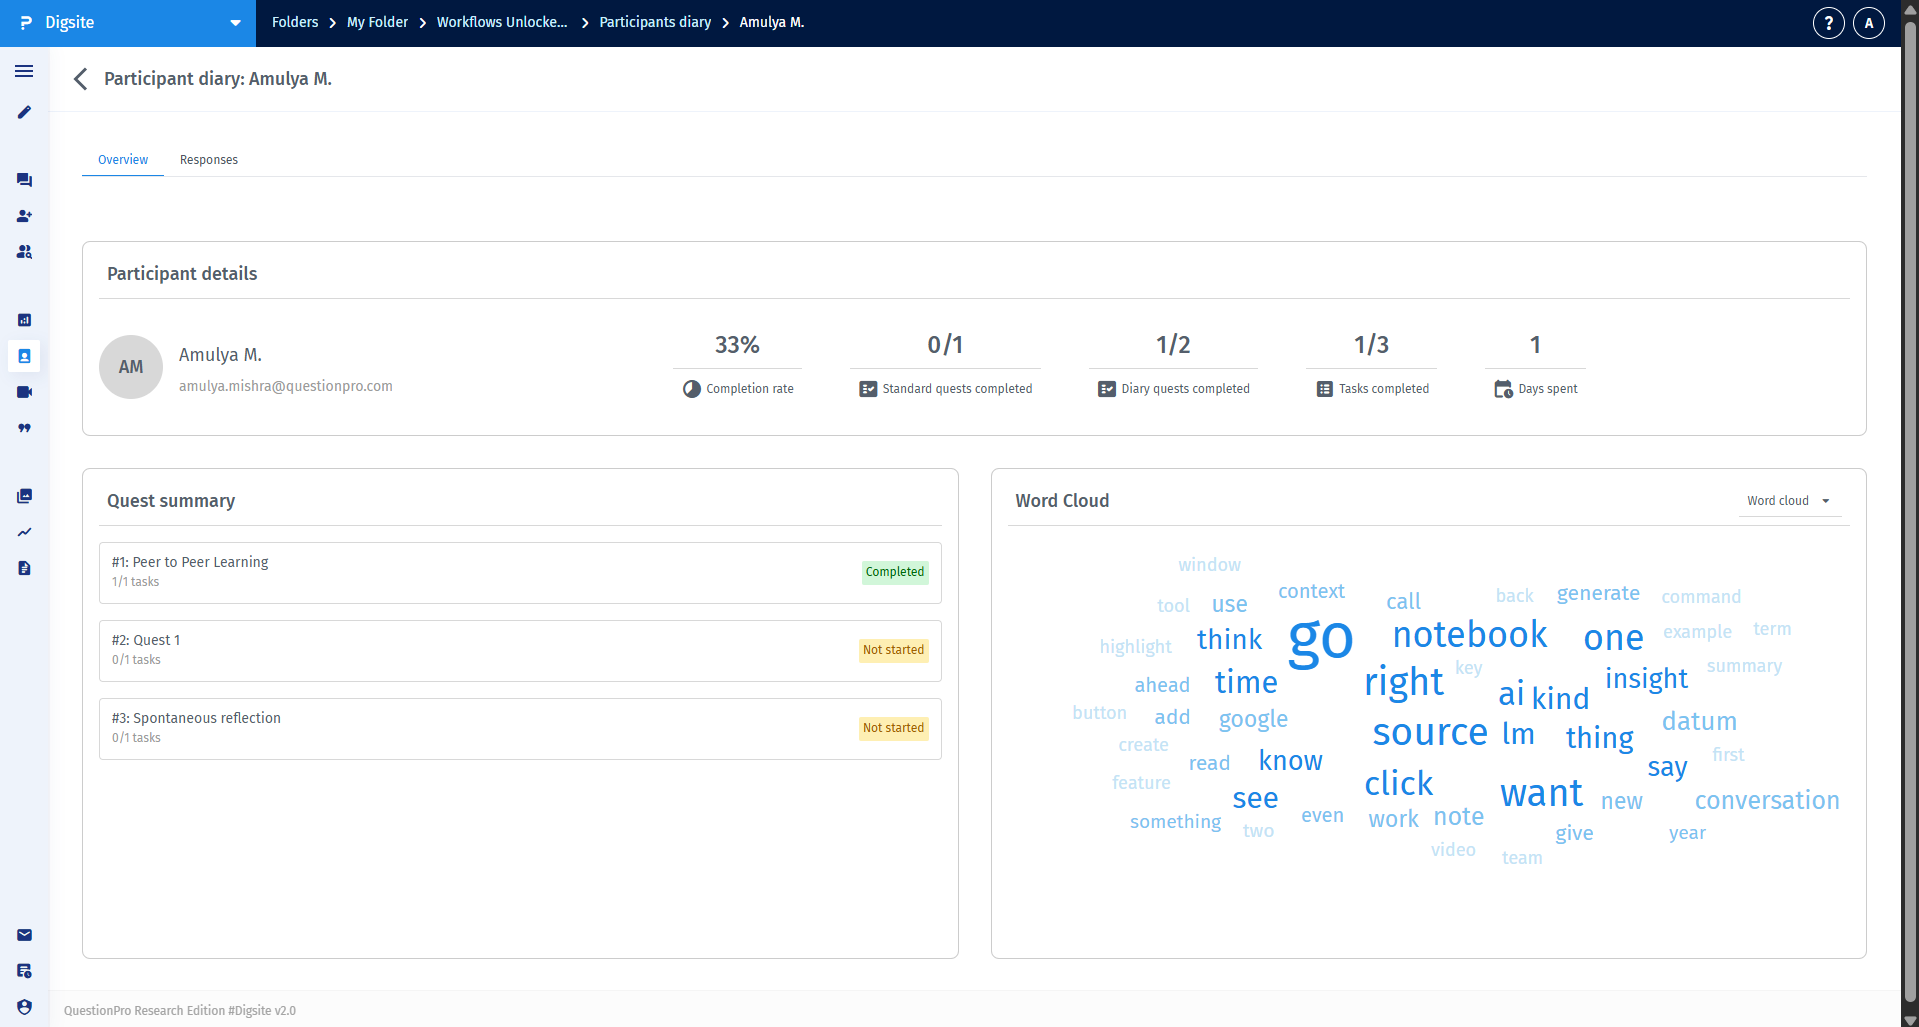
Clicking on a participant's profile provides a holistic view of their journey, including their personal Word Cloud, completion statistics, and a chronological feed of all their media and text responses.
Click the Generate report button in the top-right corner to create downloadable files for stakeholder presentations. You can customize the export by selecting specific quests, participant segments, or response types to ensure the report contains only the most relevant data.