- Moderation
- Usability test: UX Diagnostics
- Sprint View: Usability tests
- Accessible Usability Scale - AUS
- System Usability Scale - SUS
- SUPR-Q
- PSSUQ
- UX Crowd: Usability tests
- AI Insights for Usability Tests
- Self-Reported Success (SRS)
- AI Executive Summaries
- Participant Diaries and Study Analysis
- Image analysis
- Voting task analysis
- Video tasks: Analysis

UX Diagnostics
UX Diagnostics is the primary analysis dashboard for usability studies in QuestionPro UX. It provides visual data and quantitative metrics to help researchers evaluate how easily participants can navigate a product or website.
During study setup, researchers can choose from several industry-standard psychometric tests to measure the user experience:
- SUS (System Usability Scale): A reliable tool for measuring usability.
- SUPR-Q: Measures the quality of the website user experience.
- PSSUQ: Designed to evaluate user satisfaction with computer systems.
- SRS: A specialized scale for service and reliability.
- AUS: An alternative usability scale for quick assessments.
- ALFQ for Webapps: Specifically tailored for assessing the flow and quality of web applications.
The dashboard aggregates these scores alongside Task Usability, Task Completion, Task Duration, and Emotions.
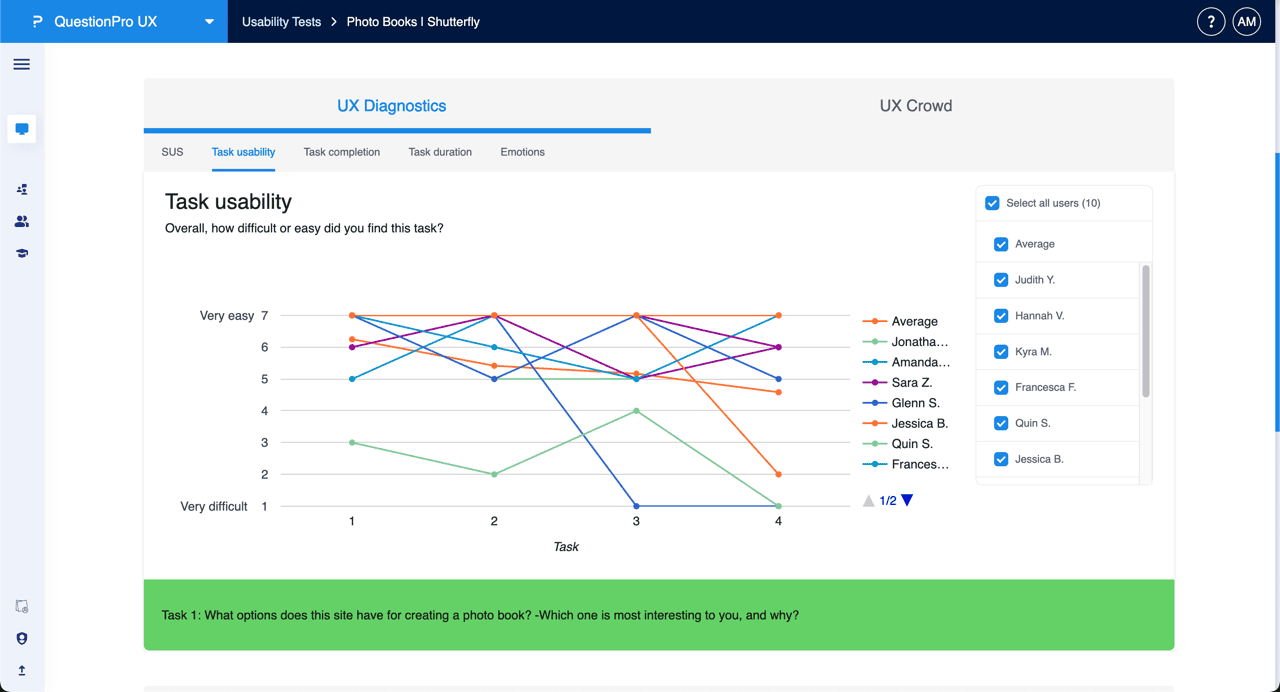
The Task usability tab visualizes participant feedback regarding the difficulty of specific tasks. This section measures responses on a scale from "Very difficult" (1) to "Very easy" (7).
- Individual Performance: A line graph maps each participant's rating across the tasks they performed.
- Average Benchmark: An "Average" line is included to help researchers identify tasks that were perceived as challenging across the user group.
- User Filtering: Use the right-hand sidebar to select or deselect specific users to compare individual experiences against the average.
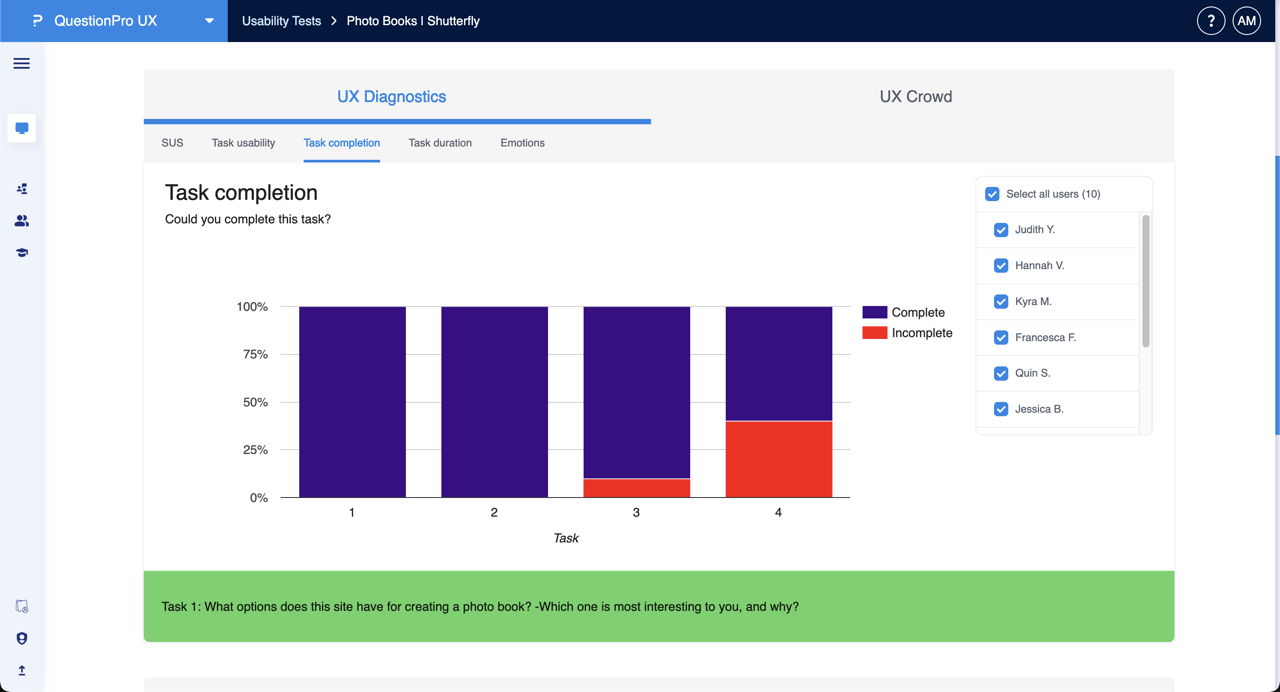
The Task completion tab provides a binary view of success rates for each task in the study.
- Success Visuals: Stacked bar charts show the percentage of participants who successfully completed a task ("Complete") versus those who did not ("Incomplete").
- Friction Points: Researchers can quickly see which tasks had the highest failure rates, indicating potential navigation issues.
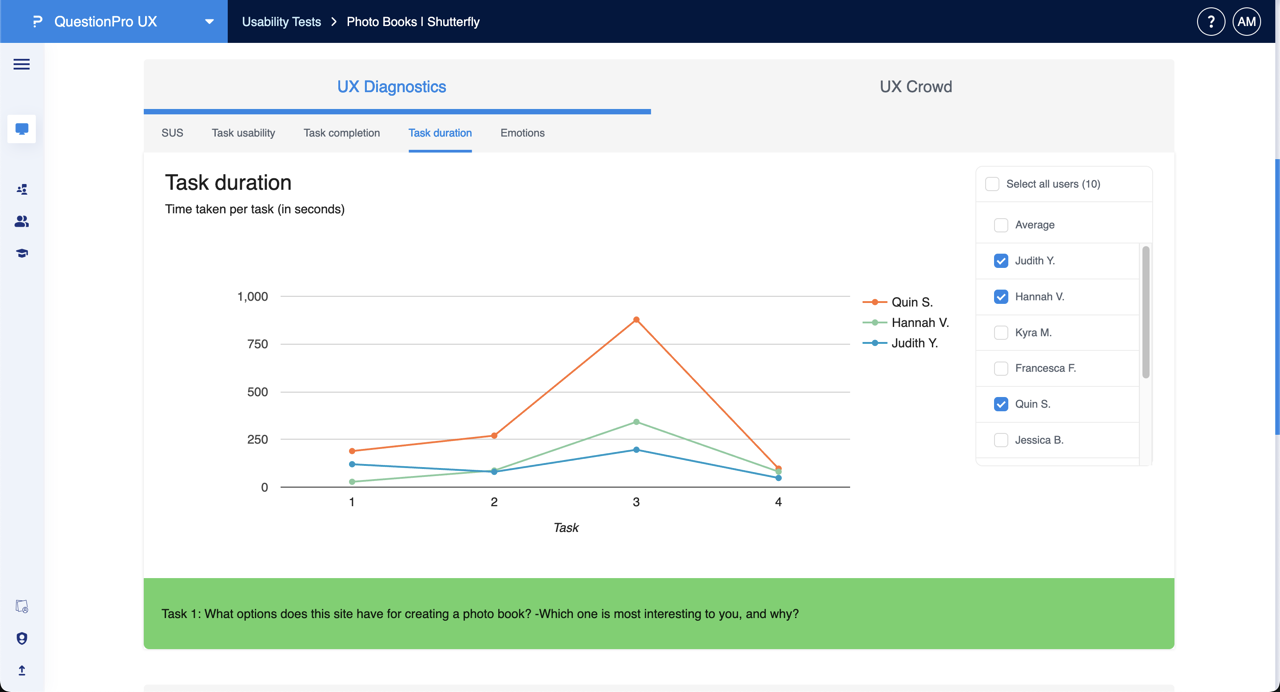
The Task duration tab measures efficiency by tracking the time taken per task in seconds.
- Time Tracking: Line graphs display the duration each selected participant spent on a task.
- Efficiency Benchmarking: Significant peaks in the graph often correlate with tasks that require more cognitive load.
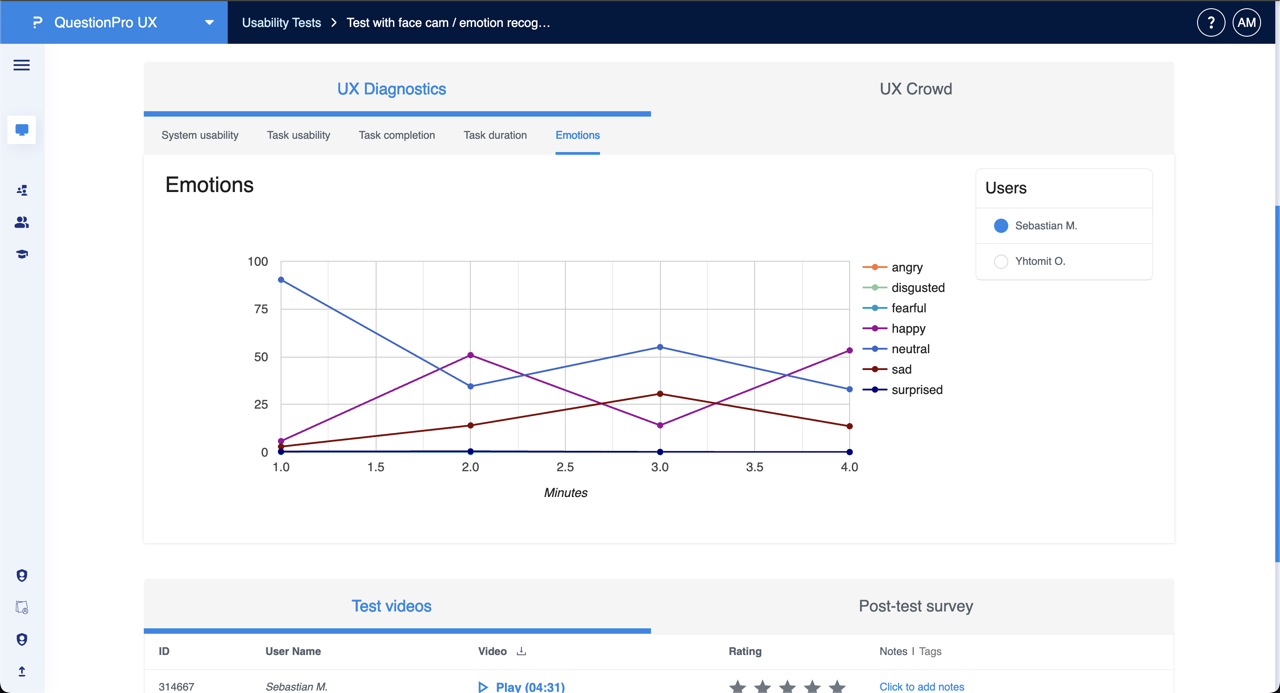
The Emotions tab utilizes face-cam recording and emotion recognition technology to track the participant's affective state during the test.
- Emotion Timeline: A line graph maps emotional states—such as happy, neutral, sad, surprised, fearful, angry, or disgusted—across the duration of the test session.
- Correlation with Tasks: Researchers can pinpoint exactly when a participant felt frustrated or pleased.
- Test Videos: Beneath the graph, the Test videos section allows you to play back specific recordings to see the raw footage behind the data points.