Synthetic monitoring is a performance testing method that uses automated scripts to simulate real user actions, like logging in, searching, or checking out. It runs these simulated journeys on a set schedule, so teams can catch broken logins, slow checkouts, or failed API calls before real customers hit them.
For US businesses, the stakes are real. Gartner’s widely cited downtime benchmark puts the average cost of an outage at $5,600 per minute, or roughly $336,000 per hour. Synthetic monitoring gives teams an early warning system, so a slow checkout page or a broken login gets caught in minutes, not after a wave of support tickets.
In this article, we’ll explore how synthetic monitoring works, how it compares to real user monitoring, and where it fits alongside direct customer feedback.
What is synthetic monitoring?
Synthetic monitoring is active, scheduled testing that uses simulated users to check whether a website, app, or API works, loads fast, and stays available. Instead of waiting for a real visitor to run into a problem, it runs scripted transactions around the clock, even when no one is actively using the site.
Each test follows a script that repeats the same steps a real user would take. A synthetic test might check whether someone can:
- Load a homepage
- Log in to an account
- Search for a product
- Add an item to a cart
- Complete checkout
- Submit a form
- Call an API endpoint
- Access a dashboard
IBM describes synthetic monitoring as a method developers use to simulate user actions and confirm an application still works as expected. That framing holds up well: synthetic monitoring is fundamentally a functionality check, not a real-traffic measurement.
How does synthetic monitoring work?
Synthetic monitoring works by running the same scripted test on a repeating schedule and comparing each result against a performance baseline. When a result falls outside that baseline, it triggers an alert.
- Choose a journey or endpoint to test. Pick a path that matters, like login, checkout, signup, search, or an API response.
- Build the script. Write a test that performs the same steps a real user or system would take.
- Run tests from multiple locations. Test across regions, devices, browsers, or networks to catch regional slowdowns.
- Compare results to a baseline. Use normal load time and availability numbers as the reference point.
- Trigger alerts on failure. Notify engineering, DevOps, or IT the moment a test fails or performance drops.
- Review trends over time. Look for recurring failures, slow pages, or gradual regressions.
The value comes from repetition. If a checkout test passes every ten minutes and suddenly fails, that’s a clear, early signal that something changed.
Synthetic monitoring vs. real user monitoring vs. APM: What’s the difference?
Synthetic monitoring, real user monitoring (RUM), and application performance monitoring (APM) all track digital performance, but they answer different questions. Confusing them leads teams to buy the wrong tool or misread their own data.
| Method | What it measures | Best for |
|---|---|---|
| Synthetic monitoring | Simulated user journeys via scripted tests | Catching issues before real users are affected |
| Real user monitoring (RUM) | Actual session data from real visitors | Understanding what live traffic is really experiencing |
| Application performance monitoring (APM) | Backend code, servers, and infrastructure health | Diagnosing why a slowdown happened inside the system |
Synthetic monitoring and stress testing get confused too. Stress testing floods a system with thousands of simulated users to find its breaking point. Synthetic monitoring runs light, single-user tests continuously, so it barely adds load to production.
Choose synthetic monitoring when you need to test a journey even during low-traffic hours, like overnight or right after a deploy. Choose RUM when you need to know how real conditions, like a slow mobile network in a specific city, are affecting actual customers. As Nielsen Norman Group’s usability research points out, watching real users interact with a product surfaces confusion and friction that a scripted pass-or-fail result cannot capture. Most mature teams run synthetic monitoring, RUM, and APM together.
What are the main types of synthetic monitoring?
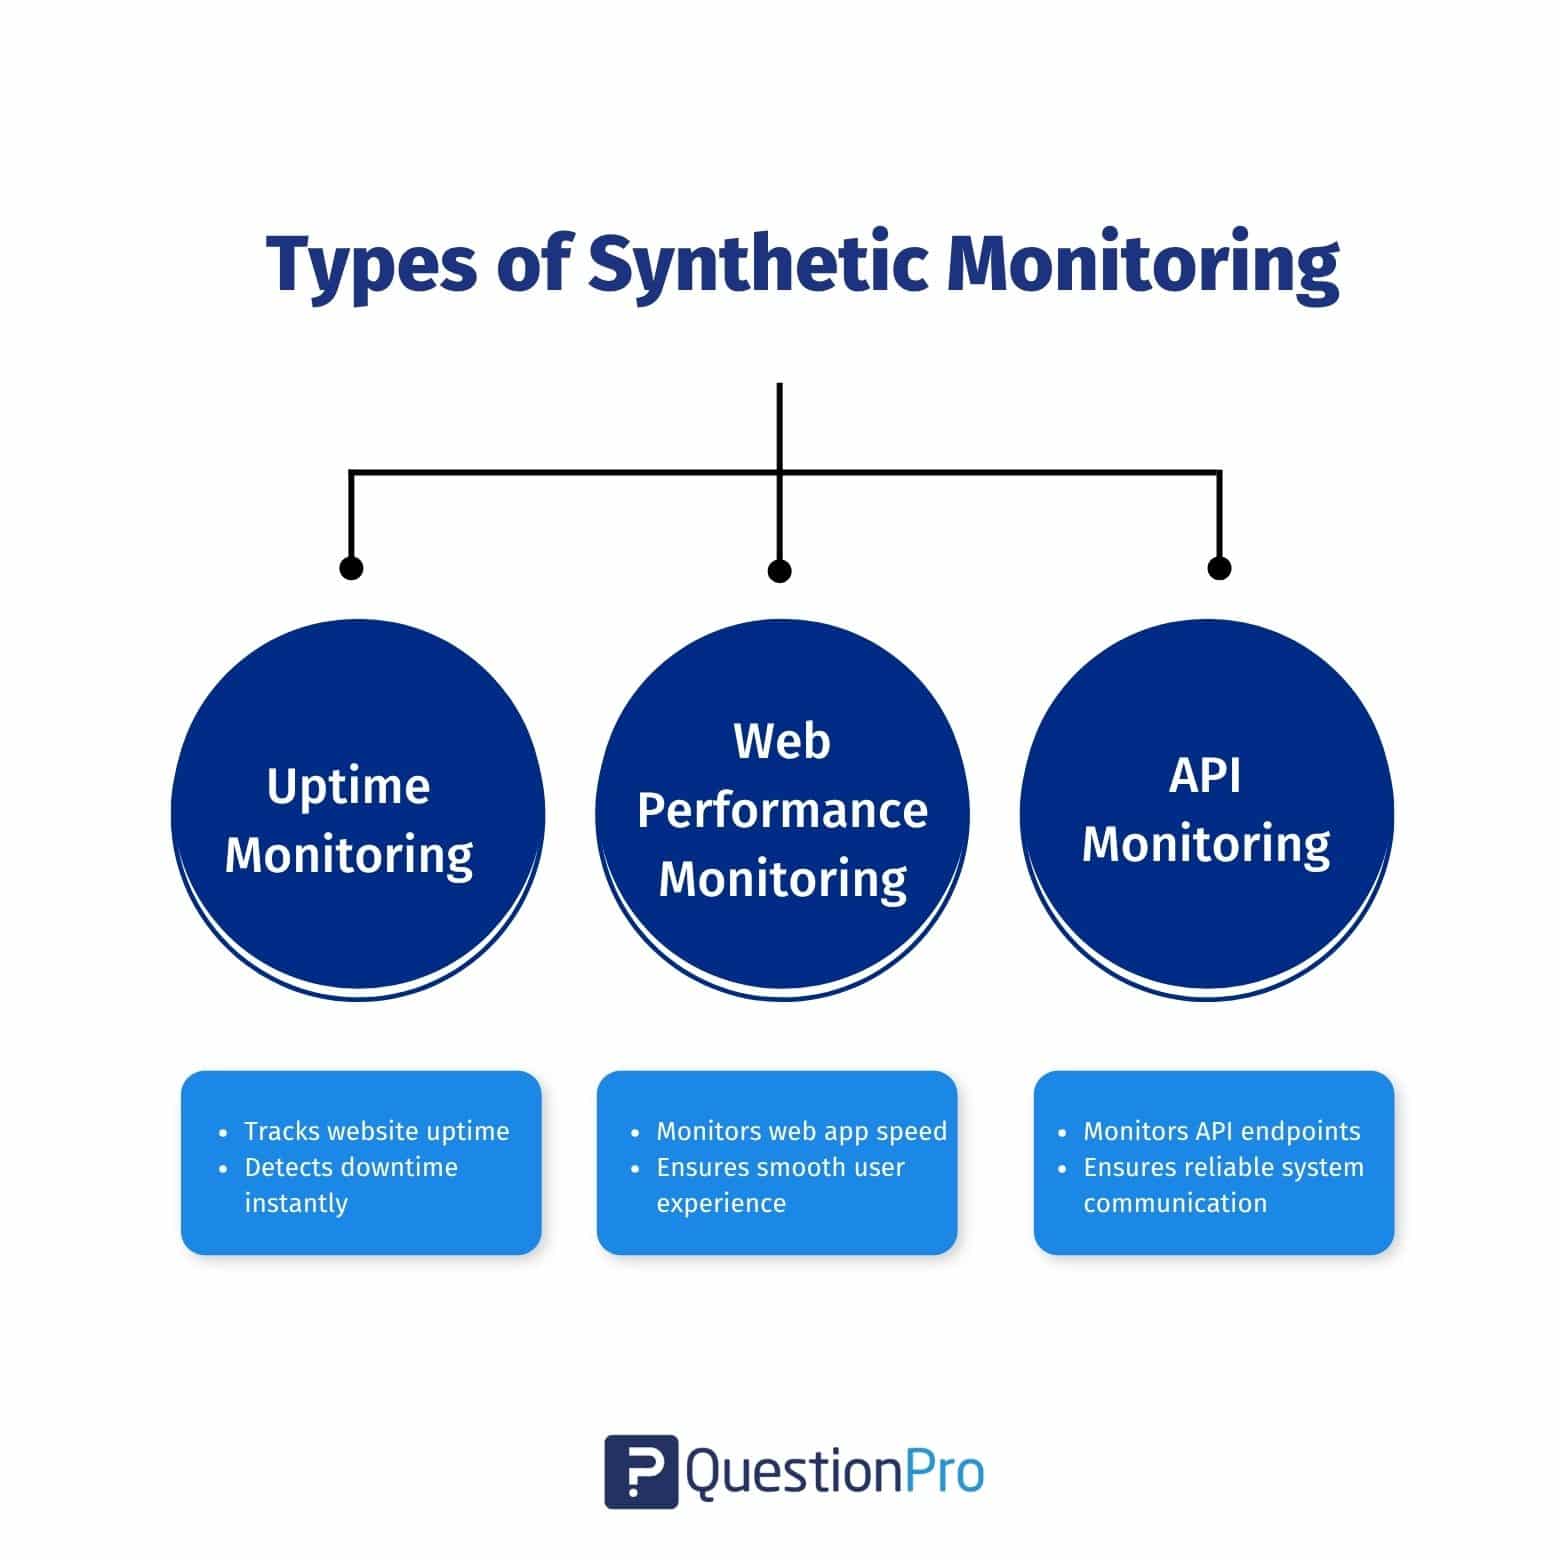
The three main types of synthetic monitoring are uptime monitoring, web performance monitoring, and API monitoring. Each one checks a different layer of the experience.
1. Uptime monitoring
Uptime monitoring checks whether a website, app, server, or service is reachable. It runs simple checks at set intervals and alerts the team when something goes down.
Best for: availability checks and downtime alerts.
Example: A test pings your homepage every five minutes to confirm it loads.
2. Web performance monitoring
Web performance monitoring checks how fast and reliably pages load. It measures page load time, response time, and whether key elements render correctly.
Best for: Age speed, full user journey testing, and digital experience monitoring.
Example: A test opens a pricing page, searches for a product, and completes checkout, timing every step along the way.
3. API monitoring
API monitoring checks whether an application programming interface, or API (a connection that lets two software systems exchange data), responds correctly and quickly. It often includes HTTP checks, SSL certificate checks, DNS checks, and multi-step workflow tests.
Best for: Confirming that backend connections and integrations stay healthy.
Example: A test calls a payment API and confirms it returns the correct response within the expected time.
Real-world examples of synthetic monitoring in action
Synthetic monitoring becomes easier to picture with a few concrete scenarios. Here’s how it plays out across common US business types.
- E-commerce.
A release breaks the “add to cart” button on mobile. A scripted checkout test fails within minutes, well before peak holiday traffic hits the site.
- SaaS.
A login page stops working in one specific browser after a CSS update. A cross-browser synthetic test flags the exact browser affected, so engineers don’t have to reproduce it manually.
- Financial services.
A new fraud-check integration slows down the payment API. A scheduled API test catches the delay before it shows up as abandoned transactions.
Pairing these tests with customer satisfaction surveys after a checkout or signup flow confirms whether a fix actually restored customer confidence, not just uptime.
What metrics should you track with synthetic monitoring?
The right metrics turn synthetic monitoring from a pass-or-fail alert into a real measurement of digital experience.
- Uptime percentage: The share of scheduled checks that succeeded, usually tracked against a 99.9% or higher target
- Response time: How long a page, API, or transaction takes to respond
- Time to first byte (TTFB): How quickly the server sends the first byte of data back to the browser
- Transaction success rate: The percentage of scripted journeys, like checkout or signup, that complete without error
- Error rate: How often a test returns an error code or unexpected result
Track these numbers over weeks, not single test runs, to separate a one-time blip from a real regression.
What are the benefits of synthetic monitoring?
Synthetic monitoring helps teams catch problems early and protect the journeys that matter most to revenue and trust.
| Benefit | Why it matters |
|---|---|
| Catches issues before customers report them | Scheduled tests run around the clock, even with no live traffic |
| Confirms uptime and availability | Alerts fire the moment a service goes down |
| Tests critical journeys | Login, checkout, and search get verified on a schedule |
| Compares performance across regions | Reveals whether users in specific areas face slower load times |
| Speeds up troubleshooting | Alerts point directly to the failing step, cutting investigation time |
| Supports faster, safer releases | Teams catch regressions right after a deploy, not days later |
Fewer failed checkouts and faster fixes tend to show up directly in customer experience management scores, since a broken journey is one of the fastest ways to lose a customer’s trust.
What are common synthetic monitoring mistakes and risks?
Synthetic monitoring fails to deliver value when teams set it up once and stop paying attention. A few mistakes show up again and again.
- Testing too many paths at once.
Scripting every possible path isn’t realistic, and it turns maintenance into a full-time job. Start with the handful of journeys that carry the most revenue or risk.
- Ignoring script maintenance.
A small interface change, like a renamed button, can break a script even when the application itself works fine. Scripts need updates every time the flow changes.
- Setting alert thresholds too tight.
Overly strict thresholds create alert fatigue, and teams eventually start ignoring notifications altogether.
- Treating synthetic data as the full picture.
Synthetic tests can’t capture every device, browser, network, or behavior pattern a real customer might use. Employee experience feedback from the IT or engineering team running the tests often reveals where synthetic coverage falls short before it becomes a customer-facing problem.
How do you get started with synthetic monitoring?
Start with the journeys that matter most, not everything at once.
- List your critical journeys. Focus on login, checkout, signup, search, payment, or key API workflows.
- Choose what to measure. Track availability, response time, page load time, error rate, and transaction success.
- Select test locations. Pick regions where your customers or internal teams are active.
- Set alert thresholds. Define what counts as slow, down, or failed for your team.
- Build reports. Track trends over time instead of reacting to single failures.
- Update tests regularly. Revisit scripts whenever the application changes.
When evaluating a synthetic monitoring tool, look for scheduling flexibility, multi-location and cross-browser testing, API checks, clear alerting, and integrations with the incident management tools your team already uses. Pairing that setup with website feedback surveys gives you a second signal: whether visitors actually notice the difference once fixes go live.
How can QuestionPro add the human feedback layer to synthetic monitoring?
Synthetic monitoring confirms whether a journey technically works. It doesn’t always confirm whether that journey feels easy to a real person.
A synthetic checkout test might pass every time, while actual customers still find the flow confusing or slow. The QuestionPro UX platform helps teams close that gap by collecting website, app, and product feedback directly from real visitors, then comparing it against monitoring data.
Teams commonly pair synthetic monitoring insights with:
- Website feedback surveys
- App experience surveys
- Customer satisfaction surveys
- Feature-specific pain point surveys
QuestionPro isn’t a replacement for a synthetic monitoring platform. Used through QuestionPro’s survey software, it adds the human layer that scripted tests can’t capture on their own.
Scripted tests find problems. Real users confirm what they mean
Synthetic monitoring gives teams an early, repeatable signal across the journeys that matter most. It can’t replace watching how real customers actually experience a product, but it can catch failures before those customers ever notice them.
The strongest setups run synthetic tests, real user monitoring, and direct customer feedback side by side. Each one fills a gap the others leave open.
Frequently Asked Questions (FAQs)
Pricing varies widely by vendor, test volume, and number of locations monitored. Most platforms charge based on check frequency and the number of scripted transactions, ranging from free tiers for basic uptime checks to enterprise plans for multi-region, multi-step testing.
Most teams run critical journey tests, like login or checkout, every one to five minutes, and less critical pages every fifteen to thirty minutes. Frequency should match how quickly a failure would hurt revenue, support volume, or customer trust.
No. Synthetic monitoring checks whether known, scripted journeys keep working after launch, while QA testing explores new features, edge cases, and usability before release. They cover different stages of the same product lifecycle.
No. Small and mid-size US businesses often feel downtime costs proportionally harder, since fewer support staff have to absorb the same spike in complaints. Many synthetic monitoring tools offer free or low-cost plans built for smaller teams.
A failed test triggers an alert to the responsible team, usually through email, Slack, or an incident management tool. The team then checks logs, recent deploys, and infrastructure health to confirm whether it’s a real issue or a false alert.