




NPS in the banking industry looked like a quiet success story for years. That streak broke in 2026.
QuestionPro’s own U.S. benchmark tracking shows banking and credit union NPS fell to 19 in the first quarter of 2026, the lowest score of any industry measured that quarter. A year earlier, banking sat at 41, one of the strongest sectors in the country.
This article breaks down what changed, what counts as a good NPS score for a bank today, which institutions are gaining or losing ground, and how banks measure and improve loyalty in a harder 2026 environment. We’ll also cover how NPS differs from CSAT and CES, two metrics banks increasingly track alongside it.
What is NPS in the banking industry?
NPS in the banking industry is the score a bank or credit union earns by asking customers how likely they are to recommend it, then subtracting the share of unhappy respondents from the share of loyal ones.
Net Promoter Score (NPS): a customer loyalty metric scored from -100 to 100, calculated by subtracting the percentage of detractors from the percentage of promoters.
Banks ask a single question: “How likely are you to recommend [Bank X] to a friend or colleague?” Customers respond on a scale from 0 to 10.
Responses sort into three groups:
- Promoters (9-10): loyal customers who actively refer others
- Passives (7-8): satisfied customers who rarely refer anyone and switch easily
- Detractors (0-6): unhappy customers who discourage others from banking there
NPS equals the percentage of promoters minus the percentage of detractors. A bank where every customer is a promoter scores 100. One where every customer is a detractor scores -100. Most banks land somewhere in between, and where they land has shifted sharply over the past year.
Net Promoter Score as a methodology works the same way across every industry. What changes is the benchmark banks are expected to hit.
What’s a good NPS score for banks in 2026?
A good NPS score for a bank in 2026 is above 30, but the sector average has dropped well below that line for the first time in the benchmark’s history.
The table below tracks the industry average over the past year.
| Quarter | Banking & credit unions NPS |
|---|---|
| Q1 2025 | 41 |
| Q4 2025 | 26 |
| Q1 2026 | 19 |
As a general rule, NPS scores fall into four bands:
- Above 50: excellent, world-class loyalty
- 30 to 50: good, strong customer advocacy
- 0 to 30: acceptable, with clear room to improve
- Below 0: poor, urgent attention needed
At 19, the current banking average sits in the lower half of the “acceptable” band and is drifting toward “poor.” That’s a steep fall from the “good” territory the industry held for most of 2025, based on QuestionPro’s CX Benchmarks report, which has tracked NPS alongside CSAT (customer satisfaction) and CES (customer effort) across U.S. industries every quarter since Q1 2025.
Why is banking NPS falling in 2026?
Banking NPS is falling in 2026 because rate pressure, fee increases, and digital friction are converging at the same time customers have more ways to leave.
Rising interest rates have pushed banks to tighten lending and raise fees, and collections activity typically increases in the months after the holiday spending season. Those pressures land hardest on detractors, who are already primed to switch.
Customers are also acting on that frustration. According to JD Power’s 2026 U.S. Retail Banking Satisfaction Study, the average retail banking customer now keeps deposit accounts open at three different institutions, and one in five customers moved money away from their primary bank within the past three months.
Digital account management and issue resolution timelines add to the problem. When a dispute or account change takes several days to resolve, that friction shows up directly in NPS scores, since detractors overwhelmingly cite slow or confusing service as their reason for a low rating.
The scale of the drop also matters. A bank losing a handful of NPS points quarter over quarter is normal. Banking losing 22 points in a year, as the sector average did between Q1 2025 and Q1 2026, points to something structural rather than seasonal noise. That structural shift is exactly why relying on last year’s benchmark to judge this year’s performance can be misleading.
NPS benchmarks by bank: Who’s winning and who’s losing
NPS benchmarks by bank vary widely in 2026, with community-focused institutions pulling further ahead of national brands.
| Institution | Q1 2026 NPS | Change from Q4 2025 |
|---|---|---|
| Local credit unions | 47 | Up from 20 |
| Capital One | 21 | Down from 49 |
| USAA | 19 | Down from 56 |
| U.S. Bank | -10 | Negative |
| PNC Bank | -12 | Negative |
Figures come from the same Q1 2026 CX Benchmarks report cited above. Local credit unions’ NPS performance jumped from 20 to 47 in a single quarter, leading the entire sector on loyalty, satisfaction, and ease of experience. Smaller membership bases and more personalized service appear to be paying off just as larger banks struggle.
Capital One’s NPS fell from 49 to 21, and USAA dropped from 56 to 19. Both had been standout performers, which shows that even loyalty leaders are not protected from sector-wide rate and fee pressure. U.S. Bank and PNC posted negative scores, meaning more customers would actively discourage others from banking there than would recommend it.
The pattern points to a familiar dynamic in banking. Large national brands often keep customers through convenience and inertia rather than genuine enthusiasm, so when fees rise or service slips, those customers have little emotional loyalty left to fall back on. Credit unions and smaller institutions tend to carry more goodwill going into a rough quarter, which gives them room to absorb a bad experience without losing the relationship entirely.
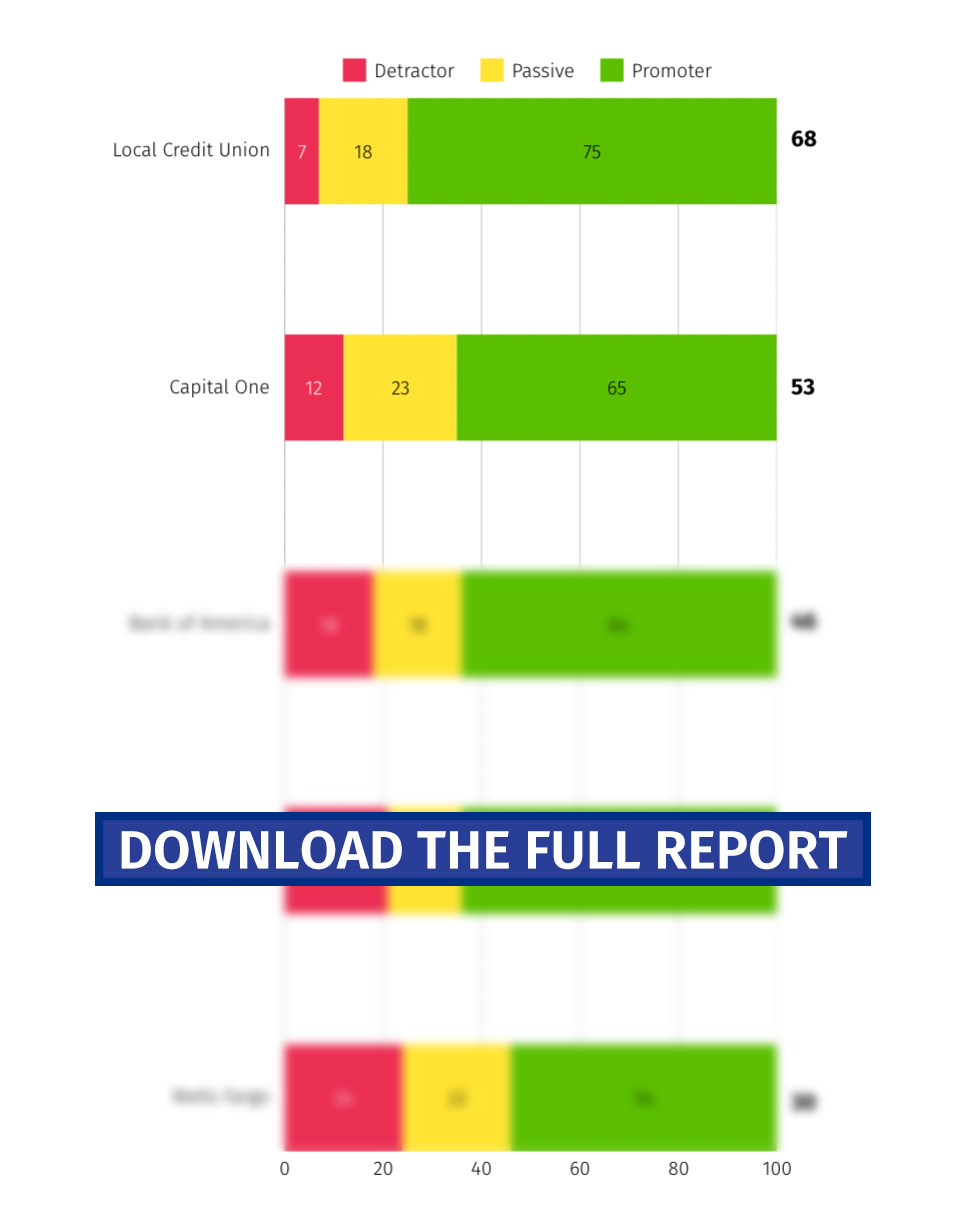
These insights come from QuestionPro’s latest study, which surveyed 1,000 participants to measure NPS across leading companies and industries. The report is based on real customer feedback from Q1 2025 and is updated quarterly.
We invite you to download the full report. It’s a valuable resource for evaluating your company’s performance and determining your customers’ perceptions of you.
NPS vs. CSAT vs. CES in banking: What’s the difference?
NPS, CSAT, and CES measure three different things, and banks that track only one are missing part of the picture.
- NPS (Net Promoter Score) measures long-term loyalty: would this customer recommend the bank to someone else.
- CSAT (Customer Satisfaction Score) measures satisfaction with one specific interaction, like a branch visit or a support call.
- CES (Customer Effort Score) measures how much work a customer had to put in to get something done, like resolving a dispute or opening an account.
A customer can rate a single call highly on CSAT while still scoring the bank low on NPS, if that call resolved one problem but did nothing to rebuild overall trust. That’s why QuestionPro’s 2026 benchmark tracks all three metrics side by side rather than relying on NPS alone.
Consider a customer disputing a fraudulent charge. If the bank resolves the dispute in one call, CSAT for that interaction might be high. But if the customer had to fight for the refund, CES would be poor, and if the whole ordeal made them consider switching banks, NPS would drop too. Reading all three together shows the full story a single score would hide.
How to measure and improve your bank’s NPS
Improving your bank’s NPS starts with measuring it consistently, then acting on what detractors and passives are actually telling you.
Bain & Company’s research on the link between NPS and growth found that industry NPS leaders tend to outgrow their competitors by more than two times, which is part of why banks treat loyalty tracking as a growth metric, not just a satisfaction check. The score itself doesn’t move anything on its own. What moves it is what a bank does after the survey closes.
- Run the survey consistently.
Use a standard 0 to 10 question, sent quarterly at minimum, so scores are comparable over time. - Segment the results.
Break scores out by product line, channel, and customer tenure to see where loyalty is strongest and weakest. - Follow up with a why question.
A short open-ended follow-up turns a number into an explanation you can act on. - Close the loop.
Reach out to detractors directly, and thank promoters in a way that encourages referrals. - Benchmark quarterly.
Compare your score against the current industry average, not last year’s, since the baseline is moving fast in 2026.
QuestionPro Customer Experience supports this cycle end to end, from survey design through closed-loop follow-up and dashboards that track trends by segment. Banks and credit unions in financial services organizations use it to see NPS, CSAT, and CES together instead of managing three separate tools.
Common mistakes banks make with NPS
The most common NPS mistakes in banking involve treating the score as a report card instead of a feedback loop.
- Surveying once a year.
Annual surveys miss the kind of quarter-to-quarter swings seen in 2026, where a bank’s score can move 20 points in three months. - Ignoring passives.
Passives are the easiest group to convert into promoters, but many programs focus only on detractors. - Not closing the loop.
Collecting scores without following up on negative feedback signals to customers that their input doesn’t matter. - Comparing against outdated benchmarks.
A “good” score from 2025 may already be below average in 2026. - Surveying only after account opening.
Loyalty is built and lost at everyday touchpoints like disputes, fee changes, and app updates, not just onboarding. - Turning NPS into an individual employee scorecard.
Tying frontline staff bonuses directly to survey scores tends to encourage gaming the survey rather than fixing the underlying experience.
Loyalty in banking is being rebuilt one experience at a time
The banks pulling ahead in 2026 aren’t necessarily the biggest ones. They’re the ones responding fastest to what customers are already telling them through NPS, CSAT, and CES data.
That’s a meaningful shift from a few years ago, when scale and branch networks did more of the work. In a year where the sector average dropped this fast, consistent measurement and quick follow-up are what separate the banks gaining ground from the ones losing it.
Frequently Asked Questions (FAQs)
Quarterly at minimum, using a consistent question and scale. Many banks also run continuous “transactional” surveys after specific events, like a dispute or a new account opening, alongside the broader relationship survey to catch problems in real time.
Yes. Product-level NPS often differs meaningfully from a bank’s overall relationship score. A customer can love their credit card rewards while feeling frustrated with checking account fees, so segmenting by product reveals problems a blended score would hide.
With caution. National averages blend very different customer bases and regions. A small bank is usually better served by tracking its own score over time and comparing against similarly sized peers rather than against giants like Capital One or Chase.
Not necessarily. A negative score means detractors outnumber promoters, which is serious, but in Q1 2026 it happened sector-wide amid rate and fee pressure. Context matters: a negative score alongside a sector-wide decline points to industry conditions, not just internal failure.
Most banks see 15 to 30 percent response rates on email-based NPS surveys, with higher rates for in-app or post-transaction surveys. Response rate matters because a small, self-selected sample can skew a score in either direction.



