
Most companies guess at their price. Then they find out the hard way when sales don’t match expectations. Pricing research replaces that guesswork with real customer data.
In this blog, we cover:
- What pricing research measures, and how it differs from behavioral or dynamic pricing
- The four core pricing research methods: Van Westendorp, conjoint analysis, monadic testing, and Gabor-Granger
- A step-by-step process for running your own study
- The mistakes that quietly ruin pricing surveys
Get the price right, and you protect both margin and customer trust. Get it wrong, and you either scare away buyers or leave money on the table. Let’s start with what pricing research actually measures.
What is pricing research?
Pricing research is a method for testing what customers will actually pay for a product or service. It relies on real survey data, not internal guesswork.
This research measures demand at different price points. It also measures the trade-off customers make between price and features, and how they might react to a competitor’s price change.
The goal is not a single number pulled from a spreadsheet. Good pricing research maps a full range of reactions: the price that looks expensive, the price that looks like a bargain, and the price so cheap it raises doubts about quality.
Because it relies on structured questions, pricing research produces data you can defend in a boardroom. A hunch cannot do that. Companies typically run it before a launch, before a price change, or on a regular cycle to keep pricing aligned with the market.
How is pricing research different from behavioral pricing and dynamic pricing?
These three terms get used interchangeably, but they happen at different times. Pricing research is the study you run before you set a price. Behavioral pricing and dynamic pricing are strategies you apply afterward, once pricing data already exists.
| Term | What it does | When it’s used |
|---|---|---|
| Pricing research | Surveys customers to find an acceptable price range before a launch or price change | Before setting or revising a price |
| Behavioral pricing | Frames prices using patterns in customer behavior, like anchoring or bundling | After launch, to shape perception of an existing price |
| Dynamic pricing | Adjusts prices automatically based on demand, inventory, or competitor moves | Ongoing, for products with fluctuating demand, like travel or ride-hailing |
For more on how anchoring and framing shape what feels like a fair price, see our guide to behavioral pricing.
Why does pricing research matter?
Price is one of the fastest levers a business has for improving profit. A mistake in either direction is costly. Price too high, and buyers walk away before they try the product. Price too low, and the business quietly loses money while signaling low quality.
The stakes are bigger than most teams expect. McKinsey found that a 1% price increase can raise operating profit by roughly 8%, assuming volume holds steady. That is a bigger impact than a matching cut in costs. Pricing research is how a company finds that extra percentage point without losing customers.
Beyond the headline number, pricing research also gives a company real advantages.
- A defensible price range grounded in customer answers, not internal opinion
- Clarity on price elasticity, so leadership knows how much room exists to move price
- Insight into which features customers will actually pay more for
- A way to test a price before a launch fails, instead of after
What are the main pricing research methods?
There are four pricing research methods that come up again and again. Each one suits a different kind of decision. Some work best for brand-new products with no market precedent. Others work better once a product exists and the goal is fine-tuning.
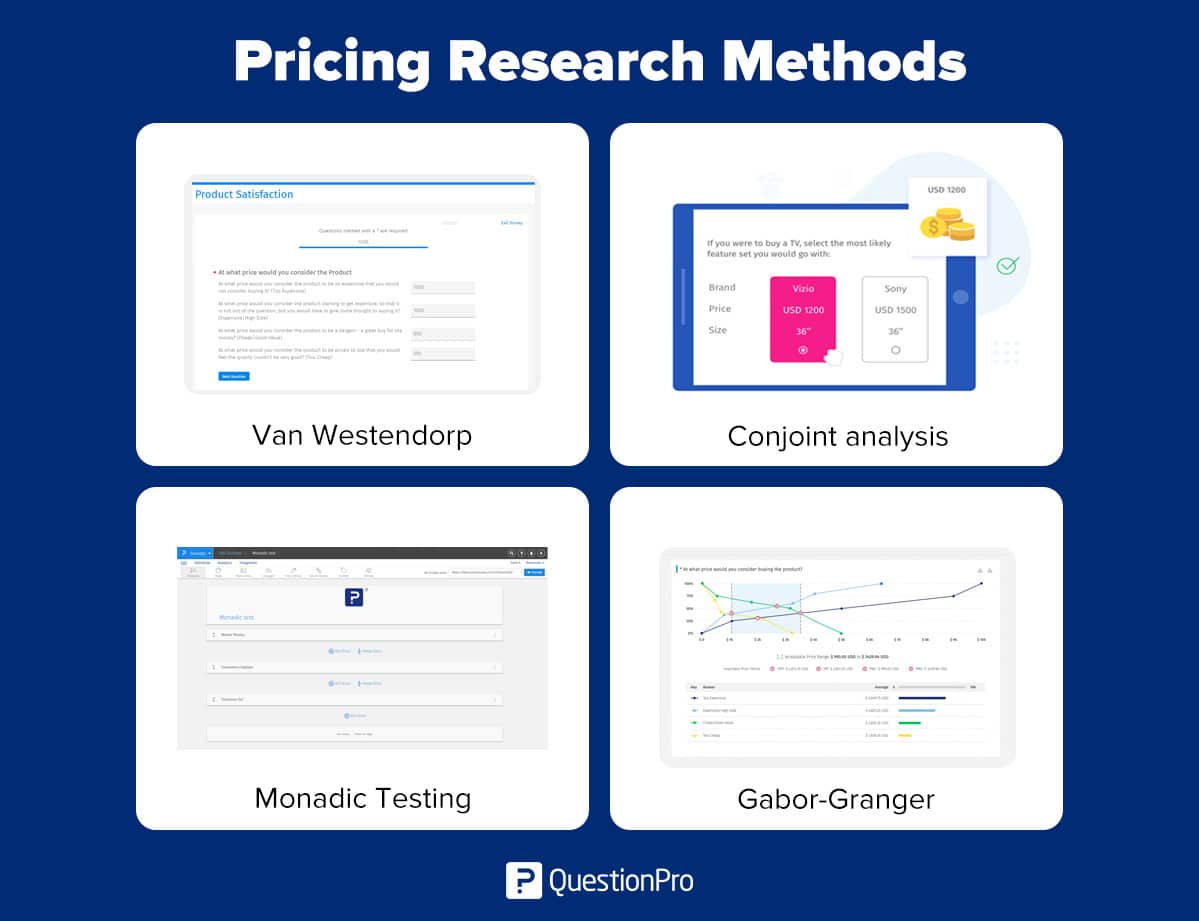
What is the Van Westendorp Price Sensitivity Meter?
The Van Westendorp Price Sensitivity Meter asks customers four questions to map an acceptable price range. It works well for a new or unfamiliar product. Instead of asking for one number, it asks for four.
- At what price would this product be too expensive to consider?
- At what price would it start to feel expensive, but still worth considering?
- At what price would it feel like a bargain?
- At what price would it feel so cheap that you’d question the quality?
Plotting the answers reveals an acceptable price range. It also shows the point where rising prices start driving customers away. This method works best when there is no direct competitor to compare against, since it relies on perception rather than a head-to-head choice.
What is conjoint analysis?
Conjoint analysis shows customers several product versions, each with a different mix of features and price. It asks which version they would buy. This reveals what customers actually value, rather than what they say they value in a direct question.
Picture a subscription box for fitness gear. Option A pairs resistance bands and a water bottle for $39. Option B pairs a yoga mat and workout guide for $49, while Option C bundles all three items for $59. A survey of 1,000 people might show Option B winning by a wide margin. Not because it has the most items, but because it strikes the best balance of usefulness and price. That result tells a business more about what to bundle than a direct price question ever could.
What is monadic testing?
Monadic testing shows each respondent only one price point. Their answer is not biased by comparing it to other options. A study testing a new productivity app subscription might look like this.
- Group A sees a $5 per month plan
- Group B sees a $10 per month plan
- Group C sees a $15 per month plan
Each group answers the same two questions. Would you subscribe at this price? How valuable does this plan feel? If Group B shows the strongest interest, that price point is likely the sweet spot. Because each person only sees one price, the responses stay clean and close to how people actually decide.
What is the Gabor-Granger method?
The Gabor-Granger method estimates price elasticity by raising or lowering a price based on each answer. It follows a simple sequence.
- Ask whether the respondent would buy at a starting price, for example $49 for an online course.
- If they say yes, ask again at a higher price, such as $59.
- If they say no, ask again at a lower price, such as $39.
- Repeat across hundreds of respondents to find where “yes” answers start turning into “no.”
The price where most people stop saying yes is the revenue sweet spot. It balances buyer interest against the highest price the market will support.
How do you choose the right pricing research method?
The right method depends on the decision you need to make, not on which technique sounds the most advanced.
| If your situation is… | Use… |
|---|---|
| A brand-new product with no direct competitor to benchmark against | Van Westendorp |
| Deciding between several feature-and-price bundles | Conjoint analysis |
| Testing a single new price point for an existing product | Monadic testing |
| Estimating a demand curve and a revenue-maximizing price | Gabor-Granger |
Whichever method you pick, the results are only as good as the target audience you survey. A study run on the wrong audience produces a confident, well-charted, and useless price. For more scenarios, including tiered software pricing and bundle testing, see our broader guide to pricing research methods.
How do you run a pricing research study step by step?
Running a pricing research study follows a consistent process, regardless of the method.
- Define your objective. Decide what decision the research needs to support, such as setting an entry price or comparing a subscription against a one-time purchase.
- Choose your audience. Use demographic filters, behavioral data, or CRM segmentation so respondents actually resemble your real buyers.
- Select the right method. Match the method to the decision: Van Westendorp for ranges, conjoint analysis for trade-offs, monadic testing for a single price, Gabor-Granger for elasticity.
- Build a simple pricing survey. Keep the language plain. Use sliders or side-by-side comparisons where the method calls for them.
- Send it out and collect responses. Distribute through your existing channels and confirm respondents match your target customer profile.
- Review the results. Look for where interest peaks and where it drops off, then translate that into a pricing decision.
How do you measure and evaluate pricing research results?
You evaluate pricing research by sample size and response quality, not gut feeling. A method is only as reliable as the completed responses behind it. Each method has its own threshold.
- Van Westendorp: at least 150 completed responses per segment, so the cumulative price curves stay stable
- Conjoint analysis: 200 to 300 completed responses, more if testing many attributes
- Monadic testing: 100 to 150 completed responses per price group, since each group only sees one price
- Gabor-Granger: at least 100 responses per price ladder to find a reliable drop-off point
Plot the responses against price sensitivity to see exactly where interest holds steady. A result built on too few responses might look tidy on a chart. It will not hold up once the price goes live.
What common mistakes should you avoid in pricing research?
A handful of mistakes show up in pricing studies again and again. Each one quietly undermines the result.
- Trusting a direct willingness-to-pay question. People tend to guess low or negotiate in their head rather than reveal a real number.
- Surveying the wrong audience. A study run on people who would never buy the product tells you nothing, no matter how large the sample.
- Ignoring competitor context. A price that looks acceptable in isolation can still feel expensive next to a cheaper alternative customers already know.
- Running the study only once. Costs, competitors, and expectations shift over time, so a two-year-old study is a poor guide to today’s price.
- Overloading respondents with price points. Showing one person too many prices causes fatigue and flattens out real preferences.
How can QuestionPro support a pricing research study?
QuestionPro includes built-in question types for Van Westendorp, Gabor-Granger, and conjoint analysis. You can set these up without building the logic from scratch. Two things make this useful in practice.
- Live dashboards that plot price curves as responses come in, instead of waiting for a manual export
- A connected sample panel through QuestionPro’s pricing research tools, for teams without their own respondent list
Your price is a hypothesis, treat it like one
Pricing research will not hand you one perfect number. No method promises that. What it gives you is a defensible range, backed by real customer answers, that turns pricing from a guess into a tested decision.
Revisit that decision as your product and market change. The price that was right at launch rarely stays right forever.
Frequently Asked Questions (FAQs)
A direct willingness-to-pay question produces unreliable answers, because people tend to guess low or mentally negotiate rather than reveal a true number. Structured methods like Van Westendorp or conjoint analysis use multiple questions or trade-offs to correct for that bias.
Most companies revisit pricing research every 6 to 12 months, or immediately before a major launch, a new market entry, or a planned price change. Costs, competitor pricing, and customer expectations shift enough within a year to make older data unreliable.
Yes. Van Westendorp, conjoint analysis, and Gabor-Granger all work for services like subscriptions, consulting packages, or software tiers. The only requirement is that respondents can clearly picture what they’re paying for, so a short description usually comes first.
Treating the entire acceptable price range as a single “correct” price is a common error. The range shows where demand holds steady, but the final price still depends on margin targets and competitor pricing, not the survey data alone.
Combining methods is common and often stronger than relying on one. A typical approach pairs Van Westendorp to find a broad acceptable range with conjoint analysis or Gabor-Granger to pinpoint a specific number inside that range.
Not always, but price does signal quality up to a point. Pricing research consistently shows a “too cheap” threshold where interest drops because buyers start doubting the product, which is why underpricing can hurt sales as much as overpricing.