Turn live insights into presentation-ready stories – without rebuilding every chart by hand.
Business intelligence is most valuable when insights move quickly from analysis to action. But for many teams, the last mile of reporting still involves copying charts, taking screenshots, reformatting slides, and checking that every number matches the dashboard.
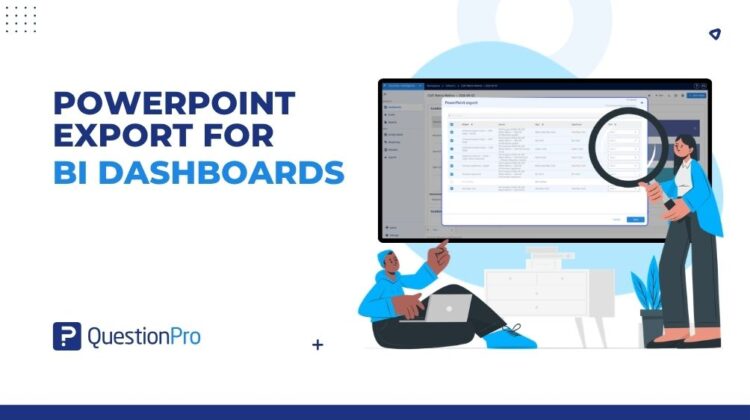
PowerPoint export for QuestionPro BI brings the dashboard and presentation workflows closer together. With a few clicks, users can select supported dashboard widgets and generate a structured PowerPoint deck that is ready to review, refine, and share.
Spend less time rebuilding reports
Dashboards are designed for exploration. Presentations are designed for communication. Moving information between the two should not require hours of repetitive work.
PowerPoint export helps teams:
- Create presentation-ready decks faster by moving selected dashboard content directly into slides.
- Reduce manual errors caused by copying values or rebuilding visualizations.
- Keep reporting consistent by carrying widget names and dashboard context into the presentation.
- Make insights easier to share with stakeholders who prefer a familiar slide-based format.
Choose the insights that matter
Not every presentation needs the entire dashboard. The export flow lets users focus the deck on the widgets that support the story they want to tell. Depending on the dashboard configuration, this can include charts, scoring visualizations, tables, matrices, response summaries, and text-analysis widgets.
Clear widget titles make the relationship between the dashboard and the exported slides easy to understand. This is especially useful when a deck is reviewed by someone who did not build the original dashboard.
How it works
- Open the required QuestionPro BI dashboard.
- Start the PowerPoint export and review the available widgets.
- Select the dashboard content you want to include.
- Generate the deck and continue working in PowerPoint.
The result is a focused presentation that follows the dashboard’s reporting structure while giving teams the flexibility to add commentary, recommendations, and next steps.
Built for recurring reporting
The feature is particularly valuable for workflows where dashboards regularly become executive updates, client reviews, research readouts, or operational reports. Instead of starting from a blank slide every time, teams can use the dashboard as the source and spend their time explaining what the results mean.
Common use cases include:
- Executive and leadership updates
- Client and stakeholder presentations
- Survey and customer-experience readouts
- Quarterly business reviews
- Team performance and operational reporting
The story shouldn’t stop at the dashboard
A dashboard can reveal the signal. The next step is making sure the right people can see it, understand it, and act on it.
PowerPoint export shortens that journey. Instead of spending the final mile rebuilding charts, teams can move directly from analysis to narrative—adding context, recommendations, and next steps while the story stays anchored to the source dashboard.
When an insight is ready to move the conversation forward, the deck should not be the delay. Select the widgets that matter, export them, and spend the time you save deciding what happens next.