Turn open-ended feedback into analysis-ready themes, sub-themes, and sentiment, then use them across QuestionPro BI.
Customer feedback is often richest when people can answer in their own words. Open-ended responses reveal the reasons behind a score, the moments that shaped an experience, and the issues customers care about most. But that richness has a trade-off. Qualitative feedback takes time to review, is difficult to compare at scale, and often sits outside the quantitative analysis used for dashboards and reporting.
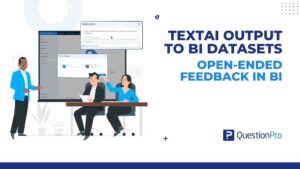
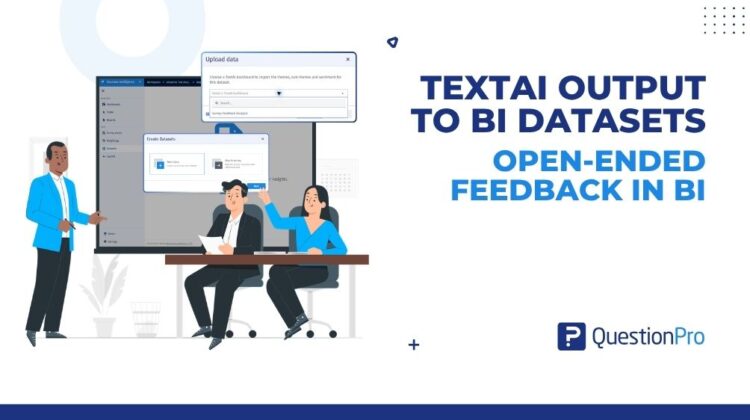
TextAI Output Support in BI Datasets makes that feedback usable in BI. It brings the themes, sub-themes, and sentiment generated by TextAI back into datasets, where they can be analyzed alongside survey answers, operational fields, customer segments, and other structured data.
Teams can now analyze written feedback with the same tools they use for quantitative data.
From text analysis to analysis-ready data
TextAI helps users understand large volumes of written feedback by identifying the recurring subjects and emotional signals within responses. The resulting outputs are not limited to the TextAI dashboard. They become reusable dimensions inside BI:
- Themes capture the broad topics that appear across responses.
- Sub-themes provide a more detailed view of the specific issues, needs, or experiences within each topic.
- Sentiment indicates the tone of the feedback, helping teams distinguish positive, neutral, mixed, and negative experiences.
Once these outputs are available in a dataset, teams can count, compare, filter, segment, and visualize them. What began as unstructured language becomes a set of consistent, analysis-ready fields without losing the context that made the original feedback valuable.
Two ways to bring TextAI output into datasets
The workflow supports both external data and QuestionPro survey data, so teams can use the route that matches how their TextAI dashboard was created.
External dataset route
When a TextAI dashboard is created from an external dataset, its generated output can be synchronized back to that same dataset. The original uploaded variables remain available, while the TextAI themes, sub-themes, and sentiment are added as new fields.
This makes it possible to analyze text-derived insights together with the structured columns already present in the file, for example, region, product, channel, customer type, account tier, or satisfaction rating.
Survey route
When a TextAI dashboard is created from a survey, users can create a dataset with Map to survey, choose Map to TextAI, and select a TextAI dashboard associated with that survey. The generated themes, sub-themes, and sentiment are then imported into the mapped dataset.
This route connects the meaning found in open-ended answers with the rest of the survey. Teams can compare what respondents said with how they answered closed-ended questions, while keeping both sources aligned through the same survey.
Build BI dashboards from qualitative insight
Once TextAI output is part of a dataset, it can be used to create BI widgets just like other analysis fields. Teams can build charts and tables that show:
- The most frequently mentioned themes;
- The distribution of sub-themes within a customer experience;
- Sentiment across products, locations, or service channels;
- The relationship between TextAI output and survey or external-data variables; and
- Changes in customer concerns across meaningful slices of the data.
A dashboard can move beyond showing a score alone. It can explain what is driving that score, which issues occur most often, and where positive or negative feedback is concentrated.
Filter, slice, and compare the story behind the numbers
BI filtering and data slicing make the TextAI fields more useful. Users can focus on a particular sentiment, theme, or sub-theme, then narrow the analysis further using another survey question or dataset variable.
For example, a team could examine negative feedback about onboarding for one customer segment, compare product-quality themes across regions, or isolate a service sub-theme for respondents who selected a particular channel. These combinations help teams move from a broad summary to a precise view of the audience, experience, or operational area that requires attention.
Carry the same insight into reports
TextAI dataset fields can also support reporting workflows. Themes, sub-themes, and sentiment can be analyzed against other compatible variables, allowing teams to create cross-tabular views and share a more complete picture with stakeholders.
Instead of manually summarizing comments in one document and presenting survey metrics in another, analysts can bring both into a repeatable reporting process. This improves consistency and makes it easier to refresh the analysis as new data becomes available.
Why this matters
Organizations already collect a great deal of qualitative feedback, but much of its value remains difficult to operationalize. Reading individual comments is essential for context, yet it does not scale well enough for continuous analysis. Purely quantitative reporting scales, but it can miss the reasons behind the numbers.
TextAI Output Support in BI Datasets lets teams use both approaches in one analysis. It helps teams:
- Quantify recurring topics without manually coding every response;
- Connect sentiment and themes with business and survey variables;
- Create consistent dashboards from open-ended feedback;
- Explore specific segments through combined filters and slicing; and
- Reuse the same TextAI output across ongoing analysis and reports.
A clearer path from feedback to action
Open-ended responses tell teams what customers experienced in their own language. TextAI organizes that language into themes, sub-themes, and sentiment. BI datasets make those outputs measurable and reusable. BI dashboards and reports then turn them into views that decision-makers can explore and act on.
This end-to-end flow takes qualitative responses through TextAI and datasets into BI analysis. It helps organizations understand what is happening and why.
With TextAI output available in BI datasets, the voice of the customer becomes part of the same analytical system used to track performance, compare segments, and guide decisions.